- *Corresponding Author:
- H. O. KAILA
National Facility for Drug Discovery through New Chemical Entities Development and Instrumentation Support to Small Manufacturing Pharma Enterprises, Department of Chemistry, Saurashtra University, Rajkot-360 005, India
E-mail: kaila_harshad@yahoo.co.in
| Date of Submission | 16 December 2009 |
| Date of Revision | 23 June 2011 |
| Date of Acceptance | 1 July 2011 |
| Indian J Pharm Sci, 2011, 73 (4): 376-380 |
Abstract
A simple, rapid, precise and accurate isocratic reversed phase stability indicating HPLC method was developed and validated for the simultaneous determination of atenolol and lercanidipine hydrochloride in commercial tablets. The chromatographic separation was achieved on phenomenex Gemini C18 (250×4.6 mm, 5 μm) column using a mobile phase consisting of acetonitrile and buffer (20 mM potassium dihydrogen phosphate pH 3.5) in the ratio of (55:45, v/v) at a flow rate of 1.0 ml/min and UV detection at 235 nm. The linearity of the proposed method was investigated in the range of 40-160 μg/ml (r2=0.9995) for atenolol and 8-32 μg/ml (r2=0.9993) for lercanidipine. Degradation products produced as a result of stress studies did not interfere with the detection of atenolol and lercanidipine and the assay can thus be considered stability-indicating.
Keywords
Atenolol, antihypertensive, lercanidipine hydrochloride, stability-indicating assay, simultaneous HPLCUV, validation
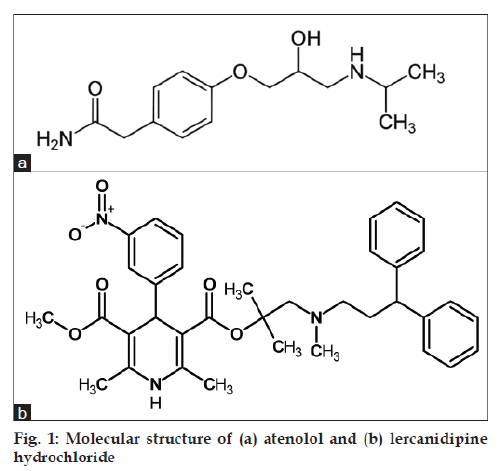
Atenolol (ATE), 4-[2-hydroxy-3-[(1-methylethyl) amino] propoxy] benzeneacetamide (fig. 1) is a selective ß1-adrenoceptor antagonist. Lercanidipine hydrochloride (LER), 1,4-dihydro-2,6-dimethyl- 4-(3-nitrophenyl)-3,5-pyridinedicaboxylic acid 2-[(3,3-diphenylpropyl)methylamino]-1,1- dimethylethyl methyl ester hydrochloride (fig. 1). Lercanidipine is a third generation dihydropyridine calcium antagonist with a bulky bis-phenylalkylamine side chain, which makes it more lipophilic than most other in its class.
There are many reported methods for analysis of ATE [1-4] or LER [5-7] either alone or in combination with other drugs in pharmaceutical dosage forms or individually in biological fluids. Simultaneous spectrometric estimation of atenolol and lercanidipine hydrochloride in tablet dosage form has been reported [8]. None of the reported analytical methods describe a stability indicating method for the simultaneous determination of ATE and LER in presence of their degradation products. The objective of this work was to develop a stability–indicating HPLC method for combination drug products of ATE and LER. This method is also applicable for other commercially available drugs.
Materials and Methods
HPLC system (Waters 2489, Milford, USA) consisting of quaternary gradient pump (TM 600), rheodyne manual injector with 20 μl loop, column oven and UV detector was employed for analysis. Chromatographic data was acquired using Empower software.
Working standards of atenolol and lercanidipine were provided by Emcure pharmaceuticals, Pune, India. A tablet containing 50 mg ATE and 10 mg LER (Lotensyl AT; Sun Pharmaceuticals, Vadodara, India) was obtained commercially.
HPLC grade acetonitrile and orthophosphoric acid were obtained from Merck India Limited, Mumbai. Analytical grade hydrochloric acid, sodium hydroxide pellets and hydrogen peroxide solution 30% (v/v) were obtained from Ranbaxy Fine Chemical (New Delhi, India) and 0.45 μm membrane filter was obtained from Pall life sciences (Mumbai, India). High purity deionised water was obtained from Millipore, Milli-Q (Milford, USA) purification system.
Chromatographic conditions:
Phenomenex Gemini C18 (250×4.6 mm, 5 μm) column used as a stationary phase. The isocratic mobile phase consisting of acetonitrile and buffer (20 mM potassium dihydrogen phosphate, pH 3.5 adjusted with orthophosphoric acid) in the ratio of (55:45, v/v) was used throughout the analysis. The flow rate of the mobile phase was 1.0 ml/min. Detector signal was monitored at wavelength of 235 nm. The column temperature was kept ambient and injection volume was 20 μl.
Preparation of standard solution:
Standard stock solution containing ATE (500 μg/ml) and LER (100 μg/ml) was prepared by transferring 50 mg ATE and 10 mg LER working standard into a 100 ml volumetric flask. A 40 ml portion of diluent (acetonitrile-water 50:50, v/v) was added, sonicated and cooled to room temperature. The solution was diluted to the mark with diluent. Standard solution containing ATE (100 μg/ml) and LER (20 μg/ml) was prepared by pipetting 10 ml stock solution into a 50 ml volumetric flask and diluting to volume with diluent.
Preparation of sample solution:
Twenty tablets were weighed and the average weight was calculated. The tablets were crushed with a mortar and pestle for 10 min. A portion of powder equivalent to the weight of one tablet was accurately weighed and transferred to a 100 ml volumetric flask. Approximately 50 ml diluent was added and the mixture was sonicated for 15 min with intermittent shaking. The contents were restored to room temperature and diluted to volume with diluent to furnish stock test solution. The stock solution was filtered through 0.45 μm membrane filters and 10 ml of the filtered solution was transferred to a 50 ml volumetric flask and diluted to volume with diluents to give test solution containing 100 μg/ml ATE and 20 μg/ml LER.
Forced degradation studies:
Tablet powder equivalent to the weight of one tablet was transferred to 250 ml round bottomed flask and treated under acidic, alkaline, oxidizing, thermal and photolytic stress conditions. When degradation was complete, the solution were left to equilibrate to room temperature and diluted with diluents to furnish solutions of concentration equivalent to 100 μg/ml ATE and 20 μg/ml LER. The specific conditions are described below.
In acidic degradation drug was heated under reflux with 1M hydrochloric acid for 30 min at 80° on oil bath and the drug was treated with 0.1N NaOH at room temperature for 2 h in alkaline degradation. Then resulting solution was neutralized. The drug was treated with 2% (v/v) H2O2 at room temperature for 2 h in oxidative degradation.
Thermal degradation was performed by exposing the solid drug to dry heat in a convection oven at 70° for 72 h and photolytic degradation was performed by exposing the drug to sunlight for 72 h.
Validation procedure:
In the system suitability standard solution of 100 μg/ ml ATE and 20 μg/ml LER (n=5) was prepared and injected. Then system suitability parameters like retention time, theoretical plates, peak asymmetry and resolution were calculated from the chromatogram.
The specificity of the method was evaluated by assessing interference from excipients in the pharmaceutical dosage form prepared as a placebo solution. The specificity of the method for the drug was also established by checking for interference with drug quantification from degradation products formed during the forced degradation study.
Test solutions for assessment of the linearity of the method where prepared at seven concentrations from 40 to 160% of the analyte concentration in the assay (i.e. 40, 60, 80, 100, 120, 140 and 160 μg/ml for ATE and 8, 12, 16, 20, 24, 28 and 32 μg/ml for LER). Peak area and concentration data were then evaluated by linear regression analysis.
The precision of the method, as intra-day repeatability was evaluated by performing six independent assays of the test sample preparation and calculating the RSD %. The intermediate (interday) precision of the method was checked by performing same procedure on different days by another person under the same experimental conditions.
Accuracy was studied by adding three different amounts (corresponding to 50, 100 and 150% of the test preparation concentrations) of ATE and LER to the placebo preparation and comparing the actual and measured concentrations. For each level, three solutions were prepared and each was injected in duplicate.
The robustness was studied by evaluating the effect of small but deliberate variations in the chromatographic conditions. The conditions studied were flow rate (altered by ±0.1/min), mobile phase composition (by using 57:43 and 53:47 v/v acetonitrile:buffer pH 3.5), buffer pH (altered by ±0.2) and use of HPLC columns from different batches.
Sample solution stability was evaluated by shorting the solution at ambient temperature and at 2-5° and analysis after 6, 12, 24, 36 and 48 h. The responses from the aged solutions were compared with those from freshly prepared standard solution.
Results and Discussion
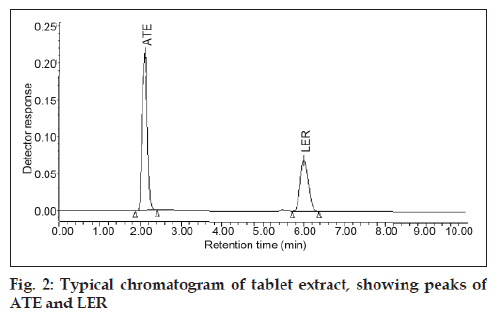
In this work HPLC method with UV detection for analysis of ATE and LER in a tablet formulation was developed and validated. The analytical conditions were selected after testing the different condition effecting HPLC analysis, for example diluent and buffer composition, buffer concentration, organic solvent in the mobile phase, buffer to organic solvent ratio and other chromatographic conditions. Preliminary trials with mobile phases comprising mixtures of water with methanol or acetonitrile did not give good peak shape. The best peak shape was obtained by use of 0.02 M potassium dihydrogen phosphate buffer, adjusted to pH 3.5 with phosphoric acid and use of mobile phase of composition 55:45 (v/v) acetonitrile-0.02 M potassium dihydrogen phosphate buffer. Acetonitrile chosen as a organic constituent of the mobile phase to reduce retention times and buffer was chosen to reduce peak asymmetry and achieve good peak shape. The optimized mobile phase enabled good resolution of ATE and LER and of compounds generated during forced degradation. As shown in fig. 2, ATE and LER were eluted after 2.12 and 6.05 min, respectively. The newly developed analytical method was validated according to the ICH guidelines [9,10] and its updated international convention [11], USP [12] and AOAC International [13].
System suitability was verified by measurement of peak asymmetry (A<2.0), resolution (Rs>3.0) and number of theoretical plates (N>2000) after chromatography of standard solution. The values of these properties were in accordance with in-house limits.
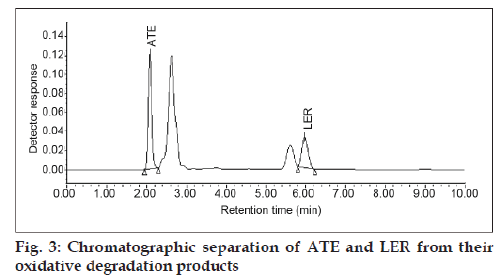
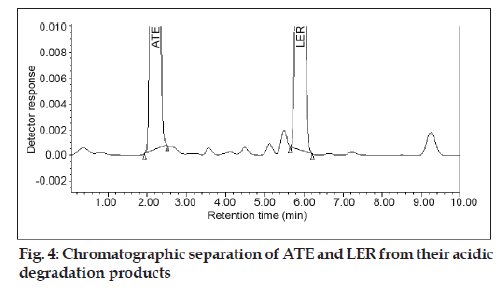
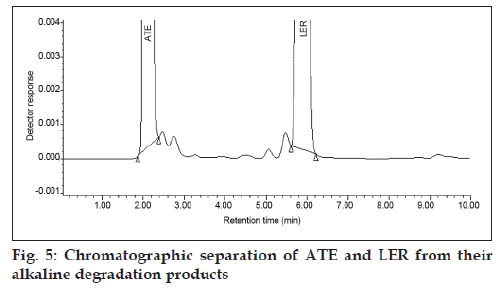
The specificity of the method was determined by checking for interference with the analytes from placebo components by measuring peak purity for ATE and LER during the forced degradation study. Peak purity was satisfactory under the different stress conditions. There was no interference from any degradation product peak with the drug peaks. Fig. 2 shows the chromatograms of untreated drugs in tablet solution. ATE showed extensive degradation in oxidative conditions while extensive degradation of LER occurred in acidic conditions as shown in (fig. 3) and (fig. 4), respectively. Both drugs show normal degradation in alkaline conditions as shown in (fig. 5). Table 1 indicated the extent of degradation results of ATE and LER under various stress conditions.
| Stress condition | Degradation, % | |
|---|---|---|
| ATE | LER | |
| Thermal | 3.1 | 3.4 |
| Photolytic | 2.2 | 16.8 |
| Acidic | 9.4 | 36.0 |
| Alkaline | 6.2 | 8.3 |
| Oxidative | 50.0 | 16.1 |
Table 1: Forced Degradation Study Data
ATE and LER showed linearity in the range of 40-160 μg/ml and 8-32 μg/ml, respectively. The linear regression equations were y=16456x+11776, correlation coefficient 0.9995 for ATE and y=47672x+7888, correlation coefficient 0.9993 for LER, where x is the concentration in μg/ml and y is the peak area in absorbance units.
The limits of detection and quantification were evaluated by serial dilution of ATE and LER stock solution until the signal-to-noise ratios were 3:1 for LOD and 10:1 for LOQ. The LOD for ATE and LER were 0.02 and 0.05 μg/ml, respectively; the LOQ were 0.05 and 0.1 μg/ml, respectively.
The relative standard deviations were 0.47% for ATE and 0.27% for LER, which are well within the acceptable limit of 2.0%. The RSDs for intermediate precision were found to be 0.21% for ATE and 0.30% for LER. The recovery of ATE and LER from placebo was determined at three different concentrations. Mean recovery was 98.54-101.54% for ATE and 98.81–100.86% for LER (Table 2).
| Drug | Level (%) | Theoretical | Observed | Mean recovery (%) | RSD (%) |
|---|---|---|---|---|---|
| concentration (μg/ml)a | concentration (μg/ml)a | ||||
| ATE | 50 | 50.14 | 50.91 | 101.54 | 0.27 |
| 100 | 100.01 | 98.92 | 98.91 | 0.15 | |
| 150 | 149.66 | 147.48 | 98.54 | 0.08 | |
| LER | 50 | 10.13 | 10.22 | 100.86 | 0.79 |
| 100 | 20.15 | 19.91 | 98.81 | 0.64 | |
| 150 | 30.13 | 30.36 | 100.77 | 0.08 |
Table 2: Accuracy Study Data
In all deliberately varied conditions, the RSD of peak areas of ATE and LER were found to be well within the acceptable limit of 2.0%. The tailing factor and asymmetry for both the peaks were found to be <1.2%.
The results obtained from study of the stability of the test preparation, It was concluded the test solution was stable for up to 48 h at 2-5° and at ambient temperature, because difference between measured and original values were <2.0%.
Proposed HPLC method is specific, accurate and precise for the simultaneous determination of atenolol and lercanidipine hydrochloride from pharmaceutical dosage form. The described method is suitable for routine analysis and quality control of pharmaceutical preparations containing atenolol, lercanidipine, nifedipine, indapamide, hydrochlorothiazide and amlodipine either as such or in combination with atenolol. The method can be used to separate these drugs from their degradation products and excipients found in the tablet dosage form.
Acknowledgements
The authors are grateful to the Emcure Pharmaceuticals, Pune, India and Department of Chemistry, Saurashtra University (UGC-SAP Sponsored and DST-FIST Funded) Rajkot, India, respectively, for the gift samples of atenolol and lercanidipine hydrochloride reference standard and for providing instrumental facilities. Special thanks are due to “National Facility for Drug Discovery through New Chemical Entities (NCE’s) Development and Instrumentation Support to Small Manufacturing Pharma Enterprises” Programme under Drugs and Pharma Research Support (DPRS) jointly funded by Department of Science and Technology, New Delhi, Government of Gujarat Industries Commissionerate and Saurashtra University, Rajkot.
References
- Lamprecht G, Kraushofer T, Stoschitzky K, Lindner W. Enantioselective analysis of (R)-and (S) atenolol in urine sample by a high performance liquid chromatography column switching setup. J Chromatogr B 2000;740:219-26.
- Sivakumar T, Venkatesan P, Manavalan R, Valliappan K. Development of a HPLC method for the simultaneous determination of losartan potassium and atenolol in tablets. Indian J Pharm Sci 2007;69:154-7.
- Barman R, Islam MA, Ahmed M, Wahed M, Islam R, Khan A, et al. Simultaneous high performance liquid chromatographic determination of atenolol and amlodipine in pharmaceutical. Pakistan J Pharm Sci 2007;20:274-9.
- Chheta N, Gandhi SP, Rajput SJ. Development and validation of a stability indicating high performance liquid chromatographic method for atenolol and hydrochlorthiazide in bulk and tablet formulation. Int J Chem Tech Res 2009;1:654-62.
- Shirkhedkar AA, Deore PV, Surana SJ. UV-spectrophotometric determination of lercanidipine hydrochloride in bulk and tablet. Biotechnol Res Asia 2007;4:753-4.
- Appala RS, Karadi AB, Manjunath S. A high performance liquid chromatographic assay for lercanidipine hydrochloride. Int J Chem Sci 2008;6:441-6.
- Alvarez-Lueje A, Pujol S, Squella JA, Nunez-Vergara LJ. A selective HPLC method for determination of lercanidipine in tablets. J Pharm Biomed Anal 2003;31:1-9.
- Deore PV, Shirkhedkar AA, Surana SJ, Patel RC. Simultaneous spectrophotometric estimation of atenolol and lercanidipine hydrochloride in tablet dosage form. J Pharm Res 2008;7:204-5.
- ICH, (Q1AR2), Harmonized Tripartite Guideline, Stability testing of New Drug Substances and Products, IFPMA, In: Proceeding of the International Conference on Harmonization, Geneva. Feb 2003.
- ICH, (Q2R1), Harmonized Tripartite Guideline, Validation of analytical procedures: Text and Methodology, IFPMA, Geneva. Nov 2005.
- ICH, Guidance on Analytical Method Validation, In: Proceeding of the International Convention on Quality for the Pharmaceutical Industry, Toronto, Canada, September 2002.
- The United States Pharmacopoeia. 30th Revision, Rockville, MD. US Pharmacopoeia convention Inc 2007.
- The AOAC International. 17th ed. Gaithersburg, AOAC International Official methods of analysis 2003.
