- *Corresponding Author:
- Hui Yan
School of Biotechnology, Jiangsu University of Science and Technology, Zhenjiang 212000, China
E-mail: yanh1006@163.com
| Date of Submission | 23 August 2017 |
| Date of Revision | 12 April 2018 |
| Date of Acceptance | 19 October 2018 |
| Indian J Pharm Sci 2018;80(6):1136-1142 |
This is an open access article distributed under the terms of the Creative Commons Attribution-NonCommercial-ShareAlike 3.0 License, which allows others to remix, tweak, and build upon the work non-commercially, as long as the author is credited and the new creations are licensed under the identical terms
Abstract
A method for rapid non-destructive detection of eugenol in caryophylli flos was developed with near-infrared spectroscopy and chemometrics. One hundred and three samples were collected, and gas chromatography with internal standard was used to determine the reference value of eugenol in caryophylli flos. Near-infrared spectra were recorded from their powders and pretreated with standard normal variate and 1st derivative, and then a model was built with the chemometrics method, partial least square. Outliers of samples were detected. When 6 factors were adopted in a model, the performance was found to be the best. For prediction set, the slope was 0.9461, the offset was 0.3008, R-square was 0.9388, root mean square error of prediction was 0.6987 %, bias was -0.2815 % and residual prediction deviation was 5.89. The statistical analysis showed the predicted results were consistent with the reference values. It is feasible that near-infrared spectroscopy could be used to rapidly and accurately detect the main active content, eugenol in caryophylli flos as a method of quality control.
Keywords
Caryophylli flos, near-infrared spectroscopy, eugenol, PLS, rapid non-destructive detection
Caryophylli flos are the dried buds of myrtaceae plant Eugenia caryophllata Thunb, with a planting history of over 1000 y [1]. Caryophylli flos is indigenous to Southeast Asia, especially in Indonesia. Nowadays it is cultivated in many other countries including Madagascar, Philippines, India, Zanzibar, Sri Lanka, Tanzania and Brazil. Caryophylli flos is widely used all over the world and the global production was around 138 000 tons in 2014 [2].
Caryophylli flos is a natural preservative and flavouring substance used in food products without harm [3]. An extremely popular natural spice in foods, caryophylli flos has shown good antibacterial, antioxidant and preservation properties [3-6]. In addition, it was reported that it would eliminate free radicals and exhibit antipyretic, analgesic and antiinflammatory properties [7]. Therefore, caryophylli flos has a wide range of applications and prospects.
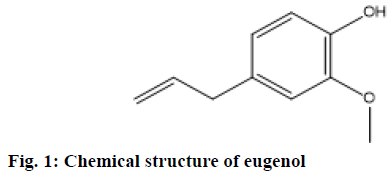
The main component in caryophylli flos is eugenol (PubChem CID: 3314) [8], and structure of which is shown in Figure 1. Eugenol has a special fragrant smell, which can increase people's sensuality as a food flavouring. It is also well-known to produce antimicrobial, local anaesthetic, analgesic, antiinflammatory and antitumor effects [9-15]. The content of eugenol could represent the quality of caryophylli flos and it is mandatory that not less than 11 % (w/w) according to the Chinese Pharmacopoeia [16].
The existing problem is that the content of eugenol in caryophylli flos in the market vary greatly, and it is hard to distinguish differences in quality with naked eyes. The difference in quality of products leads to a chaotic market and disorderly competition. Therefore, there is a need to develop a method to accurately detect the content of eugenol to establish consistent quality in the marketed product. The current method for detecting eugenol in caryophylli flos is a gas chromatography (GC)-based method, which takes longer detection time and is expensive [16]. It is not conducive to fast operation and standardization of marketed caryophylli flos. Therefore, a rapid detection method is in urgent need to supervise the quality of caryophylli flos in its production and market circulation.
Near-infrared spectroscopy (NIRS) is commonly used in non-destructive detection in areas of medicine, such as the non-destructive detection of polysaccharide content in Rosa laevigata and so on [17,18]. The results of such qualitative analysis and quantitative analysis are promising. In this work, we aimed to evaluate the feasibility of using NIRS for rapid and non-destructive measurement of eugenol in caryophylli flos.
Materials and Methods
In order to make the results more convincing, caryophylli flos samples were collected form Bozhou city (Anhui, China) and Yulin city (Guangxi, China). Bozhou city has the largest Chinese herbal medicine market in China, and has the reputation of the pharmaceutical city of China. Yulin city has the largest medicine market in southern China, through which more caryophylli flos enter China from overseas. A total of 103 batches of caryophylli flos were collected in this work, among which 32 batches were from Yulin, and the rest 71 samples were from Bozhou. The collected caryophylli flos samples were originated from many countries including Indonesia, Madagascar, Philippines, Somalia and Malaysia. The geographical origin and batches of samples are shown in Table 1. The varieties of the caryophylli flos samples had some differences to ensure the diversity of the sample, e.g. with different colors (from red to black) and different sizes. They were informally called light red, light black, middle red and deep red. Thus, the samples had a good representation, and model using these samples are expected to have good applicability.
| Year | Geographical origin | Number of batch |
|---|---|---|
| 2015 | Indonesia | 67 |
| Somalia | 7 | |
| Malaysia | 5 | |
| Madagascar | 6 | |
| 2014 | Indonesia | 11 |
| Somalia | 2 | |
| Malaysia | 2 | |
| Madagascar | 3 |
Table 1: The Geographical origin and batches of samples
Spectrum collection
Before collecting spectra, caryophylli flos samples were pulverized and passed through a 40-mesh sieve. The caryophylli flos powder was put in a sample cup and was pressed to obtain a 4 mm layer. NIRFlex N-500 Fourier Near Infrared Spectrometer (Buchi, Switzerland) was employed, using a wavenumber range from 10 000~4000 cm-1 with a resolution of 8 cm-1, to scan 32 times. A tetrafluoroethylene whiteboard was used to get the reference spectrum. Three spectral collections from each caryophylli flos sample were averaged to provide a final spectrum.
GC analysis, preparation of standard solution
The reagents used in this work included n-hexane, eugenol and methyl salicylate as internal standard (IS). Standard eugenol and methyl salicylate samples, 50 mg of each were weighed accurately and added into n-hexane to get a final concentration of 2.00 mg/ml. This solution was further diluted to concentrations of 1.75, 1.50, 1.25 and 1.00 mg/ml, respectively.
Sample extraction
Caryophylli flos powder (0.300 g) for each sample was weighed accurately and added into a 100 ml beaker with 20 ml hexane. After 15 min ultrasonic processing, the preparation was weighed and made up loss of n-hexane, shaken and filtered. Methyl salicylate was mixed with n-hexane to get a final concentration of 4.00 mg/ml. Then, the sample extraction buffer and methyl salicylate were mixed at the ratio of 4:1. Finally, the mixture was stored in the gas bottle for the GC test.
The instrument used for GC analysis was a HP5890 gas chromatograph with a flame ionization detector. A capillary column (19091N-133, Innerwax) was used. The operating temperatures were as follows: column 190°, injection port 230° and detector 280°. The nitrogen flow rate was 1.0 ml/min. One microliter of each sample fraction was injected into the GC.
Definition of calibration and prediction sets
Hierarchical method was used to select calibration and prediction sets [19,20]. Samples were sorted by the eugenol concentration value from small to large, and then all the samples were marked 1, 2 and 3 in proper order. The samples marked 1 and 3 were selected as the calibration set while those marked 2 were as the prediction set. Finally, 69 samples were set as calibration set and 34 samples were set as prediction set.
Spectral data preprocessing
When affected by slight fluctuation of current and environmental temperature, baseline drift and light scattering occur in NIR spectra. In this situation, some preprocessing must be taken to weaken and eliminate interference in spectra. There are numerous preprocessing methods, such as first-order derivative (1st der), second-order derivative (2nd der), standard normal variate (SNV) transformation, mean center [21]. In this study, the spectra were subjected to the SNV procedure applied as scatter correction before the final 1st der with a Savitzky Golay smoothing procedure of 5 data points and a 2nd order polynomial.
Partial least squares (PLS)
PLS are similar to principal component regression (PCR), but it overcomes the shortcoming of PCR, which does not utilize the dependent variable. In PCR, it deals only with independent variable; therefore, errors in dependent variable are not taken into account [17]. In PLS, the dependent variable is also considered. PLS extracts information of the independent variable and dependent variable simultaneously [22], which can reduce the dimensionality of complex data sets effectively, and eliminate the multi-collinearity effects between the independent variable and dependent variable, thus improve model’s reliability and accuracy [23]. In this work, PLS was used to build model.
Model evaluation
A series of parameters for model evaluation including the slope, offset, R-squared, correlation, bias, root mean square error (RMSE) of calibration, cross validation and prediction sets [22] and residual prediction deviation (RPD) were used in this work. The closer the slope is to 1, the data are better modelled. Offset is the intercept of the line with the Y-axis when the X-axis is set to zero. R-squared is calculated from the explained variance plot and tells how good a fit can be expected for future predictions for a defined number of factors, the higher the R-squared (the closer to 1), the stronger the ability to predict the robustness of the model. Correlation is the linear correlation between the predicted and reference values in the plot. The Pearson R2 value is the square of the correlation value and expresses correlation on a positive scale between 0 and 1. Bias is the mean value over all points that either lie systematically above (or below) the regression line. A value close to zero indicates a random distribution of points about the regression line. The RMSE was used to evaluate the feasibility of the model and its predictive ability. The lower and closer the RMSE, the stronger the ability to predict and robustness of the model. The higher the RPD, the more extensive the regression of the chemical value distribution of the model validation, the better the predictive ability of the model. NIR spectral data were preprocessed by using Unscrambler X (Version 10.4, Camo Software AS, Norway).
Results and Discussion
Based on the gas chromatogram of the standard solution and IS, the standard curve was obtained by plotting the peak area of eugenol versus the corresponding amount, respectively. The calibration graph for eugenol was y = 71176x-2222.9, r2 was 0.9991, which show that the calculation of content was accurate and convincing. The descriptive statistic of the content eugenol, including range, mean, standard deviation (SD), skewness, kurtosis and median is shown in Table 2. The range of eugenol content was 0.86-15.14 %. The mean and SD were 10.92 and 2.77 %, respectively, thus, the coefficient of variation (CV) was 25.40 %, which indicated that the quality is not optimistic and the content varied greatly. The skewness was negative –2.28, which is because that the concentration of eugenol in 5 samples, from 0.86 to 3.95 %, were much lower than others. Based on the descriptive statistic, it is shown that the quality of caryophylli flos in market is not optimal, which demonstrated the necessity and significance of rapid detection of caryophylli flos component content to restore the market. Thus, the collected samples have a wide range of sources, and the eugenol content contained in the samples is highly variable and widely distributed, which showing the diversity of the caryophylli flos samples ensured the adequacy of the collected samples.
| Data set | Mean/ % |
Max/ % |
Min/ % |
Range/ % |
SD/ % |
Variance | CV/ % |
RMS | Skewness | Kurtosis | Median/ % |
Q1/ % |
Q3/ % |
|---|---|---|---|---|---|---|---|---|---|---|---|---|---|
| Total | 10.92 | 15.14 | 0.86 | 14.29 | 2.77 | 7.69 | 25.40 | 11.26 | -2.28 | 5.23 | 11.58 | 10.67 | 12.50 |
| Cal | 10.97 | 15.14 | 0.86 | 14.29 | 2.75 | 7.54 | 25.03 | 11.30 | -2.29 | 5.62 | 11.58 | 10.72 | 12.51 |
| Pre | 10.82 | 13.61 | 0.93 | 12.68 | 2.87 | 8.22 | 26.51 | 11.18 | -2.36 | 5.44 | 11.58 | 10.69 | 12.45 |
Table 2: Descriptive statistical analysis of eugenol in sample Data sets
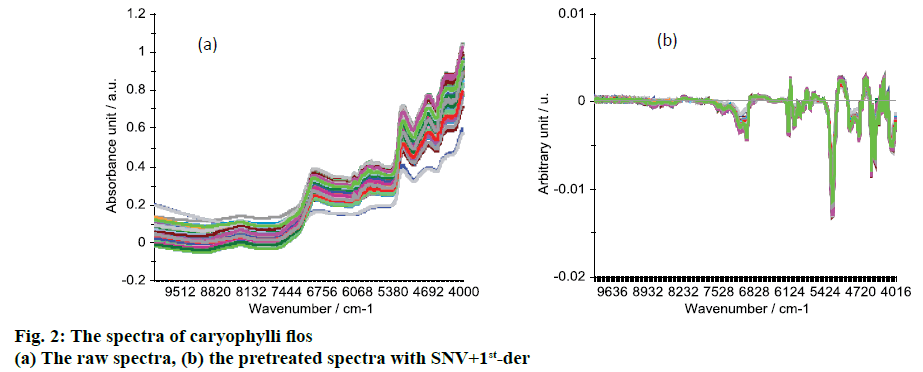
The raw NIR spectra are shown in Figure 2A. There were several peaks, which were the vibration of some groups. The peak around 4680 cm-1 was the combination of N-H bond vibration, peak at 5172 cm-1 was the combination of O-H bond vibrations, peaks from 5980 to 5650 cm-1 were 1st overtone of S-H and C-H bond vibrations, peak at 6980 cm-1 was the first overtone of O-H bond vibrations [17,21,22].
In order to reduce the influence of noise and improve the model’s accuracy and stability, the preprocessing method SNV+1st-der was used to preprocess the raw spectra. The preprocessed spectra are shown in Figure 2B, in which there are several peaks at around 4172-4488, 4736, 4736, 5256, 5628-6136 and 6960 cm-1, and these peaks have differences between the samples. After the pretreatment of SNV+1stder, the influence of noises was reduced and the model’s accuracy should be improved.
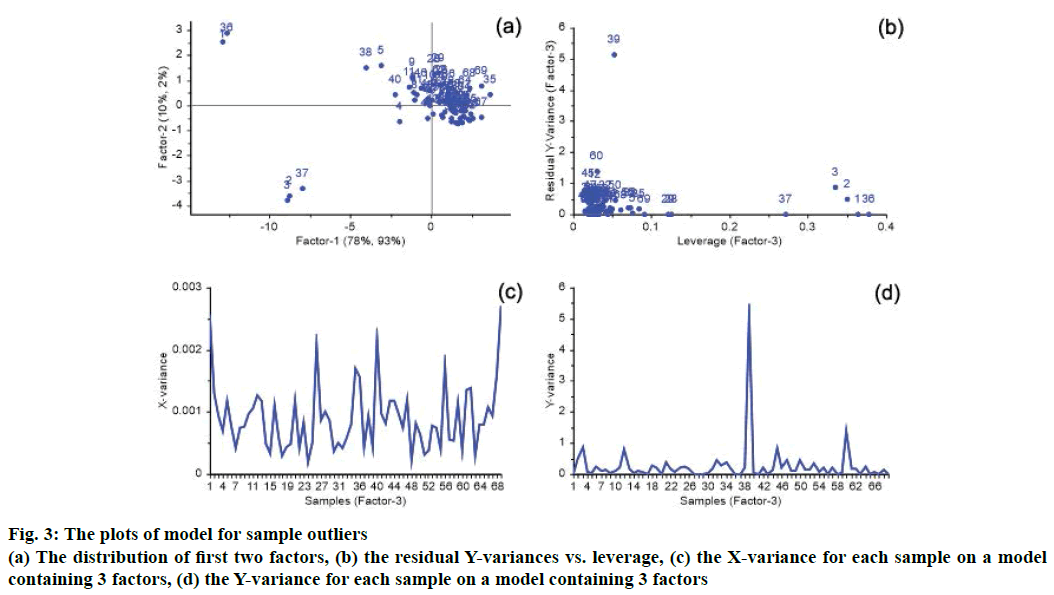
The spectral data or the reference value may have been erroneous, potentially caused by instrumentation setup, detection operation and the external environment. When the error is large, the accuracy of the NIRS model will decrease. A sample may be outlying according to the distribution of factors, residual X-variances, residual Y-variances and leverage. In plots of PLS regression model, if a sample is far away from others, it may be an outlier sample. There is a great possibility of outlier for samples with a high leverage and high residual X- or Y-variance. In this PLS model with the optimal 3 factors, the distribution of factors, residual X-variances, residual Y-variances and leverage are shown in Figure 3. As shown in Figure 3A, sample 1, 2, 3, 36 and 37 were far away from other samples, and had high leverage values that shown in Figure 3B. Because sample 1, 2, 3, 36 and 37 had lower reference values and had normal residual X- and Y-variances, they were not outliers are showing in Figure 3C. For sample 39 shown in Figure 3B and Figure 3D, it has very high residual Y variances, so it is an outlier, and is deleted from the calibration set.
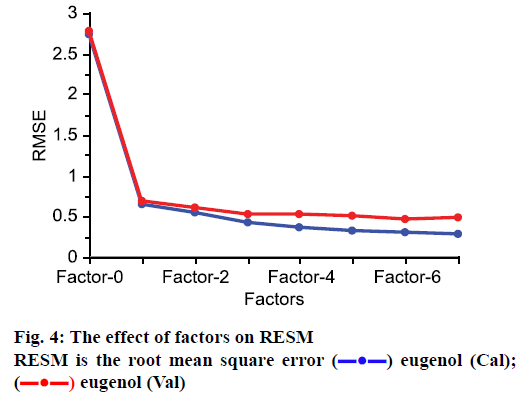
The number of factor has great effect on the performance in PLS modelling. More factors may lead to the over-fitting of the model and lesser LVs could decrease the accuracy of model [24]. So, suitable factors can guarantee the reliability of the model. In this work, the method of random was used for cross-validation to determine factor number. As shown in Figure 4, with the increasing of factors, the RMSE decreased. When 6 factors are included in model, the RMSE is the lowest, therefore, the PLS model was built with 6 factors.
Under this condition, the performance of PLS model was excellent. As shown in Table 3, for the calibration set, the slope was 0.9879 and is close to 1; the offset was 0.1326 and is close to 0; R-squared was 0.9879 which is close to 1; RMSE was 0.3001 which is low; bias was 0. For cross-validation, the results were comparable to the calibration set. For prediction set, the slope was 0.9461; the offset was 0.3008 and is close to 0; R-squared was 0.9388, which is close to 1; RMSE was 0.6987; bias was –0.2815. Although the results weren’t as good as that of calibration set, they were also better. The RPD was 5.89, normally, when RPD is more than 3, model has a good ability in application [25]. Based on these statistic parameters, the developed model has a good performance.
| Data set | Slope | Offset | Correlation | R-Square | RMSE | Bias |
|---|---|---|---|---|---|---|
| Cal | 0.9879 | 0.1326 | 0.9939 | 0.9879 | 0.3001 | 0.0000 |
| CV | 0.9688 | 0.3483 | 0.9853 | 0.9710 | 0.4667 | 0.0054 |
| Pre | 0.9461 | 0.3008 | 0.9689 | 0.9388 | 0.6987 | -0.2815 |
Table 3: Calibration statistics analysis for the performance of model
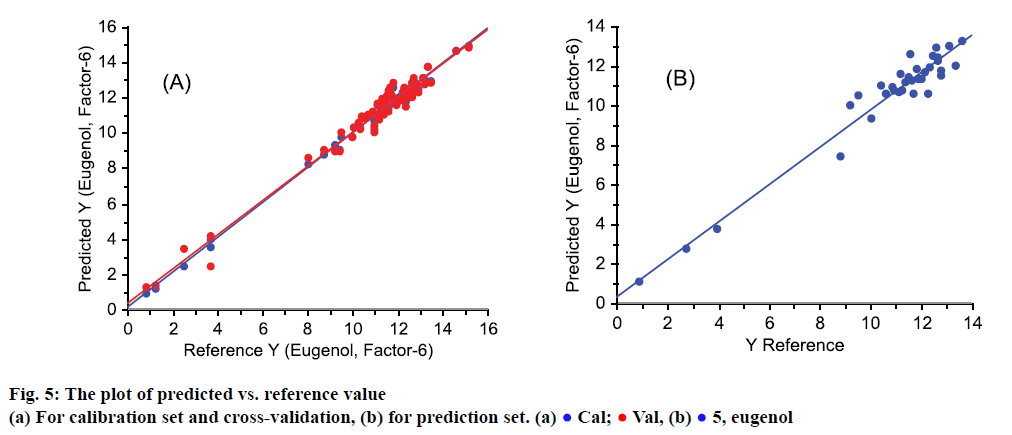
As shown in Figure 5, the predicted Y-value from the model was plotted against the reference Y-value. Figure 5A depicted samples in calibration set (blue points) and cross-validation set (red points). Vast majority of red and blue points nearly overlapped, as well as the regression lines, which indicated that the model was stable. The predicted and reference value in prediction set was shown in Figure 5B, in which sample points were all close to regression line, which also mean that the predicted values were accurate.
As far as model was concerned, the slope is close to 1, offset is close to 0, RMSE is very small and R-squared is close to 1, so, in this work, the model gave a good fit, and the predicted eugenol from model should give a good result.
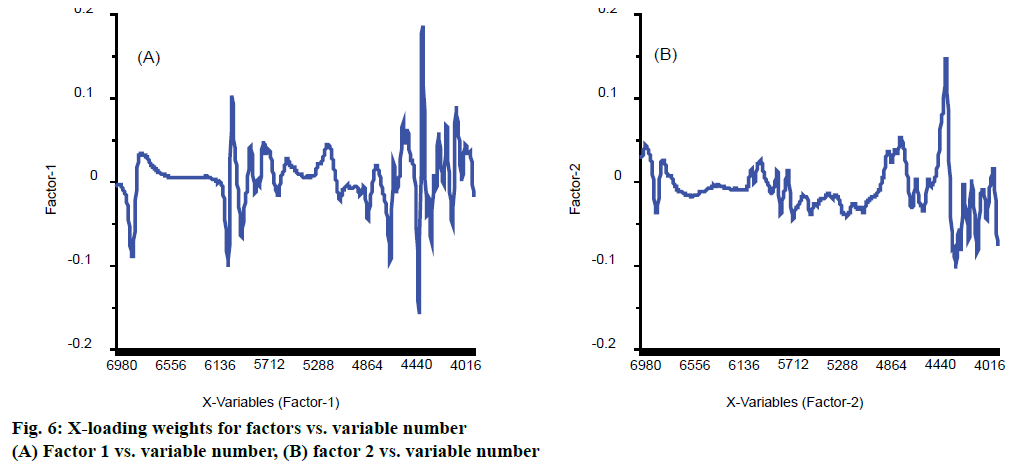
The figure of X-loading weights was a plot of X-loading weights for factors vs. variable number. It is useful for detecting important variables. If a variable has a large positive or negative loading weight, this means that the variable is important for the factor concerned. They are also used to improve the accuracy of model. Wang et al. had used loading weights to select effective wavelength and got lower RMSE, 0.223, dropped from 0.237 and higher, 0.948, up from 0.942 in rapid determination of Lycium barbarum polysaccharide [26]. The other researchers also used loading weights to select wavelength and got higher R-squared and lower RMSE [27]. In this work, the first two factors, PLS components that were similar to principal components, played a major role in model based on Figure 4, and their X-loading weights were shown in Figure 6. For the factor 1, wavenumber 4460, 4492, 6096 and 6132 cm-1 were the first four important variables shown in Figure 6A. For the factor 2, the most important variable was wavenumber 4464 cm-1 shown in Figure 6B. These variables may have effective information related to eugenol.
The main active content of eugenol in caryophylli flos could be accurately detected using NIRS, and the performance of PLS models with 6 factor was the best for prediction. In future practice, it is expected to improve the quality of caryophylli flos in its production and market circulation.
Acknowledgements
This work was supported by Chinese medicine industry the Special Project of Ministry of Science and Technology rapid detection method of Chinese herbal medicine quality (grant number: 201407003) and Jiangsu Province Natural Science Foundation (grant number: BK20131239).
Conflict of interest
There is no conflict of interest associated with this project.
References
- Liu SJ, Lin ZT, Wang H, Chen SZ. Quantification of eugenol and bancroftione in Caryophylli Fructus using High-performance liquid chromatography. J Chin Pharm Sci 2010:19:459-63
- Analysis of global clove production and production area distribution in 2014 [Figure], February 22, 2016. Available from: http://www.chyxx.com/industry/201602/387680.html.
- Emir Çoban Ö, Patir B. Antimicrobial and antioxidant effects of clove oil on sliced smoked Oncorhynchus mykiss. J Verbrauch Lebensm 2013;8(3):195-9.
- Fu Y, Chen L, Zu Y, Liu Z, Liu X, Liu Y, et al. The antibacterial activity of clove essential oil against Propionibacterium acnes and its mechanism of action. Arch Dermatol 2009,145(1):86-8.
- Islam SN, Ferdous AJ, Ahsan M, Faroque AB. Antibacterial activity of clove extracts against phagogenic strains including clinically resistant isolates of Shigella and Vibrio cholerae. Pak J Pharm Sci 1990;3(1):1-5.
- Siddiqua S, Anusha BA, Ashwini LS, Negi PS. Antibacterial activity of cinnamaldehyde and clove oil: effect on selected foodborne pathogens in model food systems and watermelon juice. J Food Sci Technol 2015;52(9):5834-41.
- Yamahara J, Kobayashi M, Saiki Y, Sawada T, Fujimura H. Biologically active principles of crude drugs. Pharmacological evaluation of cholagogue substances in clove and its properties. J Pharmacobiodyn 1983;6(5):281-6.
- Nikousaleh A, Prakash J. Antioxidant components and properties of dry heat treated clove in different extraction solvents. J Food Sci Technol 2016;53(4):1993-2000.
- Zhang P, Zhang E, Xiao M, Chen C, Xu W. Enhanced chemical and biological activities of a newly biosynthesized eugenol glycoconjugate, eugenol alpha-D-glucopyranoside. Appl Microbiol Biotechnol 2013;97(3):1043-50.
- Ali SM, Khan AA, Ahmed I, Musaddiq M, Ahmed KS, Polasa H, et al. Antimicrobial activities of Eugenol and Cinnamaldehyde against the human gastric pathogen Helicobacter pylori. Ann Clin Microbiol Antimicrob 2005;4:20-6.
- Park CK, Kim K, Jung SJ, Kim MJ, Ahn DK, Hong SD, et al. Molecular mechanism for local anesthetic action of eugenol in the rat trigeminal system. Pain 2009;144(1-2):84-94.
- Sasagawa T, Ehara M, Maizumi H. Local anesthetic effect of phenol derivatives. 2. Eugenol and guaiacol. Shigaku 1985;73(1):52-66.
- Park SH, Sim YB, Lee JK, Kim SM, Kang YJ, Jung JS, et al. The analgesic effects and mechanisms of orally administered eugenol. Arch Pharm Res 2011;34(3):501-7.
- Esmaeili F, Rajabnejhad S, Partoazar AR, Mehr SE, Faridi-Majidi R, Sahebgharani M, et al. Anti-inflammatory effects of eugenol nanoemulsion as a topical delivery system. Pharm Dev Technol 2016;21(7):887-93.
- Mnafgui K, Hajji R, Derbali F, Gammoudi A, Khabbabi G, Ellefi H, et al. Anti-inflammatory, Antithrombotic and Cardiac Remodeling Preventive Effects of Eugenol in Isoproterenol-Induced Myocardial Infarction in Wistar Rat. Cardiovasc Toxicol 2016;16(4):336-44.
- The Pharmacopoeia Committee of People's Republic of China. Chinese Pharmacopoeia. Beijing, China: China Medical Science Press; 2010. p. 4.
- Yan H, Han BX, Wu QY, Jiang MZ, Gui ZZ. Rapid detection of Rosa laevigata polysaccharide content by near-infrared spectroscopy. Spectrochim Acta A Mol Biomol Spectrosc 2011;79(1):179-84.
- Tsujikawa K, Yamamuro T, Kuwayama K, Kanamori T, Iwata YT, Miyamoto K, et al. Application of a portable near infrared spectrometer for presumptive identification of psychoactive drugs. Forensic Sci Int 2014;242:162-71.
- Chen Q, Zhao J, Zhang H, Wang X. Feasibility study on qualitative and quantitative analysis in tea by near infrared spectroscopy with multivariate calibration. Anal Chim Acta 2006;572(1):77-84.
- Chen Q, Ding J, Cai J, Zhao J. Rapid measurement of total acid content (TAC) in vinegar using near infrared spectroscopy based on efficient variables selection algorithm and nonlinear regression tools. Food Chem 2012;135(2):590-5.
- Yan H, Lu DL, Chen B, Hansen W. Development of a hand-held near infrared system based on an Android OS and MicroNIR, and its application in measuring soluble solids content in Fuji apples. NIR News 2014;25(4):16-9.
- Fan S, Zhang B, Li J, Huang W, Wang C. Effect of spectrum measurement position variation on the robustness of NIR spectroscopy models for soluble solids content of apple. Biosyst Eng 2016;143:9-19.
- Hasegawa K, Funatsu K. Advanced PLS Techniques in Chemoinformatics Studies. Curr Comput Aided Drug Des 2010;6(2):103-27.
- Madalozzo ES, Sauer E, Nagata N. Determination of fat, protein and moisture in ricotta cheese by near infrared spectroscopy and multivariate calibration. J Food Sci Technol 2015;52(3):1649-55.
- Lu HY, Wang SS, Cai R, Meng Y, Xie X, Zhao WJ. Rapid discrimination and quantification of alkaloids in Corydalis Tuber by near-infrared spectroscopy. J Pharm Biomed Anal 2012;59:44-9.
- Wang Y, Gao Y, Yu X, Wang Y, Deng S, Gao JM. Rapid Determination of Lycium barbarum Polysaccharide with Effective Wavelength Selection Using Near-Infrared Diffuse Reflectance Spectroscopy. Food Anal Methods 2016;9(1):131-8.
- Shao Y, He Y, Wu C. Dose detection of radiated rice by infrared spectroscopy and chemometrics. J Agric Food Chem 2008;56(11):3960-5.
 ) eugenol (Cal); (
 ) eugenol (Val)
 Cal;
Cal;  Val, (b)