- *Corresponding Author:
- Kalpana G. Patel
Department of Quality Assurance, Anand Pharmacy College, Opp. Town Hall, Anand-388 001, India
E-mail: kalpana_jpatel@yahoo.com
| Date of Submission | 31 May 2013 |
| Date of Revision | 01 March 2014 |
| Date of Acceptance | 10 March 2014 |
| Indian J Pharm Sci 2014; 76(3):179-187 |
Abstract
High performance thin layer chromatographic method for simultaneous estimation of olmesartan medoxomil, amlodipine besylate and hydrochlorothiazide was developed and validated as per ICH guidelines. Moreover, robustness testing was performed applying a central composite design with k factor having 2 k factorial runs, 2k axial experiments and two center points. High performance thin layer chromatographic separation was performed on aluminium plates precoated with silica gel 60F 254 and toluene:chloroform:methanol:acetonitrile:formic acid (2:7:1.8:0.8:0.2% v/v) as optimized mobile phase. The detection wavelength for simultaneous estimation of three drugs was 232nm. The R f values for olmesartan medoxomil, amlodipine besylate and hydrochlorthiazide were 0.78, 0.20 and 0.45, respectively. Percent recoveries in terms of accuracy for the marketed formulation was found to be 101.3-104.4, 100.7-104 and 101.5-103.9 for, olmesartan medoxomil, amlodipine besylate and hydrochlorthiazide, respectively. The pooled %relative standard deviation values for repeatability studies and intermediate precision studies was found to be less than 2% for olmesartan medoxomil, amlodipine besylate and hydrochlorthiazide, respectively. All the three factors evaluated in the robustness testing by central composite design were found to have an insignificant effect on the retention factor. However, methanol content in total mobile phase as a factor appeared to have significant effect on robustness, compared to band size and developing distance and hence it is important to be carefully controlled. In summary, a novel, simple, accurate and reproducible high performance thin layer chromatographic method was developed, which would be of use in quality control of these tablets.
Keywords
Olmesartan medoxomil, amlodipine besylate, hydrochlorthiazide, high performance thin layer chromatography, validation, central composite design
Cardiovascular diseases are the disorders of heart and blood vessels and primarily include coronary heart disease, hypertension, cerebrovascular disease, peripheral artery disease, rheumatic heart disease, congenital heart disease and heart failure. Cardiovascular diseases are the major cause of death in developed countries, projecting almost 1.5 billion people by 2025 [1]. The major risk factors underlying cardiovascular diseases are low density lipoprotein (LDL) cholesterol, hypertension, platelet aggregation, diabetes, smoking and obesity, which are primarily caused by unhealthy diet and physical inactivity [2]. Among these, hypertension, a major risk factor affects more than 1 billion adults worldwide. The prevalence of hypertension increases with advancing age and the risk of both fatal and nonfatal cardiovascular disease in adults are lowest with systolic blood pressures of less than 120 mm Hg and diastolic blood pressure less than 80 mm Hg. However, these risks increase progressively with higher systolic and diastolic blood pressures. Calcium channel blockers, angiotensin converting enzyme inhibitors, angiotensin receptor blockers and diuretics are commonly used for management of hypertension [3,4]. The effective therapy for moderate to severe hypertension requires multiple antihypertensive agents from different classes of drugs. Many dual and triple combinations are available for management of hypertension and cardiovascular diseases. One of the triple combination amongst various available and widely used is olmesartan medoxomil, amlodipine besylate and hydrochlorthiazide.
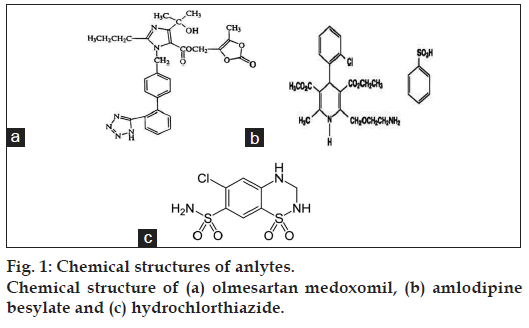
Olmesartan (OLM) chemically (5-methyl-2-oxo- 2H-1,3-dioxol-4-yl)methyl-4-(2-hydroxypropan- 2-yl)-2-propyl-1-({4-[2-(2H-1,2,3,4-tetrazol-5-yl) phenyl)phenyl}methyl-1H-imidazole-5-carboxylate as shown in fig. 1a. OLM is an angiotensin II receptor (type AT1) antagonist used in the management of hypertension, and prevents the constriction of blood vessels (veins and arteries) [3,5]. OLM has not yet been officially described in any pharmacopoeia. Amlodipine besylate (AML), a betablocker, chemically 4-[2-hydroxy-3-[(1-methylethyl) amino]propoxy]benzeneacetamide as shown in fig. 1b, is used to lower blood pressure, heart rate, chest pain and risk of recurrent heart attacks [3,4,6]. Hydrochlorothiazide (HCTZ), a thiazide diuretic, is chemically known as 6-chloro-3,4-dihydro-2H-1,2, 4-benzothiadiazine-7-sulfonamide-1,1-dioxide (fig. 1c). It is used to lower blood pressure and decreases the amount of fluid in the body by increasing the amount of salt and water lost in the urine [3,4,6].
Literature reviewed reports several analytical methods including HPLC [2,7-9], a stability- indicating HPLC [10-14], HPTLC [15,16] and UV-spectrophotometry [17-19] for the determination of OLM, AML and HCTZ either single or in combination with other drugs. Many analytical methods have been reported individually for AML [20,21] and HCTZ [20-22]. However, development of a high performance thin layer chromatographic (HPTLC) method for simultaneous estimation of OLM, AML and HCTZ in combined dosage form has not been reported.
Recently, HPTLC is widely employed for the quantification of drugs because of low maintenance cost, lower analysis time, low mobile phase consumption per sample and need for minimum sample clean-up. It facilitates automated application of sample and scanning of plate. Moreover, it is flexible enough to analyze different kinds of samples [23]. Hence, this research paper describes the development of HPTLC method for simultaneous estimation of OLM, AML and HCTZ using Design of Experiment (DoE) approach for method validation.
DoE is based on the principle of use of experimental design, generation of mathematical equations (models) and graphical outcomes, employing various rational combination of factors. Experimental design procedures are very useful in pharmaceutical development including formulation development and analytical method optimization and validation, and are more effective than the traditional onevariable- at-a-time approach [24-27]. Experimental design methodology has proved to be a useful tool for method validation, as it allows the investigation of simultaneously changing factors. During method validation, ruggedness (different normal conditions) or robustness (small changes introduced deliberately) studies are typically performed with the expected outcome that there is no significant change of the response, allowing the claim of a rugged/robust method [28]. Moreover, many factors can be screened simultaneously without concerns about interacting and non-interacting effects, as they are usually considered negligible. On evaluation of obtained results, when a factor is not robust, the proposed method can be changed, revalidated or the factor can be controlled [29]. Various experimental designs for robustness study includes Plackett Burman design, factorial, fractional factorial and response surface designs.
This research article focuses on the determination of robustness of HPTLC analytical method by central composite design (CCD). Among the various experimental designs, CCD as a response surface design was preferred for prediction of nonlinear response and also due to its flexibility, in terms of experimental runs and information related to factor’s main and interaction effects [30,31]. Moreover, preliminary trials of optimization study revealed that the methanol content in the mobile phase produced significant effect on the response. Hence, CCD that combines two level factorial design with a star design and centre points covers the factor space near the centre with more points than at the periphery and allows more number of levels without performing experiments at every combination of factor levels. For this CCD, three influent chromatographic parameters; mobile phase composition in terms of methanol content, developing distance and band size on the basis of optimized experimental domain were selected and varied within a real range, and their quantitative influence on the response variable, retention factor was determined. Hence a novel, simple, accurate, reproducible HPTLC method was developed for simultaneous estimation of OLM, AML and HCTZ in pharmaceutical dosage form, using CCD design for robustness testing.
Materials and Methods
Working standards of OLM, AML and HCTZ were kindly provided as a gratis sample from Glenmark Generics Limited, Pune, Prudence Pharma Chem, Ankleshwar and Ipca Laboratories Limited, Ratlam, respectively. All solvents and chemicals used were of analytical grade, purchased from Merck Specialities Pvt. Ltd., India. Marketed tablet formulations used in this study were procured from local market; Triolmezest film-coated tablet and Triolmezest 40 tablet, from Sun Pharmaceutical Industries Ltd. and Olmetime-AMH from Mankind Pharma Ltd.
Microsyringe (Linomat syringe 659.0014, Hamilton- Bonaduz Schweiz, Camag, Switzerland), pre-coated silica gel 60F254 aluminium plates (10×10 cm, 100μm thickness; Merck, Darmstadt, Germany), Linomat 5 applicator (Camag, Switzerland), twin trough chamber (10×10 cm; Camag, Switzerland), UV chamber (Camag, Switzerland), TLC scanner IV (Camag, Switzerland), win CATS version 1.4.6 software (Camag, Switzerland) were used in the study. All data analysis of experimental design was performed by using the Design-Expert trial version 7.0.0 (Stat-Ease Inc., Minneapolis) and remaining calculations were performed by use of Microsoft Excel 2007 software (Microsoft Corporation, USA).
Preparation of standard solutions
A stock solution of OLM, AML and HCTZ were prepared separately by weighing accurately 10 mg of each drug followed by dilution in methanol in 10 ml volumetric flask and volume was made up to the mark with methanol, to obtain a concentration of 1000 μg/ml. From this stock solution, appropriate aliquots was transferred and diluted up to the mark with methanol in 10 ml volumetric flask to prepare a final concentration of 100 μg/ml for OLM, AML and HCTZ.
Chromatographic development and scanning
Suitable volumes of standard and sample solutions were applied to the HPTLC plates, 8 mm from the bottom and 15 mm from the side edges in the form of bands with band length of 6 mmon precoated silica gel aluminium plate 60F254, (10×10 cm) 100 μm thickness; using a Camag Linomat V sample applicator. The mobile phase consisted of toluene: chloroform: methanol: acetonitrile: formic acid (2:7:1.8:0.8:0.2, v/v) and the length of chromatographic run was 8 cm. Mobile phase components were mixed prior to use and the development chamber was left to saturate with mobile phase vapour for 20 min before each run with the filter paper. Development of the plate was carried out by the ascending technique to a migration distance of 80 mm. Subsequent to the development; TLC plates were dried in a current of air with the help of an air dryer. Densitometric scanning was performed using Camag TLC scanner IV with win CATS software (V 1.4.6.2002, Camag). All measurements were made in the reflectance absorbance mode at 232 nm, slit dimension (6.0×0.30 mm, micro), scanning speed 20 mm/s, data resolution 100 μm/step, optical filter (second order), filter factor (Savitsky golay 7). The source of radiation was deuterium lamp emitting a continuous UV spectrum between 190 and 400 nm. Concentration of the drug was determined from the intensities of diffusely reflected lights. Evaluation was via peak areas with linear regression analysis. The method was validated in accordance with ICH guidelines Q2 (R1) for evaluation of various parameters that include linearity, precision, accuracy, LOD, LOQ, specificity and robustness [32].
Linearity
Linear relationship between peak area and concentration of all three drugs were evaluated by making five replicate measurements for all the concentrations, 800, 1000, 1200, 1400, 1600 and 1800 ng/band for OLM, and for AML and HCTZ at the concentrations of 1000, 1500, 2000, 2500, 3000 and 3500 ng/band for AML and HCTZ, respectively. Calibration plots were constructed by plotting the area of the main band versus the concentration of the drug and treated using the method of ordinary regression analysis. Homoscedasticity of variance was also evaluated for the response of peak area by Bartlett’s test. Moreover, Lack of Fit (LOF) was also applied for checking deviation from linearity.
Precision
Precision of the developed method was evaluated by performing repeatability on same day and intermediate precision studies on different days in three replicates. Repeatability and intermediate precision was carried out for three different concentration (800, 1200 and 1600 ng for OLM, 1000, 2000 and 3000 ng for AML and 1000, 2000 and 3000 ng for HCTZ) and peak area measured was expressed in terms of percent relative standard deviation (%RSD).
Accuracy
Accuracy of method was ascertained by spiking with standard at three concentration levels(50, 100 and 150%) in triplicate. Recovery studies for OLM were carried out by spiking three different amounts of OLM standard (300, 600 and 900 ng) to the marketed tablet dosage form (600 ng/band). Similarly, recovery studies for AML were carried out by spiking three different amounts of AML standard (500, 1000 and 1500 ng) to the dosage form (1000 ng/band). Recovery studies for HCTZ were carried out by spiking three different amounts of HCTZ standard (500, 1000 and 1500 ng) to the dosage form (1000 ng/band).
Limit of detection and Limit of quantitation
As per ICH guideline, limit of detection (LOD) and limit of quantitation (LOQ) of the developed method were calculated from the standard deviation of the response and slope of the calibration curve of each drug using the formulae, limit of detection=3.3×σ/S and limit of quantitation=10×σ/S, where, σis standard deviation of response and S is the slope of calibration curve
Specificity
The specificity of the method was ascertained by comparing the Rf value and spectra of standard drug and sample. The peak purity of each drug was assessed by comparing the spectra at three different levels, i.e., peak start (S), peak apex (M) and peak end (E) position.
Robustness
The CCD approach combines a fractional factorial with incomplete block design methodology to avoid extreme vertices and to present an approximately rotatable design with three levels per factor. Central composite design, as a three level factorial design with k factors, requires 2k factorial runs, 2k axial runs symmetrically spaced at along each variable axis and at least one centre point [27].The factors and ranges selected for consideration were based on previous univariate studies of method development and chromatographic intuition. The composition of the mobile phase is the volume of methanol with respect to total volume of mobile phase. Twelve experiments with two centre points were conducted by selection of three factors, developing distance (A), methanol content in mobile phase (B), band size (C) and retention factor was the response for three drugs using the level, described in Table 1. The nominal value for all these three factors, A, B and C, were 8 cm, 1.8 ml and 6 mm, respectively. In context to this, developing distance (A) was kept between 6.59 and 9.41 cm. Similarly, minimum and maximum content of methanol (B) were fixed as 1.7 and 1.9 ml, respectively. Likewise, minimum and maximum values for band size (C) were selected as 4.59 and 7.41 mm, respectively. The coded value of α is 1.41. The data generated were analyzed using Design Expert (Version 7.0.1, Stat-Ease Inc., Minneapolis, MN, USA) statistical software. The significance of the relevant factors was calculated using Fisher’s statistical test for Analysis of Variance (ANOVA) model that were estimated. ANOVA for linear regression partitions the total variation of a sample into components. These components were then used to compute an F- ratio that evaluates the effectiveness of the model. If the probability associated with the F-ratio is low, the model is considered a better statistical fit for the data. All experiments were performed in randomized order to minimize the bias effects of uncontrolled factors.
| Run | Type | Factors | Response Rf value | |||||
|---|---|---|---|---|---|---|---|---|
| Developing distance (cm) | Methanol content in mobile phase (ml/%) | Band size (mm) | ||||||
| OLM | AML | HCTZ | ||||||
| 1 | Fact | -1.00 | 1.00 | 1.00 | 0.77 | 0.23 | 0.50 | |
| 2 | Fact | 1.00 | -1.00 | 1.00 | 0.73 | 0.21 | 0.49 | |
| 3 | Fact | -1.00 | -1.00 | -1.00 | 0.72 | 0.20 | 0.48 | |
| 4 | Center | 0.00 | 0.00 | 0.00 | 0.75 | 0.22 | 0.50 | |
| 5 | Axial | 0.00 | 0.00 | 1.41 | 0.76 | 0.23 | 0.50 | |
| 6 | Axial | 0.00 | -1.41 | 0.00 | 0.70 | 0.18 | 0.47 | |
| 7 | Centre | 0.00 | 0.00 | 0.00 | 0.75 | 0.22 | 0.50 | |
| 8 | Axial | -1.41 | 0.00 | 0.00 | 0.75 | 0.19 | 0.47 | |
| 9 | Axial | 0.00 | 0.00 | -1.41 | 0.75 | 0.23 | 0.48 | |
| 10 | Fact | 1.00 | 1.00 | -1.00 | 0.77 | 0.25 | 0.53 | |
| 11 | Axial | 0.00 | 1.41 | 0.00 | 0.80 | 0.27 | 0.54 | |
| 12 | Axial | 1.41 | 0.00 | 0.00 | 0.76 | 0.24 | 0.52 | |
Table 1: Ccd model for robustness study with obtained responses
Analysis of tablet formulation
The method was used for simultaneous estimation of OLM, AML and HCTZ in tablet dosage forms. Twenty tablets were ground to a fine powder form and powder equivalent to 20 mg of OLM, 12.5 mg of HCTZ and 5 mg of AML was accurately weighed and transferred into 50 ml of volumetric flask. About 15 ml of methanol was added and the mixture was sonicated for 15 min. The mixture was diluted to volume with methanol, mixed well and filtered through What man filter paper no. 42 to obtain the sample stock solution. For the determination, 5 ml of stock solution was diluted to 10 ml with methanol to obtain a final concentration of 20 μg/ml of OLM, 5 μg/ml of AML and 12.5 μg/ml of HCTZ. 10 μl of filtered solution was applied on HPTLC plate followed by development and scanning and repeating analysis in triplicate.
Results and Discussion
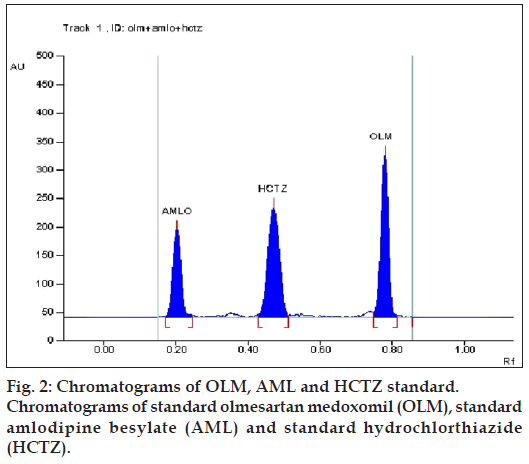
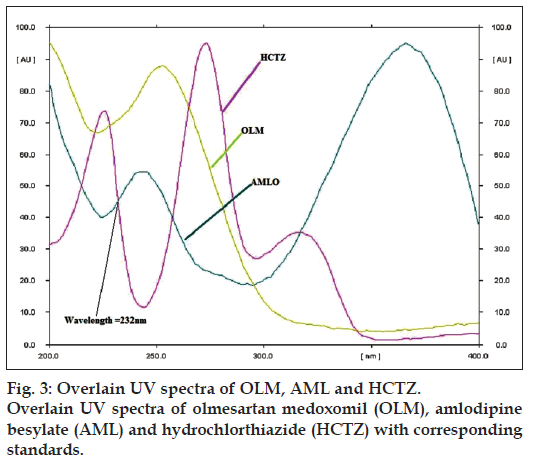
Various combinations of solvents in different ratios like methanol, ethyl acetate, chloroform, toluene, hexane, acetonitrile, glacial acetic acid and formic acid were tried for resolving the peaks of OLM, AML and HCTZ. Various combinations of chloroform and methanol were tried in different ratios as good resolution between all three drugs was observed. Chloroform: methanol (8:2) gave good resolution but typical peak shape of OLM was missing. Formic acid was added to improve peak characteristics, but addition of formic acid resulted in increase in Rf value of OLM. Hence, further addition of toluene lowered the Rf value of OLM, but resolution between AML and HCTZ decreased. Addition of acetonitrile resulted in separation of AML and HCTZ peak, with the final optimized mobile phase, toluene: chloroform: methanol: acetonitrile: formic acid (2:7:1.8:0.8:0.2) which gave highest resolution and Rf values of 0.78±0.013, 0.20±0.009 and 0.45±0.009 for OLM, AML and HCTZ, respectively (fig. 2) at detection wavelength of 232 nm (fig. 3).
The OLM, AML and HCTZ showed a good correlation coefficient (r2=0.9953 for OLM, r2=0.9958 for AML and 0.9955 for HCTZ) in the given concentration range 800-1800 ng/ band for OLM, 1000-3500ng/band for AML and 1000-3500 ng/band for HCTZ respectively (Table 2). Homoscedasticity of variance was confirmed by Bartlett’s test and the response of peak area for all three drugs showed homogenous variance that was exemplified by the χ2 value less than the tabulated value (Table 2). Moreover, linearity was also confirmed by Lack of Fit (LOF), where the deviation of the value of response when computed in terms of F ratio for all three drugs was less than the tabulated one (Table 3) [33]. The LOD and LOQ were found to be 33.13 and 100.40 ng/band, respectively for OLM, 303.04 and 918.30 ng/band, respectively for AML and 325.17 and 985.39 ng/band, respectively for HCTZ.
| Parameters | OLM | AML | HCTZ |
|---|---|---|---|
| Linearitya | |||
| Calibration | 800-1800 | 1000-3500 | 1000-3500 |
| range | |||
| (ng/band) | |||
| Correlation | 0.9953 | 0.9958 | 0.9955 |
| coefficient | |||
| (r2) | |||
| Slope ± SD | 2.9622 ± 0.0126 | 1.5666 ± 0.0623 | 2.1624 ± 0.2354 |
| CI of slope | 2.9778-2.9465 | 1.6442-1.4890 | 2.4549-1.8698 |
| Intercept ± SD | 1602.35 ± 29.88 | 2396.006 ± 149.45 | 3798.19 ± 340.17 |
| CI of | 1639.54-1565.16 | 2582.05-2209.97 | 4221.65-3374.74 |
| intercept | |||
| Bartlett’s | 0.000688 | 0.030823 | 0.277377 |
| testb (χ2) | |||
| Sensitivity | |||
| (ng/band) | |||
| LOD | 33.13 | 303.04 | 325.17 |
| LOQ | 100.40 | 918.30 | 985.39 |
| Precisionc | |||
| (%RSD) | |||
| Repeatability | 0.651-1.377 | 0.736-0.801 | 0.367-1.125 |
| Intermediate | 0.566-1.150 | 0.671-1.397 | 0.314-0.929 |
| precision | |||
| Accuracyc (%) | |||
| Recovery | 101.30-104.41 | 100.69-104.02 | 101.45-103.90 |
| studies |
Table 2: Analytical parameters of proposed hptlc method for simultaneous estimation of olm, aml and hctz
| Drugs | Source of variation | Sum of squares | Degree of freedom | Mean sum of squares | F-ratio |
|---|---|---|---|---|---|
| OLM | Total | 3.108 × 10⁷ | 29 | 1.072 × 10⁶ | 3.66 |
| Regression | 3.046 × 10⁷ | 1 | 3.046 × 10⁷ | ||
| Residual | 6.184 × 10⁵ | 28 | 2.208 × 10⁴ | ||
| Within groups | 3.840 × 10⁵ | 24 | 1.600 × 10⁴ | ||
| Lack of fit | 2.344 × 10⁵ | 4 | 5.861 × 10⁴ | ||
| AML | Total | 5.839 × 10⁷ | 29 | 2.014 × 10⁶ | 3.53 |
| Regression | 5.774 × 10⁷ | 1 | 5.774 × 10⁷ | ||
| Residual | 6.547 × 10⁵ | 28 | 2.338 × 10⁴ | ||
| Within groups | 4.121 × 10⁵ | 24 | 1.717 × 10⁴ | ||
| Lack of fit | 2.426 × 10⁵ | 4 | 6.065 × 10⁴ | ||
| HCTZ | Total | 1.264 × 10⁸ | 29 | 4.358 × 10⁶ | 1.06 |
| Regression | 1.242 × 10⁸ | 1 | 1.242 × 10⁸ | ||
| Residual | 2.173 × 10⁶ | 28 | 7.762 × 10⁴ | ||
| Within groups | 1.848 × 10⁶ | 24 | 7.700 × 10⁴ | ||
| Lack of fit | 3.253 × 10⁵ | 4 | 8.132 × 10⁴ |
Table 3: Anova with lack of fit calculation
Precision of developed method was evaluated by repeatability and intermediate precision, and was expressed as %RSD of peak area. Repeatability and intermediate precision was carried out by performing three replicates of three different concentration (800, 1200 and 1600ng for OLM, 1000, 2000 and 3000 ng for AML and 1000, 2000 and 3000 ng for HCTZ) showed %RSD less than 2% (Table 2), indicating acceptable precision in terms of repeatability of peak area measurement and sample application. Accuracy study was performed by “Standard addition” at three concentration level 50, 100 and 150%, by spiking with standard. The percentage recovery at all three levels was found in the range of 100.69% to 104.41%, suggesting suitability of method to perform routine drug analysis (Table 2).
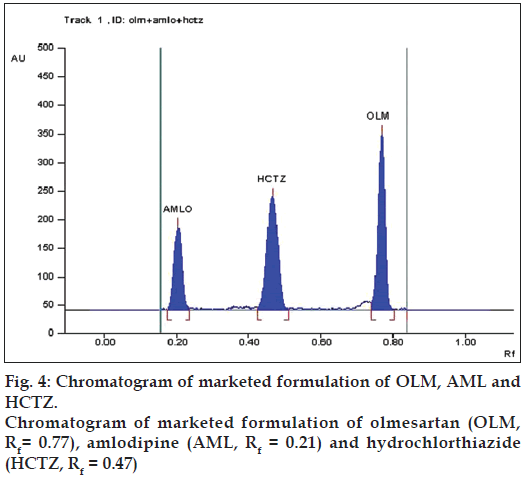
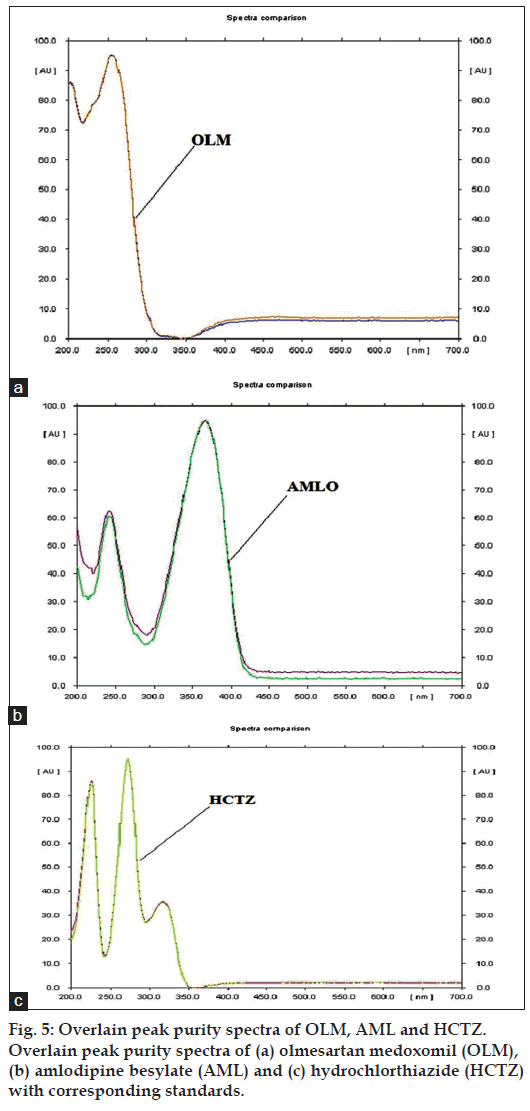
The marketed formulation using the developed method, showed three peaks at Rf value of 0.77 for OLM, Rf value of 0.21 for AML and Rf value of 0.47 for HCTZ that was found to be at the same Rf values for all three standards as shown in fig. 4. The peak purity of OLM, AML and HCTZ in marketed formulations when evaluated by comparing the spectra at peak start, peak apex and peak end positions of the band showed good correlation i.e. r(S,M) and r(M,E) for OLM 0.9998 and 0.9986, for AML 0.9999 and 0.9993 and for HCTZ 0.9999 and 0.9998, indicating specificity in the presence of various excipients (fig. 5).
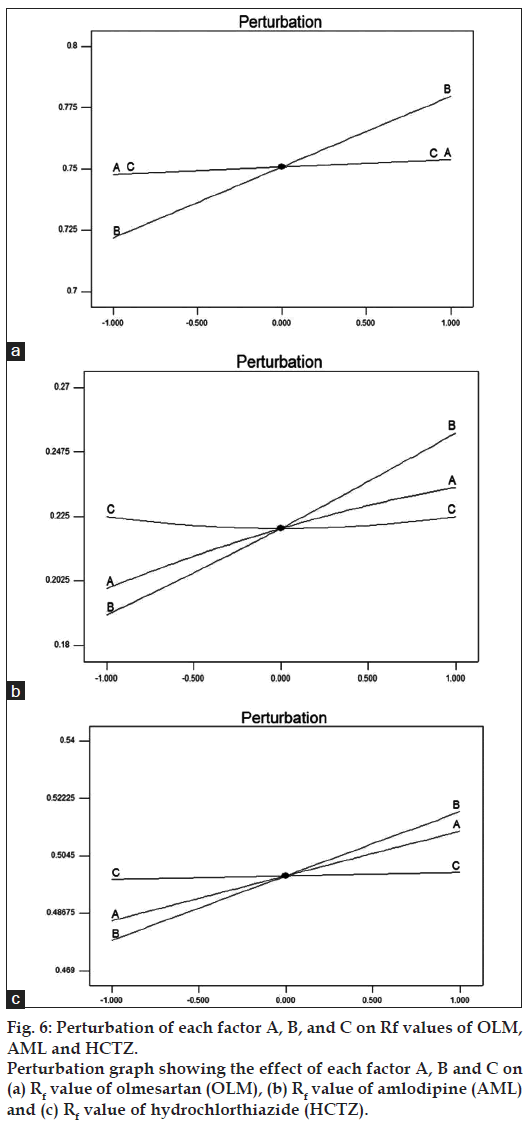
All experiments in robustness testing were performed in a randomized fashion in order to minimize the effects of uncontrolled factors that may introduce bias to the response. Response surfaces and perturbation plots were constructed to evaluate the effect of the factors on the retention factor of each drug. Perturbation plots reveal the change in response from its nominal value for all three drugs with all other factors held constant at a reference point, and steepest slope or curvature indicates sensitiveness to specific factor. Fig. 6 shows that the methanol content in the mobile phase had most important effect on retention factor, as increasing levels of methanol content resulted in an increase in the retention factor. However, the variation in retention factor due to change in methanol content of mobile phase was acceptable as is evident from the plot indicating a robust method. The rest of the examined factors, band size and developing distance had no significant effect on retention factor.
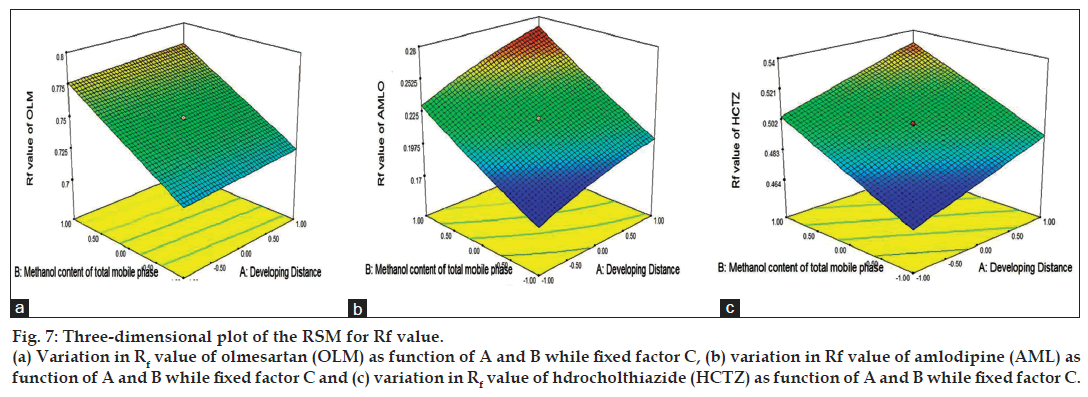
The 3D response surface plots based on the equation were generated as a function of the significant variables while the third variable was held constant at a specified level, usually the proposed optimum (fig. 7). Fig. 7 shows graphical representation of the variation of response, retention factor as a function of developing distance and methanol content of mobile phase, while band size is held constant, and the retention factor for AML, HCTZ and OLM increases as the methanol content in the total mobile phase increases. As can be seen from the 3D response surface plots, an increase in developing distance produced an increase in response for AML and HCTZ but did not affect the retention factor of OLM (fig. 7). Taking into account the response in the form of retention factor, every parameter was robust, with the exception of methanol content in mobile phase, where optimal condition was 1.8 ml in total mobile phase content. Therefore, the control of this parameter was important because from the results it was concluded that the only significant factor affecting robustness study was methanol content of mobile phase. The model was also validated by analysis of variance (ANOVA) using Design Expert software and the results are as presented in Table 4. Significant effects had p value less than 0.05. Adequate Precision defined as a signal-to-noise ratio greater than 4 is desirable, and the obtained ratio for all the three drugs indicated an adequate signal (Table 4). The low standard deviation (%CV) and high adjusted R-square values indicated a good relationship between the experimental data and those of the fitted models. The predicted R-square value was in acceptable concordance with the adjusted R-square value for all three drugs. The final equation, in terms of actual components and factors, is as shown in the Table 4.
Figure 7: Three-dimensional plot of the RSM for Rf value.
(a) Variation in Rf value of olmesartan (OLM) as function of A and B while fixed factor C, (b) variation in Rf value of amlodipine (AML) as function of A and B while fixed factor C and (c) variation in Rf value of hdrocholthiazide (HCTZ) as function of A and B while fixed factor C.
| Response (Rf value) | Type of model | Polynomial equation model for Y | Model P value | %CV | Adequate precision |
|---|---|---|---|---|---|
| OLM | Linear | +0.75+0.003018A+0.029B+0.003018C | <0.0001 | 1.00 | 18.865 |
| AML | Quadratic | +0.22+0.018A+0.032B+0.000C+0.0025AB+0.014AC+ | 0.0053 | 0.92 | 48.299 |
| 0.010BC-0.003333A2+0.001667B2+0.004167C2 | |||||
| HCTZ | Linear | +0.50+0.014A+0.020B+0.001036C | 0.0013 | 2.09 | 11.224 |
Table 4: Predicted response models and statistical parameters obtained from anova for ccd
Analysis of tablet formulation containing 20.00 mg of OLM, 12.50 mg of HCTZ and 5.00 mg of AML showed good recovery where percentage amount for all the drugs were within the range of 99.57%-100.96% (Table 5) indicating that the method can be applicable in routine quality control testing of the tablet dosage formulation. The %RSD value was found to be less than 2.
| Drugs | Label claim (mg) | %Assaya | %RSD |
|---|---|---|---|
| OLM | 20.00 | 99.57 | 0.49 |
| AML | 5.00 | 100.48 | 0.68 |
| HCTZ | 12.50 | 100.96 | 0.85 |
Table 5: Analysis of hctz, aml and olm in pharmaceutical tablet formulation
The developed method was found to be novel, simple, accurate, precise, specific and reproducible for the simultaneous estimation of OLM, AML and HCTZ in bulk and tablet formulations. Moreover, the major advantage of developed HPTLC method is that several samples can be run simultaneously using a small amount of mobile phase unlike HPLC, thus lowering analysis time by high sample throughput and cost per analysis. The application of CCD on robustness was to study simultaneous variation of effects on responses. CCD was applied to design the experimental program by evaluating the effects of developing distance, methanol content in total mobile phase, and band size. Methanol content in mobile phase appeared to have significant effect on robustness, compared to other factors and hence it was important to be carefully controlled. It is concluded that the use of experimental design and response surface methodology is a flexible procedure, able to reduce the number of the needed experiments for the robustness study of HPTLC method.The method was found to be repeatable and suitable for routine quality control and combined dosage form analysis.
Acknowledgements
The authors express their gratitude to Glenmark Generics Ltd., Pune, Prudence Pharma Chem, Ankleshwar and Ipca Laboratories Ltd, Ratlam (MP) for providing gift sample of standard olmesartan medoxomil, amlodipine besylate and hydrochlorothiazide, respectively.
References
- Kearney PM, Whelton M, Reynolds K, Muntner P, Whelton PK, He J.Global burden of hypertension: Analysis of world wide data. Lancet 2005;365:217-23.
- Kakumani KK, Chimalakonda KR, Madhusudan G, Khagga M. Rapid simultaneous determination of olmesartan, Amlodipine and Hydrochlorothiazide in combined pharmaceutical dosage form by Stability-Indicating ultra performance liquid chromatography. Am J Anal Chem 2012;3:50-8.
- Rang HP, Dale MM, Ritter JN, Moore PK. Pharmacology. 5th ed. London: Elsevier Churchill Livingstone; 2003. p. 307-13.
- Barar FS. Essentials of Pharmacotherapeutics S. India: Chand and Company Ltd; 2004. p. 298-301, 239-49.
- Bruton L, Parker K, Blumenthal D, Buxton I. Goodman and Gilman?s Manual of pharmacology and therapeutics. USA: The McGraw Hill Companies Inc.; 2008. p. 544.
- Tripathi KD. Essential of Medical Pharmacology. 5th ed. New Delhi: Jaypee Brothers Medical Publishers; 2003. p. 48-52.
- Patil P, More H, Pishwikar S. RP-HPLC for simultaneous estimation of Amlodipine besylate and Olmesartanmedoxomil from tablet. Int J Pharm PharmSci 2011;3:146-9.
- Chabukswa A, Kuchekar B, Jagdale S, Mehetre D, More A, LokhadeP. Development and validation of a RP-HPLC method for simultaneous estimation of Olmesartanmedoxomil and Amlodipine besylate in tablet dosage form. Arch ApplSci Res 2010;2:307-12.
- Amudhavalli V, Lakshmi K. Karthick M. Determination of Olmesartan and Hydrochlorthiazide in pharmaceutical formulations by RP-HPLC. Int J ChemSci 2011;9:470-6.
- Murakami T, Konno H, Fukutsu N, Onodera M, Kawasaki T, Kusu F. Identification of a degradation product in stressed tablets of olmesartanmedoxomil by the complementary use of HPLC hyphenated techniques. J Pharm Biomed Anal 2008;47:553-9.
- Rao C, Kakumani K, Maddala V, Polisetty S, Gutta M, Khagga M, et al. Development and validation of stability indicating LC method forolmesartanmedoxomil. Am J Anal Chem 2012;3:153-60.
- Jain PS, Patel MK, Gorle AP, Chaudhari AJ, Surana SJ. Stability-Indicating method for simultaneous estimation of olmesartanmedoxomil, Amlodipine Besylate and Hydrochlorothiazide by RP-HPLC in tablet dosage form. J ChromatogrSci 2012;50:680-7.
- Patil KR, Rane VP, Sangshetti JN, Yeole RD, Shinde DB. Stability indicating LC method for the simultaneous determination of amlodipine and Olmesartan in dosage form. J ChromatogrSci 2010;48:601-6.
- Godse V, Bhosale A, Bafana Y, Borkar D. ICH guidance in practice: Validated stability-indicating HPLC method for simultaneous determination of Olmesartanmedoxomil and Hydrochlorothiazide in combination drug products. Eurasian J Anal Chem 2010;5:137-44.
- Shah N, Suhagia B, Shah R, Patel N. Development and validation of a simultaneous HPTLC method for the estimation of olmesartanmedoxomil and hydrochlorothiazide in tablet dosage form. Indian J Pharm Sci 2007;69:834-6.
- Bari PD, Rote AR. RP-LC and HPTLC methods for the determination of olmesartanmedoxomil and Hydrochlorothiazide in combined tablet dosage forms. Chromatographia 2009;69:1469-72.
- Sharma H, Jain N, Jain S. Development of spectrophotometric method for quantitative estimation of amlodipine besylate, OlmesartanMedoxomil and Hydrochlorthiazide in tablet dosage form. Pharm Anal Acta 2011;2:126.
- Rote AR, Bari PD. Spectrophotometric Estimation of Olmesartanmedoxomil and Hydrochlorothiazide in Tablet. Indian J Pharm Sci 2010;72:111-3.
- Sharma H, Sahu V, Sahu R, Dandotiya N. Simultaneous spectrophotometric estimation of amlodipine besylate, olmesartanmedoxomil and hydrochlorthiazide in tablet dosage form by three wavelength equation method. Int J Adv Pharm Res 2012;3:820-4.
- Indian Pharmacopoeia. Vol. II. Ghaziabad, India: Indian Pharmacopoeia Commission; 2010. p. 1451-2.
- British Pharmacopoeia. Vol. II. London: HMSO; 2009. p. 325-2986.
- United State Pharmacopoeia. USP 35 and NF 30, Vol. II. Rockville, MD: United State Pharmacopoeial Commission; 2012. p. 2288.
- Kaul N, Agrawal H, Paradkar AR, Mahadik KR. HPTLC method for determination of nevirapine in pharmaceutical dosage form. Talanta 2004;62:843-52.
- Swarbrick J. Encyclopedia of pharmaceutical technology. 3rd ed., vol. 1. London, UK: Informa Healthcare Inc; 2007. p. 2452-67.
- Deming SN, Morgan SL. Experimental design: A chemometricalapproach. Amsterdam: Elsevier; 2003.
- Srinubabu G, Jaganbabu K, Sudharani B, Venugopal K, Girizasankar G, Rao JV. Development and validation of a LC method for the determination of Pramipexole using an experimental design.Chromatographia 2006;64:95.
- Srinubabu G, Raju CH, Sarath N, Kumar PK, Rao JV. Development and validation of a HPLC method for the determination of Voriconazole in pharmaceutical formulation using experimental design. Talanta2007;71:1424-9.
- Vander Heyden Y, Nijhuis A, Smeyers-Verbeke J, Vandeginste BG, Massart DL. Guidance for Robustness/Ruggedness tests in method validation. J Pharm Biomed Anal 2001;24:723-53.
- Harang V, Karlsson A, Josefson M. Liquid chromatography method development and optimization by statistical experimental design and chromatogram. Chromatographia 2001;54:703.
- Vladimir W, Anthony F. Central composite design as a powerful optimization technique for enantioresolution of the rac-11-dihydrooracin-the principal metabolite of the potential cytostatic drug oracin. J BiochemBiophys Methods 2002;54:377-90.
- De Beer JO, Vandenbroucke CV, Massart DL, De Spiegeleer BM. Half-fraction and full factorial designs versus central composite design for retention modeling in reversed phase ion-pair liquid chromatography. J Pharm Biomed Anal 1996;14:525.
- ICH Harmonized Tripartite Guideline, Validation of analytical procedures: Text and Methodology Q2 (R1), International Conference on Harmonization. Geneva, Switzerland, 2005.
- Zar JH. Biostatistical analysis. 5th ed. Upper saddle River NJ, USA: Pearson Educational Publications; 2010.
