- *Corresponding Author:
- R. Sharma
School of Pharmacy, Devi Ahilya Vishwavidyalaya, Takshshila Campus, Khandwa Road, Indore-452 001, India
E-mail: rbsm73@yahoo.co.in
| Date of Submission | 05 October 2013 |
| Date of Revision | 28 October 2014 |
| Date of Acceptance | 02 March 2015 |
| Indian J Pharm Sci, 2015;77(2):142-150 |
Abstract
Comparative study was performed on 34 β-amino amide derivatives as dipeptidyl peptidase IV inhibitors in order to determine their structural requirement to enhance the antidiabetic activities. Hologram quantitative structure activity relationships models utilized specialized fragment fingerprints (hologram length 353) which showed good predictivity with cross-validated q 2 and conventional r 2 values of 0.971 and 0.971, respectively. Models were validated and optimized by a test set of eight compounds and gave satisfactory predictive ability. Hologram quantitative structure activity relationships maps were helpful in prediction of the structural features of the ligands to account for the activity in terms of positively and negatively contributing towards activity. The information obtained from maps could be effectively use as a guiding tool for further structure modifications and synthesis of new potent antidiabetic agents.
Keywords
Dipeptidyl peptidase IV, fragment distinct, fragment size, hologram length, β-amino amide
Diabetes remains with infected person and leads to death if proper medication not taken, till date no suitable prophylactic treatment available for diabetes mellitus. Diabetes mellitus is a metabolic disorder caused by several factors including glucose metabolism, environmental power, wounds healing, acidity in stomach, genetic imperfections defects, endocrinopathy, exocrine pancreatitis and sudden infection. Based on condition and sensitivity of β cell in pancreas, diabetes mellitus divided into two forms, type 1 (T1DM) and type 2 diabetes mellitus (T2DM). Among these forms, T2DM considered to be dangerous, causes maximum deaths worldwide. Thus if the specified treatment not taken for T2DM leads to fluctuation in body cell can cause numerous chronic complications such as retinopathy, nephropathy, neuropathy, and cardiovascular diseases, the latter leading to increased mortality. Over all 90% of the total occurrence diabetes cases were due to T2DM, which is characterized as hyperglycemia, insulin resistance, hyperlipidemia, surplus glucagon secretion and insufficient secretion of the incretin hormone glucagon-like peptide-1 (GLP-1)[1,2]. GLP-1 is an insulinotropic hormone with antidiabetic activity due to its effects on glucose-dependent stimulation of insulin and inhibition of glucagon secretion, tropic repairing of pancreatic β-cells, reduction of gastric emptying and appetite[3]. The several enzyme were responsible for insulin activation and deactivation. Inactivation of the insulin leads to problem and occurrence of the T2DM. The enzyme which increased the sensitivity of insulin was GLP-1 and incretins. But GLP-1 inactivated in presence of serine peptidase enzyme[4]. The serine peptidase enzyme dipeptidyl peptidase IV (DPP IV) is responsible for degradation of GLP-1, which decreases the release of insulin. DPP IV also known as CD26, is a type II transmembrane glycoprotein expressed on a variety of cell types with multifunctional properties, its inhibition is the treatment of T2DM[3,4]. Thus for maintaining and controlling the level of insulin there is necessitate of inhibition of targeted enzyme DPP IV. Now DPP IV is a clinically validated target for the management of type 2 diabetes[5,6] and has received considerable curiosity from the pharmaceutical industry in last few years. These approaches to utilize the beneficial effects of GLP-1 in the treatment of T2DM by the development of orally active DPP IV inhibitors have been considered. Preclinical studies suggested that this approach is effective in enhancing endogenous levels of GLP-1 resulting in improved glucose tolerance in glucoseintolerant and diabetic animal models[7–9]. Since the discovery that the in vivo liability of GLP-1 was due to its rapid inactivation by DPP IV, a number of low molecular weight, orally active DPP IV inhibitors, suitable for clinical use, have been developed. DPP IV inhibition has thereby been demonstrated to be anti diabetic both in animal models of diabetes and in patients with T2DM.
Some inhibitors described in the literature[10–12] and a number of are even undergoing various stages of clinical trials and approved such as vildagliptin[13], sitagliptin[14,15] in order to succeed as potent antidiabetic drugs[16]. However, there is still a need for more potent, selective and safe DPP IV inhibitors, which lack the in specificity and side-effects possessed by the presently available inhibitors.
The selected β-amino amide inhibitor series designed by Heung et al[17]. seemed to be quite promising due to their varied structure activity profiles. The Hologram quantitative structure activity relationships (HQSAR) had been applied in order to correlate the structural or property descriptors of these compounds with their experimental activities.
The HQSAR methods have certain advantages over classical QSAR methods, which are simple less time consuming, robust and do not require determination of 3D structures and molecular alignment or putative binding conformation. However, HQSAR provide more unique solutions and also overall predictive quality be as good as classical (Hansch, Fujita and Free Wilson QSAR) and computational approach which where more complex and less demanding.
The fragment collision is limitation of HQSAR technique, which happens during the hashing process of fragments generation. In fragmentation process hashing reduces the length of the hologram and bin collection pattern of part of fragments. The hologram length, parameter definable by user, controls the number of bins in the hologram and alteration of hologram length can causes the pattern of bin occupancies to change. The program provides 12 default lengths which have been found to give good predictive models on different datasets. Each of these default lengths provides a unique set of fragment collisions.
HQSAR was used to study a set of β-amino amide scaffold. HQSAR was used to identify structural features with poor and favorable contributions towards molecular interactions in the active site. In addition, HQSAR has been used in virtual screening to identify hits. For instance, we studied a set of 34 β-amino amide derivatives having potent DPP IV inhibitory activity.
Materials and Methods
Structure assessment
A total of 34 molecules with DPP IV inhibitory activity[17] were selected for HQSAR analysis and chemical structure constructed on the Sketch module of Sybyl X2.0 software. The HQSAR studies require the minimization of structure, calculation of the force field and charges. The energy minimization and charge calculation done by Tripos force field and Pullman charge, respectively. Further statistical analysis performed by HQSAR technique with PLS validation. PLS validations performed with leave one out (LOO) and no validation method.
Data set
The series of total thirty four β-amino amide analogues with IC50 nM collected from the previous reported literature, which was suitable for the HQSAR analysis. The similarity on pharmacological activity (Mouse DPP IV enzyme) of dataset is one of the important aspects for HQSAR Studies (fig. 1)[17]. For performing the further analysis the pharmacological activity of selected series IC50 (IC50=activity ranges from 569 to 24.9 nM) was converted to pIC50 (pIC50=activity ranges from 7.943 to 6.001). The converted pIC50 was considered as dependent variable in the HQSAR analysis for model generation. The model generation depends on the training and test set (Table 1). Thus the dataset was divided into the test set and the training set by diversity and dissimilarity method, so that all structure dataset covers the structural diversity, chemical assessment, chemical prototype and complete range of pharmacological activity of both set. The series consist of eight tests set molecule for external validation and remaining considered as training set molecule for internal validation. Therefore it has been recommended that generated models should be tested on a sufficiently large test set to establish a statistically meaningful and reliable HQSAR model[19-21].
| SN | R1 | IC50(nM) | Actual pIC50 | Predicted pIC50 | Residual |
|---|---|---|---|---|---|
| 1. |  |
85.7 | 6.712 | 6.758 | −0.046 |
| 2.* | 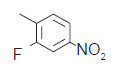 |
194 | 6.067 | 6.998 | −0.931 |
| 3. |  |
291 | 6.536 | 6.492 | 0.044 |
| 4. |  |
264 | 6.578 | 6.612 | −0.034 |
| 5.* |  |
99.7 | 6.001 | 6.969 | −0.968 |
| 6. | 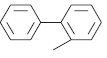 |
569 | 6.244 | 6.202 | 0.042 |
| 7. |  |
50.4 | 6.297 | 7.301 | −1.004 |
| 8. |  |
101 | 6.995 | 7.092 | −0.097 |
| 9.* |  |
103 | 6.987 | 7.044 | −0.057 |
| 10. | 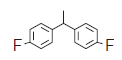 |
212 | 6.673 | 6.667 | 0.006 |
| 11. |  |
52.6 | 7.279 | 7.309 | −0.03 |
| 12. |  |
45.3 | 7.343 | 7.301 | 0.042 |
| 13.* |  |
39.0 | 7.408 | 7.332 | 0.076 |
| 14. | 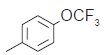 |
64.6 | 7.190 | 7.217 | −0.027 |
| 15.* | 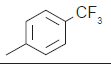 |
56.4 | 7.248 | 7.263 | −0.015 |
| 16. | 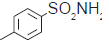 |
45.3 | 7.343 | 7.338 | 0.005 |
| 17. | 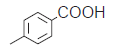 |
53.4 | 7.272 | 7.306 | −0.034 |
| 18.* | 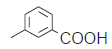 |
56.9 | 7.244 | 7.268 | −0.024 |
| 19. |  |
47.7 | 7.321 | 7.307 | 0.014 |
| 20.* |  |
67.7 | 7.169 | 7.142 | 0.027 |
| 21. |  |
24.9 | 7.603 | 7.590 | 0.013 |
| 22. |  |
65.4 | 7.184 | 7.215 | −0.031 |
| 23. |  |
57.6 | 7.239 | 7.201 | 0.038 |
| 24.* |  |
74.4 | 7.128 | 7.094 | 0.034 |
| 25. |  |
91.5 | 7.038 | 7.066 | −0.028 |
| 26. |  |
31.2 | 7.505 | 7.510 | −0.005 |
| 27. |  |
50.6 | 7.295 | 7.299 | −0.004 |
| 28. |  |
33.9 | 7.469 | 7.463 | 0.006 |
| 29. |  |
76.2 | 7.118 | 7.173 | −0.055 |
| 30. |  |
36.7 | 7.435 | 7.400 | 0.035 |
| 31. |  |
42.2 | 7.374 | 7.289 | 0.085 |
| 32. |  |
30.5 | 7.515 | 7.510 | 0.005 |
| 33. |  |
113.9 | 7.943 | 7.103 | 0.84 |
| 34. |  |
57.4 | 7.241 | 7.160 | 0.081 |
Table 1: Condt...

Figure 1: The structures of molecule used in training and test set.
HQSAR studies
HQSAR technique does not require the alignment of dataset on common template, after completion of statistical parameter analysis provides exact information of required of functional group with contribution into the chemical structure. HQSAR is a novel technique requires 2D structure which employs specialized fingerprints as predicted variable of pharmacological activity. The pharmacological activity data pIC50 considered to be a dependent variable. The HQSAR model generated on the two steps firstly calculation of molecular fingerprints and secondly PLS validation analysis. Concerned sensitivity of the generated model depends on the parameters as hologram length, Fragment size and fragment distinct. The different combination were tried to obtain a better model which statistically provides the information regarding the structural requirement. The analysis was based on the fragment distinction and fragment size.
Fragment distinction
The several fragment distinction imported which imparted a better idea. The fragment distinct available were atoms (A), bonds (B), connections (C), hydrogen atoms (H), chirality (Ch), and donor and acceptor (DA). The several combinations were taken in search of better understanding of the dataset and future suggestion of the novel structure. We performed the HQSAR analyses by screening the 12 default series of hologram length values ranging from 53 to 401 bins, initially using the fragment size default (4–7). The 16 combination which were selected for analysis as A/B, A/B/C, A/B/H, A/B/Ch, A/B/DA, A/B/C/H, A/B/C/Ch, A/B/C/DA, A/B/H/Ch, A/B/H/DA, A/B/Ch/ DA, A/B/C/H/DA, A/B/C/H/DA, A/B/C/H/DA, A/C/H/ DA and A/C/H/Ch/DA. The fragment distinction based model generated the statistical parameter on the basis of which further analysis performed. The statistical parameter obtained after completion of analysis were NC, q2, r2, SE, BHL and predicted pIC50, which provides the useful information on the basis of best model subsequently fingerprint structure saved with color coding. The best model coming out of sixteen combinations were A/B/C and A/B/DA. The predicted pIC50 activity of the best model A/B/C of default fragment size 4-7 presented in the Table 1.
Fragment size
On the default fragment size 4-7 two statistically optimum combination obtained with different fragment distinction, chosen for further study which developed statistically best model. The selected fragment distinctions with better result were A/B/C and A/B/DA on which additional analysis performed through different fragment size. The 13 different fragment size preferred for analysis were 2-5, 3-6, 4-7, 5-8, 6-9, 7-10, 8-11, 2-6, 3-7, 4-8, 5-9, 6-10 and 7-11. The statistical parameter generated on these fragment size as NC, q2, r2, SE and BHL.
Results and Discussion
The selected dataset homogeneity achieved by in vivo analysis on mouse by DPP IV inhibition assay, compound 21 has least IC50 of 24.9 nM. So the compound 21 in dataset is most active. HQSAR analysis was performed on the dataset to identify the minimal 2D sub-structural requirement for antidiabetic activity besides the well-known role of the β-amino amide analogues. The dataset selected for the HQSAR study consist of 34 β-amino amide analogs is presented in Table 1. For HQSAR analysis purpose given IC50 nM converted to pIC50 nM. The frequency of statistical parameters depend on the range of acceptably distributed IC50 (569-24.9) and pIC50 (7.943-6.001). The dataset taken shows the diversity ratio range of pharmacological activity, in which it was easy to perform the analysis data.
The most commonly used techniques to generate QSAR models are multiple linear regression (MLR), genetic algorithm, principle component analysis, single linear regression and partial least squares (PLS). Classical QSARs most frequently use MLR where the ratio of the data points to the number of number of descriptors should not exceed five. While PLS analyses are particularly suited to situations where the number of descriptor variables exceeds the number of observations it is often the case that the principal components extracted from the descriptor variables has unclear physical meaning. It should be noted that the HQSAR technique does allow physical interpretation of PLS extracted QSAR model components in terms of 3D contour maps and also fragment counting and PLS analysis, are very fast.
The generated model consistency depends on statistical parameters, quality of both training and test sets in terms of chemical structural diversity and property value distributions. Training and test sets were carefully divided in such a way that structurally diverse ratio maintains on molecules of a wide range of pharmacological activities were included in both sets (fig. 2). From the original data set, twenty six compounds were selected as members of the training set for internal model predictivity, whereas the other eight compounds (2, 5, 9, 13, 15, 18, 20 and 24) were selected as members of the test set for external model predictivity. The graph was generated to suggest the distribution of the data set. A statistical cluster analysis confirmed that the composition of both training and test sets is representative of the whole data set, as can be seen in fig. 3.

Figure 2: The β-amino amide analogues predicted pIC50 with all dataset.
 Dataset,
  Training,
  Test.
Test.

Figure 3: The relation between actual pIC50 vs predicted pIC50 activity.
Series 1= training set; Series1, Series2.
The training and test molecule utilized in generation of the best statistical model which were further helpful in exploring novel compound. Thus, the dataset after dividing into the training and test set considered as appropriate for the purpose of HQSAR model development.
The role of the β-amino amide analogues is well established for defining antidiabetic activity. Thus HQSAR gave an insight into the quantitative role in determination of the chemical structural features in modulating antidiabetic activity in terms of favourable and unfavourable maps.
HQSAR models were generated on resultant series of DPP IV inhibitors activity (Table 1). HQSAR correlates pharmacological activity of dataset to structural fragments of selected series. In the HQSAR analysis several parameters were available slight changes in the parameter affects the results thus tried on different ways. As HQSAR models can be generated by a number of parameters concerning hologram generation, several combinations of fragment distinction were considered during the HQSAR modeling runs. Holograms were created using different combinations of atoms (A), bonds (B), connections (C), hydrogen atoms (H), chirality (Ch), and donor and acceptor (DA) as fragment distinctions.
We performed the HQSAR analyses by screening the 12 default series (53, 59, 61, 71, 83, 97, 151, 199, 257, 307, 353 and 401) of hologram length values ranging from 53 to 401 bins, initially using the fragment size default (4–7). The patterns of fragment counts from the training set inhibitors were related to the experimental biological activity using the partial least square PLS analysis. The 16 combination which were selected for analysis as A/B, A/B/C, A/B/H, A/B/Ch, A/B/DA, A/B/C/H, A/B/C/Ch, A/B/C/DA, A/B/H/Ch, A/B/H/DA, A/B/Ch/DA, A/B/C/H/DA, A/B/C/H/DA, A/B/C/H/DA, A/C/H/DA and A/C/H/ Ch/DA. The statistical results obtained from PLS validation analyses using several fragment distinction combinations and the default fragment size (4–7) is presented in Table 2.
| Model | Fragment distinct NC | q2 | r2 | Ensemble q2 | SE | BHL | |
|---|---|---|---|---|---|---|---|
| 1 | A/B | 4 | 0.881 | 0.921 | 0.902 | 0.076 | 307 |
| 2 | A/B/H | 3 | 0.776 | 0.911 | 0.907 | 0.069 | 257 |
| 3 | A/B/C | 6 | 0.971 | 0.971 | 0.962 | 0.056 | 353 |
| 4 | A/B/Ch | 4 | 0.842 | 0.918 | 0.917 | 0.084 | 353 |
| 5 | A/B/DA | 6 | 0.957 | 0.942 | 0.952 | 0.063 | 257 |
| 6 | A/B/C/H | 5 | 0.872 | 0.918 | 0.932 | 0.096 | 353 |
| 7 | A/B/C/Ch | 6 | 0.723 | 0.867 | 0.922 | 0.083 | 199 |
| 8 | A/B/C/DA | 4 | 0.851 | 0.931 | 0.942 | 0.055 | 307 |
| 9 | A/B/H/Ch | 6 | 0.821 | 0.901 | 0.924 | 0.076 | 353 |
| 10 | A/B/H/DA | 6 | 0.921 | 0.915 | 0.929 | 0.089 | 307 |
| 11 | A/B/Ch/DA | 6 | 0.731 | 0.874 | 0.927 | 0.087 | 353 |
| 12 | A/B/C/H/DA | 6 | 0.928 | 0.879 | 0.892 | 0.096 | 257 |
| 13 | A/B/C/H/DA | 6 | 0.836 | 0.761 | 0.862 | 0.069 | 257 |
| 14 | A/B/C/H/DA | 6 | 0.724 | 0.909 | 0.874 | 0.078 | 199 |
| 15 | A/C/H/DA | 6 | 0.897 | 0.934 | 0.862 | 0.083 | 353 |
| 16 | A/C/H/Ch/DA | 6 | 0.893 | 0.937 | 0.862 | 0.066 | 257 |
NC: Number of component, SE: standard error, BHL: best hologram length, A: atom, B: bond, C: connections, H: hydrogen, Ch: chirality, DA: donor and acceptor
Table 2: The Statistics Models Of Fragment Size (4‑7)
On analysis different model were generated on the basis of the statistical parameters the best model selected. According to Table 2, the best statistical results among all models using the training set compounds were obtained for model 03 (r2=0.971, q2=0.971, BHL 353, NC 6), which was resultant using the following combination of fragment distinctions: A, B, and C, with six being the optimum number of PLS components. This indicates that bonds, connections and donor and acceptor atoms are essential features of the molecular structures for biological activity. The two best fragment distinction were selected as A/B/C and A/B/DA and tried on the different fragment size.
In the fragment size maximum and minimum size was changes which alter the statistical parameters. On 13 different fragments size with selected fragment distinction A/B/C and A/B/DA for further study started. The influence of fragment size is of primary importance in the generation of HQSAR models, as this parameter controls the minimum and maximum lengths of fragments to be encoded in the hologram fingerprint. Hence, distinct fragment size combinations (2-5, 3-6, 4-7, 5-8, 6-9, 7-10, 8-11, 2-6, 3-7, 4-8, 5-9, 6-10 and 7-11) were investigated for the best model (model 13, Table 3) generated with the fragment size default (4–7). The HQSAR results obtained for several fragment sizes are displayed in Table 3, but no improvements were achieved in the statistical parameters. Although a measure of internal consistency, available in the forms of q2 and r2, is certainly important and significant, the most valuable test of a QSAR model is its ability to predict the activity of compounds not included in the training set. The structure encoded within a 2D fingerprint is directly related to biological activity of molecules within the training set, the high quality HQSAR models generated in this study can predict the activity of new structurally-related β amino amide analogs from its fingerprint. In this way, the predictive power of the best HQSAR model derived from the training set molecules (fragment distinction A/B/C; fragment size 4–7, Table 1) was assessed by predicting the pIC50 values for the test set compounds. The statistical parameters of external validation results are listed in Tables 2 and 3, and the graphic results for the experimental versus predicted activities of both compound sets (training and test sets) are displayed in fig. 3.
| ML | FS | NC | q2 | r2 | SE | BHL | |||||
|---|---|---|---|---|---|---|---|---|---|---|---|
| A1 | A2 | A1 | A2 | A1 | A2 | A1 | A2 | A1 | A2 | ||
| A | 2‑5 | 6 | 5 | 0.909 | 0.731 | 0.909 | 0.731 | 0.089 | 0.055 | 257 | 353 |
| B | 3‑6 | 6 | 5 | 0.867 | 0.928 | 0.867 | 0.928 | 0.087 | 0.076 | 199 | 257 |
| C | 4‑7 | 6 | 5 | 0.971 | 0.957 | 0.971 | 0.942 | 0.056 | 0.063 | 353 | 257 |
| D | 5‑8 | 6 | 5 | 0.918 | 0.917 | 0.872 | 0.909 | 0.076 | 0.096 | 257 | 353 |
| E | 6‑9 | 6 | 5 | 0.867 | 0.915 | 0.723 | 0.867 | 0.089 | 0.083 | 199 | 257 |
| F | 7‑10 | 6 | 5 | 0.931 | 0.874 | 0.851 | 0.872 | 0.087 | 0.055 | 353 | 257 |
| G | 8‑11 | 6 | 5 | 0.901 | 0.879 | 0.821 | 0.723 | 0.066 | 0.076 | 257 | 199 |
| H | 2‑6 | 6 | 5 | 0.915 | 0.761 | 0.921 | 0.851 | 0.059 | 0.089 | 257 | 353 |
| I | 3‑7 | 6 | 5 | 0.874 | 0.909 | 0.731 | 0.915 | 0.096 | 0.087 | 257 | 257 |
| J | 4‑8 | 6 | 5 | 0.879 | 0.867 | 0.928 | 0.874 | 0.046 | 0.066 | 353 | 257 |
| K | 5‑9 | 6 | 5 | 0.761 | 0.931 | 0.836 | 0.879 | 0.087 | 0.089 | 257 | 257 |
| L | 6‑10 | 6 | 5 | 0.909 | 0.901 | 0.909 | 0.761 | 0.066 | 0.087 | 257 | 199 |
| M | 7‑11 | 6 | 5 | 0.934 | 0.915 | 0.867 | 0.909 | 0.089 | 0.096 | 199 | 353 |
A1=A/B/C; A2=A/B/DA, NC: Number of component, SE: standard error, BHL: best hologram length, A: atom, B: bond, C: connections, H: hydrogen
Table 3: The Statistics Parameter Of Fragment Size And Distinct
The training set internal predictivity residual value obtained as difference of the actual and predicted pIC50 (Table 1), gives idea of the compound of minimum and maximum change in the activity of dataset while prediction of the model. The residual value least obtained for compounds 16 and 32 as 0.005 contains a functional group Phenyl SO2NH2 and 3 Phenyl pyridine. The both compound contains the phenyl ring with the nitrogen atom free as amine and in ring as pyridine. The compound 33 has maximum residual value as 0.84, functional group 3-fluoro pyridine. Thus the clue obtained after prediction is that if the nitrogen containing ring is attached with the electron donating then the residual value obtained was less and more with the electron withdrawing functional group. The IC50 value for the compound 16, 32 and 33 (45.3, 30.5 and 113.9), predicting value for these compound were 7.33, 7.510 and 7.103, respectively. So the residual value has its own importance in predicting the dataset. The range of the pIC50 obtained after generation of the suitable model was 7.59-6.202 and for residual value was -1.004-0.84.
The data points have larger residual value, concern to higher difference among actual activity and predicted activity. The larger residual value generated outlier data point of track changes compounds. The correlation of physicochemical parameter and predicted activity of compounds 6 and 33 (fig. 3) have an extreme change in value for one or more leverage predictors parameters, therefore have large effects on the PLS analysis therefore predicted value alters rapidly. As a results removal of outlier should not modify the statistical value. It is tempting to remove such compounds practically. Such removal is seldom acceptable and if performed, must be carefully recoded. In building the models, compound 33 and 6 was treated as an outlier, because including this compound the optimal models yielded a high residual value and poor biological activity respectively.
The external validation is trustworthy processes as the test set compounds are completely excluded while the internal predictivity of the training of the model. For external predictivity the test set compound included and final process performed. The very good relation between experimental and predicted pIC50 values for the test set compounds indicates the robustness of the HQSAR model (r2 pred=00.91). As seen in Table 1, the predicted values fall close to the experimental pIC50 values, deviating by less than 0.027, 0.034 and 0.076 log units for 20, 24 and 13 compounds respectively. The predictivity less changed in term of log unit for the compound 24. The HQSAR model obtained is reliable and can be used to predict the pharmacological activity of novel compounds within this structural class. Besides predicting the pharmacological activity of untested molecules, HQSAR models provide important information regarding clues as to what molecular fragments are directly related to pharmacological activity. This idea of better understanding can be achieved through a careful interpretation of the chemical structural fragments integrated to the hologram-based QSAR models. HQSAR models can be graphically represented in the form of contribution maps where the color of each molecular fragment reflects the contribution of an atom or a small number of atoms to the activity of the molecule under study. The contribution map obtained from the HQSAR module implemented in SYBYL-X 2.0 uses a color scheme to discriminate individual atomic contributions to activity. The colors encoded in structure fragment at the red end of the spectrum (red, red-orange and orange) reflect poor contributions, whereas colors encoded in structure fragment at the green end (yellow, green-blue and green) reflect favorable contributions.
Atoms with intermediate or moderate contributions in pharmacological activity are colored as white. The intermediate contributor was helpful in maintaining the common structure only but they are not contributing more towards the activity side. Atoms corresponding to the maximal common structure (MCS) are colored cyan, since it is common to all compounds and contributes in the same manner for all molecules in the training set.
The most important fragments of compounds 7 and 11 (two of the most potent inhibitors of the data set) along with slight lower activity of compound 8 and 1, the least potent inhibitor of the training set are 3, 4 and 6 presented in fig. 3. According to the contribution maps, the molecular fragments corresponding to the phenyl moiety with cyano group are strongly related to pharmacological affinity (green).
We also observed important structural features such as regions with poor contributions (colored in orange and red) that can be identified as potential achieved targets for molecular modification and further creation of SAR studies (fig. 4). The color coding is based on the activity contribution of the individual atoms of the molecules. The individual atomic contribution of the most potent compounds is presented in fig. 4 where the bulky and electron donating group were attached to the β-amino amide ring define the antidiabetic activity, in addition to the well-known β-amino amide.

Figure 4: The compounds 1, 3, 4, 6, 7, 8 and 11 contributing map.
In compound 1, triflouro phenyl ring is marked with yellow color at 3rd position indicates that positive contribution (no bulky group is required). In compound 3, diflouro phenyl ring attached with piperazine is covered with red color at 3rd position indicates negative contribution (electron donating group is required). In compound 4 the 4 hydroxyl ethyl phenyl ring attached with piperazine is marked with red color at 3rd position indicates negative contribution (that electron donating group is required). In compound 6 the bis phenyl ring attached with piperazine is marked with red color at different position indicates negative contribution (that electron donating group is required). In compound 7 the 2-cyano phenyl ring attached with piperazine is marked with green color at 1st and 4th position indicates positive contribution (that bulky group is required to increase the biological activity). The piperazine ring also contains the green color indicates positive contribution (requirement of bulky group). In compound 8 the 4-cyano phenyl ring attached with piperazine is marked with yellow color at 1st and 3rd position indicates positive contribution (no bulky group is essential to increase the biological activity). The piperazine ring also contains the yellow color indicates positive contribution (requirement of no bulky group). In compound 11 the piperazine is marked with yellow color at 1st and 5th position indicates positive contribution (that no bulky group is required to increase the biological activity). The piperazine ring also contains the green color at 2nd and 6th indicates positive contribution (necessity of bulky group). The amino ketone contains the yellow color indicates positive contribution (no bulky group attached on specified position). The compound 7 shows the positive contribution, compound 1, 8 and 11 indicates moderate contribution and compound 3, 4 and 6 shows negative contribution (fig. 4) for DPP IV inhibitory activity. The spectrum of colour coding on the fragment structure presented in the fig. 5.

Figure 5: The color encoded (A) and structural fragment contribution (B) for activity. The green and yellow color (represents positive contribution), white color (indicates intermediate or moderate contribution) while red and orange (negative contribution), suggested the structure fragment requirement for enhancing the binding affinity.
The present study describes the successful application of computational approaches to identify essential structural requirements in 3D chemical space for the modulation of antidiabetic activity of substituted β-amino amide. Applied HQSAR effectively to rationalize the 3D space in diverse substituted β-amino amide in terms of their steric, electrostatic and hydrophobic interaction for their antidiabetics activity. The developed models showed good statistical significance in internal validation (q2), external validation (r2) and performed very well in predicting the antidiabetic activity of eight substituted β-amino amide in the test set. HQSAR study based sets provided the 2D sub-structural requirements and showed good statistical significance in internal validation (r2) as well as predicting very well the antidiabetic activity of the test set compounds. The HQSAR models were generated using the different fragment size combined with various fragment distinct and various hologram lengths as summarized in Tables 2 and 3. The model with 4-7 fragments with an r2 value of 0.971 at six components and 353 hologram lengths was selected. In order to further analyse this, the dataset was divided into the training and 8 test set as in studies in order to access the predictive values of the model. The observed q2 and r2 value 0.971 and 0.971 between actual and predicted pIC50 of the training and test set, respectively, further signified the quality of the model. The predictive pIC50 values of the training as well as test set molecules based on the HQSAR model generated. An attractive property of the QSAR technique is that it provides straightforward clues about the individual atomic contributions to biological activities through the use of different color codes. The piperazine ring on 3rd position is marked with red colour indicating the necessity of electron donating group and trfluoro phenyl ring not required the bulky group at 3rd position. The amide moiety contains the yellow colour it means that it doesn’t requires the bulky sustituents. HQSAR may be useful for designing new substituted β-amino amide with potent antidiabetic activity. The three structures were designed (R1=(CH2)2C6H5, (CH2)3C6H5 and (CH2)4C6H5) on the basis of HQSAR showed in the fig 5 with good predicted pIC50.
Acknowledgements
The authors are thankful to the Head, School of Pharmacy, Indore for providing facilities and University Grants Commission, New Delhi for fellowship and financial assistance.
References
- Lambeir AM, Durinx C, Scharpe S, De Meesterde I. Dipeptidyl-peptidase IV from bench to bedside: An update on structural properties, functions, and clinical aspects of the enzyme DPP IV. Crit Rev Clin Lab Sci 2003;40:209-94.
- Mentlein R, Gallwitz B, Schmidt WE. Dipeptidyl peptidase IV hydrolyses gastric inhibitory polypeptide, glucagon-like peptide, amide, peptide histidine methionine and is responsible for their degradation in human serum. Eur J Biochem 1993;214:829-35.
- Cordero OJ, Salgado FJ, Nogueira M. On the origin of serum CD26 and its altered concentration in cancer patients. Cancer ImmunolImmunother 2009;58:1723-47.
- Yazbeck R, Howarth GS, Abbott CA. Dipeptidyl peptidase inhibitors, an emerging drug class for inflammatory disease? Trends PharmacolSci 2009;30:600-7.
- Nauck MA, Heimesaat MM, Ørskov C, Holst JJ, Ebert R, Creutzfeldt W. Preserved incretin activity of glucagon-like peptide 1 7- 36 amide; but not of synthetic human gastric inhibitory polypeptide in patients with type II diabetes mellitus. J Clin Invest 1993;91:301-7.
- Rotella CM, Pala L, Mannucci E. Glucagon-like peptide 1 GLP-1; and metabolic diseases. J Endocrinol Invest 2005;28:746-58.
- Pauly RP, Demuth HU, Rosche F, Schmidt J, White HA, Lynn F, et al. Improved glucose tolerance in rats treated with the dipeptidyl peptidase IV CD26; inhibitor Ile-thiazolidide. Metabolism 1999;48:385-9.
- Balkan B, Kwasnik L, Miserendino R, Holst JJ, Li X. Inhibition of dipeptidyl peptidase IV with NVP-D:728 increases plasma GLP-1 7-36 amide; concentrations and improves oral glucose tolerance in obese Zucker rats.Diabetologia 1999;42:1324-31.
- Ahren B, Holst JJ, Martensson H, Balkan B. Improved glucose tolerance and insulin secretion by inhibition of dipeptidyl peptidase IV in mice. Eur J Pharmacol 2000;404:239-45.
- Deacon CF, Hughes TE, Holst JJ. Dipeptidyl peptidase IV inhibition potentiates the insulinotropic effect of glucagon-like peptide-1 in anesthetized pigs. Diabetes 1998;47:764-9.
- Sudre B, Broqua P, White RB, Ashworth D, Evans DM, Haigh R, et al. Chronic inhibition of circulating dipeptidyl peptidase IV by FE 999011 delays the occurrence of diabetes in male Zucker diabetic fatty rats. Diabetes 2002;51:1461-9.
- Pederson RA, White HA, Schlenzig D, Pauly RP, McIntosh CH, Demuth HU. Improved glucose tolerance in Zucker fatty rats by oral administration of the dipeptidyl peptidase IV inhibitor isoleucine thiazolidide. Diabetes 1998;47:1253-8.
- Villhauer EB, Brinkman JA, Naderi GB, Burkey BF, Dunning BE, Kapa P, et al. 1-[[3-Hydroxy-1-adamantyl;amino]acetyl]-2-cyano-S;-pyrrolidine: Apotent, selective, and orally bioavailable dipeptidyl peptidase IV inhibitor with antihyperglycemic properties. J Med Chem 2003;46:2774-89.
- Corbett JW, Dirico K, Song W, Boscoe BP, Doran SD, Boyer D et al. Design and synthesis of potent amido- and benzyl-substituted cis-3-amino-4-2-cyanopyrrolidide;pyrrolidinyl DPP: IV inhibitors. Bioorg Med ChemLett 2007;17:6707-13.
- Augeri DJ, Robl JA, Betebenner DA, Magnin DR, Khanna A, Robertson JG. Discovery and preclinical profile of saxagliptin BMS-477118. A highly potent, long-acting, orally active dipeptidyl peptidase IV inhibitor for the treatment of Type 2 diabetes. J Med Chem 2005;48:5025-37.
- Ahre´n B, Gomis R, Standl E, Mills D, Schweizer A. Twelve- and 52-week efficacy of the dipeptidyl peptidase IV inhibitor LAF237 in metformin treated patients with type 2 diabetes. Diab Care 2004;27:2874-80.
- Heung JK, Woo YK, Jong PM, Si YS, Ha DK, Mi KK, et al.Dipeptidyl peptidase-4 inhibitor with β-amino amide scaffold: Synthesis SAR and biological evaluation. Bioorg Med ChemLett 2012;22:5545-9.
- Saxena AK, Prathipati P. Comparison of MLR PLS and GA-MLR in QSAR analysis. SAR QSAR Environ Res 2003;14:433-46.
- SYBYL69. St Louis, MO, USA: TriposInc; 2006.
- Baker NA, Sept D, Joseph S, Holst MJ, McCammon JA. Electrostatics of nanosystems: Aplication to microtubules and the ribosome. ProcNatlAcadSci USA 2001;98:10037-41.
- Bush BL, Nachbar RB Jr. Sample-distance Partial Least Squares: PLS optimized for many variables, with application to CoMFA. J Comput Aided Mol Des 1993;7:587-619.