- *Corresponding Author:
- M. A. Mahmoud
Department of Pharmacy Practice, College of Pharmacy, Helwan University, Cairo,Egypt
E-mail: dr.mohamed.adel@hotmail.com
| Date of Submission | 24 May 2013 |
| Date of Revision | 29 November 2013 |
| Date of Acceptance | 3 December 2013 |
| Indian J Pharm Sci, 2014;76(1):82-86 |
Abstract
The purpose of this study is to determine the pharmacokinetic parameters of vancomycin in Egyptian paediatric oncology patients and to evaluate the factors that influence the variability of the pharmacokinetic parameters in this population. Vancomycin serum concentration at steady state was determined in 51 paediatric cancer patients who were treated with vancomycin multiple intravenous infusions. Also individual vancomycin pharmacokinetic parameters were calculated assuming one compartment model. The mean vancomycin total body clearance and mean vancomycin volume of distribution were significantly higher among the age range of 2 to <12 years as compared with older age. Obese patients showed significant lower values of peak and trough vancomycin concentrations than those of normal and underweight patients. A significant correlation was found between the estimated creatinine clearance (Schwartz formula) and vancomycin total body clearance in the studied patients. Also, a significant direct correlation between vancomycin volume of distribution and ratio between blood urea nitrogen (mg/dl)/weight (kg) was found. As a conclusion, age and obesity were identified as the most important factors influencing vancomycin total body clearance, volume of distribution and serum concentrations in the studied patients.
Keywords
Oncology, paediatrics, pharmacokinetics, vancomycin
Gram-positive cocci are the leading cause of infections in neutropenic patients, making up approximately 60-70% of documented infections [1,2]. Vancomycin is a glycopeptide antibiotic against Gram-positive bacteria including methicillin-resistant Staphylococci [3]; and continues to be a frequently prescribed antibiotic for suspected and confirmed Gram-positive sepsis among paediatric patients admitted to the intensive care unit [4].
Administration of vancomycin doses to paediatric patients that are based only on body weight have frequently been associated with inappropriate concentrations [5]. Individualisation of dosing regimens by measurement of vancomycin concentrations provides more accurate dosing in neonatal and paediatric populations [3,6].
Since there is no published report on vancomycin pharmacokinetics in Egyptian paediatric oncology patients, this study was conducted to assess the steady state vancomycin pharmacokinetics in Egyptian paediatric oncology patients and to evaluate factors those influence the variability of the pharmacokinetic parameters in this population.
The present study was conducted at the National Cancer Institute (NCI), Cairo University, Egypt during the period of July 2009 to January 2010 after obtaining approval from the Institute’s Medical Ethics Committee.
Fifty-one paediatric cancer patients of either sex (28 males and 23 females) ranging in age from 2 to 18 years were enrolled into the study (Table 1). Complete history and physical examination were performed before the administration of intravenous vancomycin. Inclusion criteria were: (a) to receive a constant dose of vancomycin (fixed dose and dosing interval) at least for 24 h to ensure achievement of the steady state condition; (b) age of more than 1 month and less than 18 years. Creatinine clearance for each patient was determined according to Schwartz formula [7], Cr Cl (ml/min/1.73 m2)=(K×Ht cm)/Scr mg/dl. Patients were classified into different groups according to age, gender and body mass index (BMI) for age percentiles (Table 1).
| Parameterand group | Number(%) | Mean age(years) | Meanweight (kg) | MeanBMI | Mean S.Cr. (mg/dl) | Mean CrCl(ml/min) | Mean BUN(mg/dl) |
|---|---|---|---|---|---|---|---|
| Age (years) | 11.3±4.97 | 37.4±20.5 | 18.7±4.7 | 0.39±0.25 | 237±75 | 19.5±7.97 | |
| 2 to<12 | 21 (41.2) | ||||||
| 12–18 | 30 (58.8) | ||||||
| Gender | |||||||
| Male | 28 (54.9) | ||||||
| Female | 23 (45.1) | ||||||
| BMI | |||||||
| Obese | 18 (35.3) | ||||||
| Normal | 24 (47.1) | ||||||
| Under weight | 9 (17.6) |
BMI=Body mass index, S. Cr=serum creatinine, CrCl=creatinine clearance, BUN=blood urea nitrogen. Values are the mean±standard deviation of the entire population of 51 subjects
Table 1: Demographic Characteristics Of The 51 Patients And Classification
Vancomycin (Vancocin® 500 mg vial, Eli Lilly, Cairo, Egypt) was administered via slow intermittent intravenous infusions over 30 min. All patients received a fixed dose of vancomycin of 15 mg/kg every 6 h with maximum dose of 500 mg every 6 h according to the hospital protocol. Two blood samples for vancomycin serum determination were drawn from a peripheral vein from each patient. The first blood sample was taken at least 1 h from the initiation of the infusion of the drug to avoid the distribution phase [8]; the second blood sample was taken at least one approximated t1/2 apart from the first sample to provide more precise estimates of the elimination rate constant (kel), from which trough could be calculated.
Blood samples were centrifuged at 3000 rpm for 10 min to separate the serums. Serum samples were kept frozen at -20° until the time of drug analysis. Vancomycin serum drug levels were measured by using vancomycin enzyme multiple immunoassay technique (Emit® 2000), supplied by Syva company (Dade Behring Inc., Cupertino, CA, USA); which showed a coefficient of variation (CV) of 4.2% at a concentration of 7.4 mg/l, 2.4% at 17.5 mg/l and 4.6% at 34.0 mg/l.
Individual vancomycin peak (Cssmax, in mg/l), trough (Cssmin, in mg/l), and pharmacokinetic parameters including elimination rate constant (kel, in h-1), elimination half-life (t1/2, in h), volume of distribution (Vd, l/kg) and total body clearance (ClT, l/h/kg) were determined assuming a one-compartment model using the following equations:
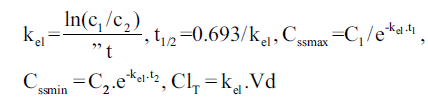 and
and 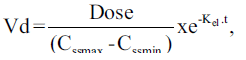
in which kel is the elimination rate constant (in h-1), c1, c2 are the 1st and 2nd vancomycin concentrations (in mg/l), is the time difference between the two vancomycin concentrations. t1/2 is the elimination half-life (in h), Cssmax and Cssmin are peak and trough concentrations at steady-state (in mg/l), t1 is the time difference between C1 and Cssmax, t2 is the time difference between C2 and Cssmin, ClT is the total body clearance in l/h/kg, Dose is the administered vancomycin dose (mg/kg) and t is the time (in h) to the calculated peak from the beginning of the infusion [3,9].
Kruskal–Wallis nonparametric method followed by Steel–Dwass multiple comparisons test were used to determine statistical difference of various pharmacokinetic parameters and also measured vancomycin levels (peak and trough concentrations) between more than two independent mean groups. Calculated parameters between two independent mean groups were compared by Mann–Whitney U test. Spearman’s Rho test (correlation analysis) was used to measure strength of association between numerical data. To compare the values of this study with other reports, mean and standard deviations of the mean pharmacokinetic parameters were determined. Statistical significance was considered at P-values less than 0.05. All statistical analyses were carried out using GraphPad Instat software package, V. 3.05, USA, 2000.
The study included 51 patients (28 males; 54.9% and 23 females; 45.1%). A summary of mean vancomycin peak and trough concentrations and pharmacokinetic parameters is presented in Table 2. As seen from Table 3, the mean vancomycin total body clearance and mean vancomycin volume of distribution were significantly higher (P<0.01) in age group 1 (2 to <12 years) as compared with age group 2 (12-18 years).
| Parameters | Mean±SD | Range | CV % |
|---|---|---|---|
| Cssmax (mg/l) | 22.9±12.2 | 8.86–72.9 | 53.4 |
| Cssmin (mg/l) | 5.52±2.51 | 1.1–12.9 | 45.5 |
| Vd (l/kg) | 0.9±0.57 | 0.14–3.2 | 63.1 |
| k (h‑1) el | 0.259±0.102 | 0.07–0.58 | 39.3 |
| ClT (l/h/kg) | 0.2±0.11 | 0.07–0.57 | 52.6 |
| t1/2 (h) | 3.269±1.74 | 1.2–9.9 | 53.23 |
Population pharmacokinetic parameter estimates of vancomycin in Egyptian oncology paediatric patients. Cssmax=steady state peak vancomycin concentration, Cssmin=steady state trough vancomycin concentration, Vd=volume of distribution, kel=elimination rate constant, ClT=vancomycin clearance, t1/2=elimination half‑life, SD=standard deviation, CV%=percent coefficient of variation
Table 2: population pharmacokinetic Parameter estimates of vancomycin
| Parameter | Age (years) | P value§ | Sig. | |
|---|---|---|---|---|
| Group (1)2 to<12 (n=21) | Group (2)12–18 (n=30) | |||
| Peak (mg/l) | 20.28±7.3 | 24.41±14.6 | 0.4969 | >0.05 ns |
| (9.6–40.95) | (8.85–72.86) | |||
| Trough (mg/l) | 5.33±3.12 | 5.65±2.02 | 0.3243 | >0.05 ns |
| (1.4–12.9) | (1.1–10.7) | |||
| ClT (l/h/kg) | 0.26±0.1 | 0.163±0.09 | 0.0001 | <0.001 |
| (0.1–0.57) | (0.07–0.48) | very sig. | ||
| Vd (l/kg) | 1.1±0.61 | 0.76±0.5 | 0.0112 | <0.01 |
| (0.5–3.2) | (0.14–2.3) | significant | ||
| t1/2 (h) | 3.24±1.97 | 3.3±1.59 | 0.6186 | >0.05 ns |
| (1.8–9.9) | (1.2–7.7) | |||
Values are expressed as mean±standard deviation and the values in parenthesis represent range. §§(Mann–Whitney test, ClT=total body clearance of vancomycin, Vd=volume of distribution of vancomycin, t1/2=elimination half‑life of vancomycin
Table 3: Effect of age on vancomycin drug Level and pharmacokinetics
Both vancomycin total body clearance and volume of distribution had decreased significantly (P<0.001) with increase in patients’ age (figs. 1 and 2).

Figure 1: Correlation between age and vancomycin total body clearance. n=51; spearman- r=-0.6160; P-value=0.0001*, *P-value<0.001 considered significant.

Figure 2: Correlation between age and vancomycin volume of
distribution.
n=51; spearman- r=-0.3853; P-value=0.0052*, *P-value<0.01
considered significant.
Other vancomycin pharmacokinetic parameters and drug levels did not differ among age groups. Gender in the studied patients showed a nonsignificant effect (P>0.05) on either vancomycin drug levels or pharmacokinetics (Table 4). Peak and trough vancomycin concentrations were significantly lower (P<0.01) in obese patients BMI group 1 as compared with normal patients BMI group 2 and underweight patients BMI group 3 (Table 5). Vancomycin total body clearance and volume of distribution were higher in obese patients than normal and underweight patients; however, this difference could not be considered statistically significant (P>0.05).
| Parameter | Gender | P value§ | Sig. | |
|---|---|---|---|---|
| Group (1) | Group (2) | |||
| Male (n=28) | Female (n=23) | |||
| Peak (mg/l) | 24.41±13.99 | 20.98±9.65 | 0.449 | >0.05 ns |
| (9.6–72.86) | (8.85–43.01) | |||
| Trough (mg/l) | 5.86±2.53 | 5.09±2.47 | 0.3488 | >0.05 ns |
| (1.4–12.9) | (1.1–10.7) | |||
| ClT (l/h/kg) | 0.19±0.11 | 0.21±0.1 | 0.4266 | >0.05 ns |
| (0.07–0.57) | (0.085–0.48) | |||
| Vd (l/kg) | 0.89±0.63 | 0.9±0.48 | 0.6840 | >0.05 ns |
| (0.14–3.2) | 0.27–2.3 | |||
| t1/2 (h) | 3.3±1.76 | 3.23±1.74 | 0.4776 | >0.05 ns |
| (1.2–9.9) | (1.8–7.7) | |||
Values are expressed as mean±standard deviation and the values in parenthesis represent range §(Mann–Whitney test, ClT=total body clearance of vancomycin, Vd=volume of distribution of vancomycin, t1/2=elimination half‑life of vancomycin)
Table 4: Effect Of Gender On Vancomycin Drug Level And Pharmacokinetics
Values are expressed as mean±standard deviation and the values in parenthesis represent range. §(Kruskal–Wallis test, ClT=total body clearance of vancomycin, Vd=volume of distribution of vancomycin, t1/2=elimination half‑life of vancomycin).
Table 5: Effect Of Bmi On Vancomycin Drug Level And Pharmacokinetics
Vancomycin total body clearance had increased significantly (P<0.01) with increase in CrCl (fig. 3), the equation that represents this relationship was found to be vancomycin ClT (l/h/kg) = 0.079 (CrCl l/h/kg)+0.159. Also, vancomycin volume of distribution had increased significantly (P<0.05) with increase in ratio between blood urea nitrogen (BUN) (mg/dl)/weight (kg) (fig. 4), the equation for this relationship was vancomycin Vd(l/kg)=0.235 [(BUN)/ weight]+0.769.

Figure 3: Correlation between vancomycin clearance (ClT) and
creatinine clearance (CrCl).
n=51; spearman- r=0.4933; P-value=0.001*, *P-value<0.01 considered
significant. ClT= 0.079CrCl + 0.159.

Figure 4: Correlation between vancomycin volume of distribution (Vd) and blood urea nitrogen/weight. n=46; spearman- r=0.2958; P-value=0.0460*, *P-value<0.05 considered significant. Vd(l/kg)=0.235 BUN/wt+0.769.
Many co-variables that affect vancomycin pharmacokinetics and consequently cause individual variability in responding to vancomycin therapy have been extensively reviewed in the literature. Of these variables are obesity [10,11], age [12], gender [13] and renal function [14-16]. Understanding factors that influence vancomycin pharmacokinetics may assist in drug dosage decision.
Vancomycin peak and trough concentrations are in agreement with the reported values of paediatric cancer population suggested by Krivoy et al. [17]. While the present value for vancomycin clearance (0.2±0.11 l/h/kg) is higher than the reported value of 0.11±0.14 l/h/kg [17]; this may be due to the higher overall value of vancomycin volume of distribution. In general, vancomycin total body clearance is reported to be markedly elevated in haematologic malignancies compared with normal individuals [17]. Vancomycin Vd was found to be higher than values reported from other studies [10,11]. The increased volume of distribution in our patients may be due to several factors such as aggressive fluid treatments, severe infections and haemodynamic unstable, which are generally found in critically ill patients [18].
The study of Schaad et al. [12] was conducted on neonates, infants and children; in children this study showed that vancomycin ClT was increased with increase in age till reach age of 8 years, then as puberty approaches in children (aged ~12-14 years) vancomycin clearance gradually decreases and approach adult values with no effect on Vd. These results were in agreement with our studied patients’ results but in our study Vd decrease with age increase with no effect on half-life, and this may be due to that the nutritional support and aggressive fluid treatments of our cancer patients are varied from other patient populations or healthy volunteers so, nutritional support and aggressive fluid treatments are very important factors affecting vancomycin volume of distribution.
Peak and trough levels were significantly lower in obese patients when compared with normal and underweight patients; previous studies [10,11] had observed that obese individuals with normal serum creatinine have increased vancomycin clearance secondary to increased glomerular filtration rate.
Sex difference produced no influence on vancomycin drug levels and pharmacokinetics. Similar data was also reported from Ducharme et al. [13], who studied the effect of gender on pharmacokinetics of vancomycin in adults and found that there were no sex-specific effects on the pharmacokinetic profile of vancomycin.
Since vancomycin is eliminated principally by glomerular filtration, renal dysfunction is the most important disease state that influences vancomycin pharmacokinetics [14,15,19]. Many population pharmacokinetic studies of vancomycin found a significant correlation between CrCl and vancomycin elimination rate constant and clearance [14-16]. All these studies had developed an equation used to estimate vancomycin ClT based on CrCl. Moellering et al. [14] studied the relationship between vancomycin elimination rate constant kel and CrCl in adult patients with impaired renal function and revealed the following equation: kel=0.074+(CrClml/min/kg×0.08). Matzke et al. [15] studied the relationship between vancomycin ClT and CrCl in a general population and revealed the following equation: ClTml/min=3.66+(CrClml/min×0.689). Rodvold et al. [16] also studied this relationship in adults with various degrees of renal function and the following equation was obtained: ClTml/min=15.7+(CrClml/min×0.75). The current study results show a significant direct correlation between vancomycin ClT and CrCl (r=0.4933; P<0.01) and vancomycin ClT could be calculated from the creatinine clearance according to the following equation: Vancomycin ClT(l/h/kg)=0.079 (CrCl l/h/kg)+0.159.
Matzke et al. [15] and Rodvold et al. [16] found a significant correlation between CrCl and vancomycin volume of distribution. According to our results, vancomycin volume of distribution Vd was increased significantly with increase in ratio between BUN (mg/dl)/weight (kg). (r=0.2958; P<0.05) and vancomycin Vd could be calculated from patient’s BUN and weight as follows: Vancomycin Vd (l/kg)=0.235 [(BUN)/weight]+0.769. Therapeutic drug monitoring for vancomycin is still important in this population as a result of unpredictable inter-patient variability. It also enables dose individualisation to be made early in therapy.
Acknowledgements
The authors thank all the doctors and nurses at the paediatric ward, laboratory technicians, National Cancer Institute, for their cooperation and help.
References
- Piro CC, Crossno CL, Collier A, Ho R, Koyama T, Frangoul H. Initial vancomycin dosing in pediatric oncology and stem cell transplant patients. J PediatrHematolOncol 2009;31:3-7.
- Hughes WT, Armstrong D, Bodey GP, Bow EJ, Brown AE, Calandra T, et al. 2002 Guidelines for the use of antimicrobial agents in neutropenic patients with cancer. Clin Infect Dis 2002;34:730-51.
- Safarnavadeh T, Rezaee S, Dashti -Khavidaki S, Khalili H, Daneshjoo K, Sadrai S, et al. Steady-state pharmacokinetic analysis of vancomycin in Iranian pediatric patients. Daru 2009;17:124-30.
- Glover ML, Cole E, Wolfsdorf J. Vancomycin dosage requirements among pediatric intensive care unit patients with normal renal function. J Crit Care 2000;15:1-4.
- Lamarre P, Lebel D, Ducharme MP. A population pharmacokinetic model for vancomycin in pediatric patients and its predictive value in a naive population. J Antimicrob Agents Chemother 2000;44:278-82.
- Hing WC, Bek SJ, Lin RT, Li SC. A retrospective drug utilization evaluation of vancomycin usage in paediatric patients. J Clin Pharm Ther 2004;29:359-65.
- Schwartz GJ, Brion LP, Sitzer A. The use of plasma creatinine concentration for estimating glomerular filtration rate in infants, children, and adolescents.PediatrClin North Am 1987;34:571.
- Bauer LA. Vancomycin.In, Bauer LA.Applied clinical pharmacokinetics. 2nd ed. New York: McGraw-Hill; 2008, p. 207-95.
- Hamilton RA, Chow MS. Two-point method for determination of aminoglycoside pharmacokinetics: theoretical and practical considerations. Ther Drug Monit 1986;8:274-8.
- Blouin RA, Bauer LA, Miller DD, Record KE, Griffen WO Jr. Vancomycin pharmacokinetics in normal and morbidly obese subjects. J Antimicrob Agents Chemother 1982;21:575-80.
- Bauer LA, Black DJ, Lill JS. Vancomycin dosing in morbidly obese patients.Eur J ClinPharmacol 1998;54:621-5.
- Schaad UB, McCracken GH Jr, Nelson JD. Clinical pharmacology and efficacy of vancomycin in pediatric patients. J Pediatr 1980;96:119-26.
- Ducharme MP, Slaughter RL, Edwards DJ. Vancomycin pharmacokinetics in a patient population: Effect of age, gender, and body weight. Ther Drug Monit 1994;16:513-8.
- Moellering RC Jr. Antimicrobial susceptibility of enterococci: In vitro studies of the action of antibiotics alone and in combination. In: Bisno AL, editor. Treatment of Infective Endocarditis. New York: Grune and Stratton; 1981. p. 81-96.
- Matzke GR, Kovarik JM, Rybak MJ, Boike SC. Evaluation of the vancomycin-clearance: Creatinine-clearance relationship for predicting vancomycin dosage. Clin Pharm 1985;4:311-5.
- Rodvold KA, Blum RA, Fischer JH, Zokufa HZ, Rotschafer JC, Crossley KB, et al. Vancomycin pharmacokinetics in patients with various degrees of renal function. J Antimicrob Agents Chemother 1988;32:848-52.
- Krivoy N, Peleg S, Postovsky S, Ben Arush MW. Pharmacokinetic analysis of vancomycin in steady state in pediatric cancer patients. J PediatrHematolOncol 1998;15:333-8.
- Girbes AR, Groeneveld AB. Circulatory optimization of the patient with or at risk for shock. Clin Intensive Care 2000;11:77-88.
- Matzke GR, McGory RW, Halstenson CE, Keane WF. Pharmacokinetics of vancomycin in patients with various degrees of renal function. J Antimicrob Agents Chemother 1984;25:433-7.