- Corresponding Author:
- P. S. Jain
Department of Pharmaceutical Chemistry, R. C. Patel Institute of Pharmaceutical Education and Research, Shirpur-425 405, India
E-mail: pritash79@yahoo.com
| Date of Submission | June 14, 2011 |
| Date of Revision | March 14, 2012 |
| Date of Acceptance | March 20, 2012 |
| Indian J Pharm Sci, 2012, 74 (2): 168-171 |
Abstract
A derivative UV spectrophotometric and a reversed phase high-performance liquid chromatographic method for the determination of ciprofibrate in tablets was developed. The first-order derivative UV spectrophotometric method was found to be accurate with 100.57±0.97 recovery and precise with a coefficient of variation of 1.44. These results were compared to those obtained by reference methods, zero-order UV spectrophotometric method and a reversed-phase high-performance liquid chromatography method. A reversed-phase C 8 column with methanol:water (90:10, v/v, pH 3.7) mobile phase was used and the detector wavelength was set at 232 nm. Calibration solutions used in HPLC were ranging from 2 to 12 μg/ml. An ANOVA test (P = 0.0226, F = 4.935) showed that the results obtained with the derivative UV spectrophotometric method were comparable to those obtained using reference methods.
Keywords
Ciprofibrate, content determination, derivative UV spectrophotometry, reversed phase high-performance liquid chromatographic
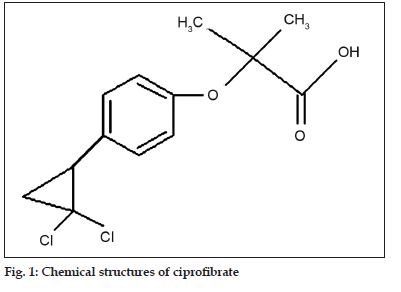
Ciprofibrate, 2?(4?(2,2?dichlorocyclpropyl)phenoxy)? 2?methylpropanoic acid (fig. 1), a PPARα activator, is used to treat hyperlipidaemia and was found to be beneficial in the prevention of ischemic heart disease in individuals with elevated levels of LDL cholesterol. In addition ciprofibrate is also found to modestly decrease elevated fibrinogen and plasminogen activator inhibitor?1 levels and elevate level of plasma HDL cholesterol [1?4].
Various methods have been reported for the analysis of ciprofibrate in bulk and in pharmaceutical formulations; examples of which being. A HPLC method with different column materials and mobile phase systems [5]; determination of benzafibrate, ciprofibrate and fenofibric acid in human plasma using HPLC [6]; enantiomeric resolution of ciprofibrate and related compounds by HPLC using chiral stationary phase [7]; achiral and chiral determination of ciprofibrate and its glucuronide in human urine using capillary electrophoresis [8]; and determination of benzafibrate and ciprofibrate employing densitometric and video?densitometric TLC [9].
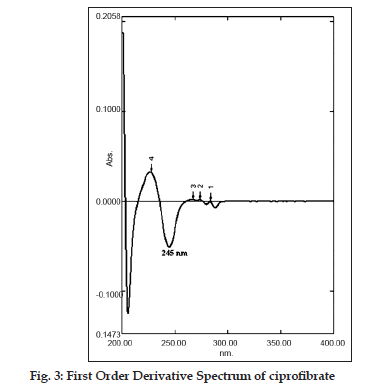
In this communication, a first?order derivative UV spectrophotometric method at 245 nm is being reported for the determination of ciprofibrate in tablets. No spectrophotometric methods for the determination of ciprofibrate in tablets have been reported. For this reason, a derivative UV spectrophotometric method was developed which could be used in routine analysis of ciprofibrate. Furthermore, quantitative determination of ciprofibrate in tablets was also performed using a RP?HPLC method and a zero?order spectrophotometric method (as reference methods) and the results obtained by the proposed method were compared to those obtained using the reference methods.
Spectroscopic analysis was performed on a Shimadzu 2450 (PC Series) UV/Vis double beam spectrophotometer (Software UV Probe 2.21) with a pair of 10 mm matched quartz cells, which were used to measure absorbance of resulting solutions. UV spectra of the reference and the test solutions were recorded at wavelengths with in 200?400 nm range. The first?order derivative spectra were also obtained over the 200?400 nm range (n=5). Spectral bandwidth used was 2 nm, and scan speed was set to 480 nm/ min (slow?mode).
All reagents used in this investigation were of analytical grade. Pharmaceutical grade ciprofibrate was obtained from Glenmark Pharmaceuticals Ltd., Mumbai, India. For the preparation of standard ciprofibrate stock solution, 10 mg ciprofibrate was accurately weighed and dissolved in methanol in a 100 ml volumetric flask and volume was made up with distilled water. Standard solutions in the range 3?18 µg/ml were prepared by appropriate dilution of the stock solution.
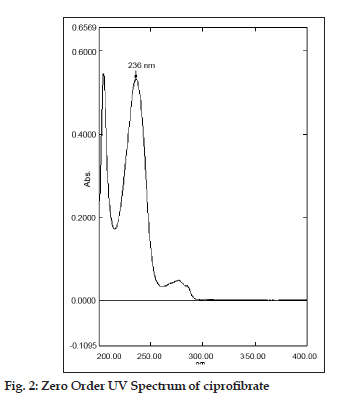
Twenty tablets of ciprofibrate were accurately weighted and powered and a quantity equivalent to 100 mg of ciprofibrate was transferred to a 100 ml volumetric flask, 50 ml of methanol was added and sonicated for 20 min. The resulting solution was filtered through a Whatmann filter paper no. 41 and the residue was washed thoroughly with methanol. The filtrate and the washings were combined in a 100 ml volumetric flask and diluted to the mark with methanol. Ciprofibrate content of the tablets was calculated by referring to calibration curves obtained using standard solutions of ciprofibrate in the concentration range of 3 to 18 µg/ml for both zero?order at 236 nm and for the first?order derivative method at 245 nm (n=5).
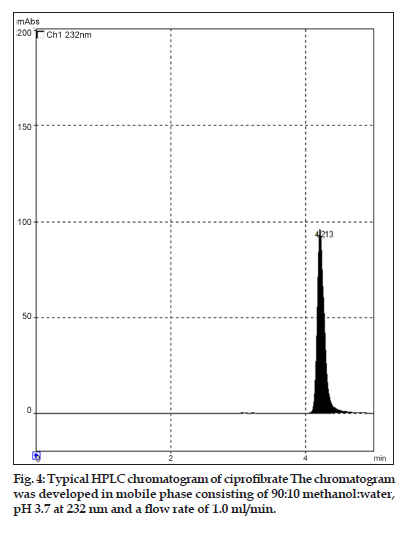
Ciprofibrate analysis was also performed on a HPLC system of Shimadzu (Japan) comprising of a LC?10AT vp solvent delivery system (pump), SPD M?10 A vp Diode array detector, CTO?10AS vp as a column oven and a Rheodyne injector with 20 µl loop. Class?M 10A data station was used as a data processor. Chromatographic separation was carried out on a Qualisil C8 (5 μm, 25×4.6 mm i.d.). Prior to chromatography, the mobile phase was filtered using a 0.45 µm membrane filter and degassed by ultrasonic vibrations. All experiments were carried out at 30o and the flow rate of the mobile phase used was 1.0 ml/min. Sample injection volume used was 20 µl. All determinations were performed at 232 nm.
The mobile phase used was 90:10 (v/v) methanol:water at pH 3.7 adjusted with orthophosphoric acid. After mixing, the mobile phase was degassed and filtered. In order to prepare ciprofibrate stock solution, 10 mg ciprofibrate was accurately weighed, dissolved and diluted to 10 ml with the mobile phase. Standard solutions ranging from 2 to 12 µg/ml were prepared in the mobile phase. All solutions were prepared with doubled distilled water. All reagent used were of HPLC grade (Merck Pvt. Ltd., India).
Twenty tablets of ciprofibrate were accurately weighted and powered and the quantity equivalent to 100 mg of ciprofibrate was transferred to a 100 ml volumetric flask, 50 ml mobile phase was added and sonicated for 20 min. The solution was filtered through a Whatmann filter paper No. 41, the residue was washed thoroughly with the mobile phase; the filtrate and the washings were combined in a 100 ml volumetric flask and the volume was made up with the mobile phase. An Aliquot of this solution was diluted in the mobile phase to get the final concentration. Ciprofibrate standard solutions were injected and a calibration curve was obtained as peak area versus concentration. Tablet solution (20 µl) was injected, detection was carried out at 232 nm and the amount of ciprofibrate in tablet was calculated.
In this study, quantitative determination of ciprofibrate in tablets was performed by first?order derivative UV spectrophotometric method and the results were compared to those obtained using two reference methods, a HPLC and a zero?order UV spectrophotometric method. Derivative UV spectrophotometric method developed was to investigate if it is applicable in routine analysis. It was found to be simple, rapid and sensitive. Zero?order and first?order derivative spectra of ciprofibrate were shown in figs. 2 and 3, respectively. Regression analysis for the first?order derivative UV spectrophotometric method was carried out (Table 1) and the correlation coefficient (r2 0.999) obtained confirmed linearity and adherence to Beer’s law over the concentration range of 3?18 µg/ml. Quantitative analysis of ciprofibrate in tablets was performed using this derivative UV spectrophotometric method and the results obtained showed a good agreement with the labeled amount of ciprofibrate (Table 2). In addition, the coefficient of variation (CV) for the determination of ciprofibrate was 1.60. Closeness of the amount found to the amount taken and the low coefficient of variation value showed that the proposed method was accurate and precise. A recovery study was performed by spiking 80,100 and 120 µg/ml and the % recovery values ranged from 99.30?102.84 (Table 3). A % RSD of less than 2 indicated that this method is highly precise (Table 4). High Recovery values, low % RSD and low standard deviations established the suitability of the proposed method for accurate and precise determination of ciprofibrate in tablets. Ciprofibrate was also analysed using a modified reversed?phase high?performance liquid chromatographic method. Typical chromatogram obtained for standard ciprofibrate is shown in fig. 4. Ciprofibrate gave a well?shaped, symmetrical single peak that was well separated from the solvent front indicating no additional extractions or separations were required. High correlation coefficient value (Table 1) and low standard deviation (Table 2) proved that HPLC method was precise and accurate. In addition, relatively high recovery value, 99.58?99.68% (Table 3), was obtained. Furthermore, the results obtained with HPLC were in good agreement with those obtained using the first order derivative UV spectrophotometric method. Finally, results obtained using all three methods for the determination of ciprofibrate in tablets were subjected to ANOVA test (Table 5) which indicated that there were no significant differences between results.
| Method | Analytical wavelength (nm) | Linearity range (µg/ml) | Regression equation | Correlation coefficient (r2) |
|---|---|---|---|---|
| Zero order* | 236 | 3-18 | y=0.051C+0.039 | 0.999 |
| First order* | 245 | 3-18 | y=0.004 C+0.001 | 0.999 |
| RP-HPLC* | 232 | 2-12 | y=56747 C+151566 | 0.998 |
Table 1: Statistical Analysis Of The Calibration Curve Of Ciprofibrate.
| Method | Amount taken (µg/ml) | Amount found (µg/ml) | % Amount found* | SD | CV |
|---|---|---|---|---|---|
| Zero ordera | 9 | 9.13 | 101.48 | 1.56 | 1.54 |
| First ordera | 9 | 8.98 | 99.82 | 1.60 | 1.60 |
| RP-HPLCa | 9 | 8.91 | 99.06 | 0.69 | 0.70 |
Table 2: Determination Of Ciprofibrate In Tablets
| Method | Amounttaken(µg/ml) | Amountadded(µg/ml) | Amountrecovered(µg/ml) | % Recovery | SD |
|---|---|---|---|---|---|
| Zero ordera | 9 | 80 | 7.2 | 99.30 | 0.78 |
| 100 | 9 | 99.66 | 0.49 | ||
| 120 | 10.2 | 102.84 | 1.66 | ||
| First ordera | 9 | 80 | 7.2 | 7.26 | 100.83 |
| 100 | 9 | 9.19 | 102.11 | ||
| 120 | 10.2 | 10.32 | 101.17 | ||
| RP-HPLCa | 6 | 4.8 | 4.78 | 99.58 | 1.89 |
| 6 | 5.98 | 99.66 | 1.32 | ||
| 7.2 | 7.17 | 99.58 | 1.12 |
Table 3: Recovery Analysis Of Ciprofibrate In Tablets
| Drug | Conc.(µg/ml) | Intraday amount | Interday amount | ||
| found* (µg/ml) | found* (µg/ml) | ||||
| Mean±SD | %RSD | Mean±SD | %RSD | ||
| CPF | 9 | 99.16±0.0006 | 1.69 | 100.63±0.0006 | 1.61 |
| 12 | 103.83±0.0008 | 1.20 | 109.88±0.0009 | 1.84 | |
| 15 | 102.11±0.0007 | 1.09 | 101.80±0.00056 | 0.89 | |
| CPF | 4 | 4.19±0.029 | 0.69 | 4.13±0.064 | 1.56 |
| 6 | 5.91±0.039 | 0.65 | 6.03±0.072 | 1.20 | |
| 8 | 8.34±0.043 | 0.52 | 8.35±0.024 | 0.29 | |
Table 4: Precision Studies (Intra-Day And Inter-Day) For Derivative Spectroscopy And Rp-Hplc
Thus a simple, sensitive and reproducible derivative UV spectrophotometric method for quantitative determination of ciprofibrate was developed and this method is suitable for the determination of ciprofibrate in tablets and could be used in a quality control laboratory for routine sample analysis. It can be concluded that the proposed first?order derivative UV spectrophotometric and HPLC method is suitable for the analysis of ciprofibrate in commercial tablets.
Acknowledgements
We thank the Principal, R. C. Patel Institute of Pharmaceutical Education and Research, Shirpur for providing the facilities to carry out the research work.
References
- Sweetman SC. Martindale The Complete Drug Reference. 35th ed. London: The Pharmaceutical Press; 2000. p. 1118-9.
- Budavari S, editors. The Merck Index. 14th ed. Whitehouse Station, NJ, USA: Merck and Co., Inc.; 1996. p. 386.
- Robert WM, Bersot TP. Drug Therapy for Hypercholesterolemia and Dyslipidemia. In: Hardman JG, Limbird LE, Gilman AG, editors. Goodman and Gilman’s The Pharmacological Basis of Therapeutics. 10th ed. New York: McGraw-Hill Professional; 2001. p. 971-1002.
- British Pharmacopoeia. (AI), London: The Stationary Office Medicinal and Pharmaceutical Substances; 2005. p. 483-4.
- Luhua F, Xingming Y, Juan Y. Determination of contents of ciprofibrate and its related substances by HPLC. China Pharm 2006;5:1-4.
- Masnatta LD, Cuniberti LA, Rey RH, Werba JP. Determination of bezafibrate, ciprofibrate and fenofibric acid in human plasma by high-performance liquid chromatography. J Chromatogr B 1996;687:437-42.
- Anderson NH, Johnston D, Vojvodic PR. The enantiomeric resolution of ciprofibrate and related compounds by HPLC using chiral stationary phases. J Pharm Biomed Anal 1992;10:501-5.
- Huttemann H, Blaschke G. Achiral and chiral determination of ciprofibrate and its glucuronide in human urine by capillary electrophoresis. J Chromatogr B 1999;729:33-41.
- Misztal G, Komsta L. Determination of bezafibrate and ciprofibrate in pharmaceutical formulations by densitometric and videodensitometric TLC. J Planar Chromatogr2005;18:188-93.


