- *Corresponding Author:
- Lata Kothapalli
Department of Pharmaceutical Chemistry, Dr. D. Y. Patil Institute of Pharmaceutical Sciences and Research, Pimpri, Pune - 411 018, India
E-mail: hemanthip@yahoo.co.in
| Date of Submission | 16 May 2006 |
| Date of Revision | 9 April 2007 |
| Date of Acceptance | 14 October 2007 |
| Indian J Pharm Sci 2007, 69 (5): 695-697 |
Abstract
A rapid, precise, economical and accurate HPLC method for estimation of ezetimibe in bulk and pharmaceutical formulations has been developed. The chromatographic resolution of ezetimibe was achieved using acetonitrile:0.02 M potassium dihydrogen orthophosphate buffer (72:28 v/v) as the mobile phase with UV detection at 232 nm and C8 kromasil 5 μ column. The flow rate was 1 ml/min. Results of the analysis were validated statistically and by recovery studies and were found to be satisfactory.
Keywords
Ezetimibe, RPHPLC
Ezetimibe belongs to one of the new class of lipidlowering agents known as cholesterol absorption inhibitors that selectively inhibits the intestinal absorption of cholesterol and related phytosterols. Chemically ezetimibe is 1-(4-fluorophenyl)-3(R)- [3-(4-fluorophenyl)-3(S)-hydroxypropyl]-4(S)-(4- hydroxyphenyl)-2-azetidinone [1].
It is clinically useful in the treatment of primary hypercholesterolemia monotherapy, homozygous familial hypercholesterolemia and homozygous sitosterolemia [2,3]. It is not official in any of the pharmacopoeias. It is listed in The Merck Index, and Martindale, The Complete Drug Reference [4,5]. The literature survey revealed only one RP-HPLC method reported for the determination of ezetimibe in pharmaceutical dosage forms using C18 column [6]. In this present study an attempt was made to develop an alternative rapid and economical RP-HPLC [7] method for estimation of ezetimibe in bulk and pharmaceutical formulations with better sensitivity, precision and accuracy using C [8] column and UV detector.
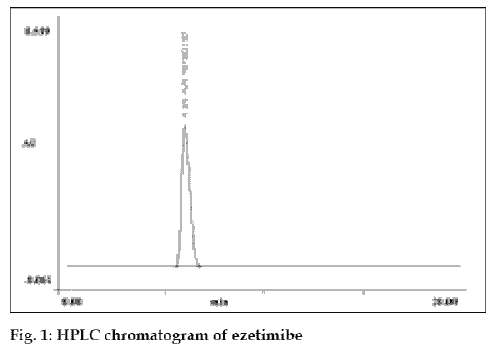
A Merck Hitachi Lachrom HPLC system with L- 7400 UV detector having scanning range of 190 to 660 nm and L-7100 pump was used. Ezetimibe was obtained from Hetero Labs Limited, Hyderabad as a gift sample. Tablets of 10 mg strength were procured from local pharmacy of two commercial brands. Acetonitrile, water and potassium dihydrogen orthophosphate buffer used were of HPLC grade and procured from Qualigens Fine Chemicals, Mumbai. Chromatographic variables were optimized to achieve precise and reproducible retention (Table 1). The mobile phase consisting of acetonitrile:0.02 m potassium dihydrogen orthophosphate buffer in the ratio 72:28 v/v was selected. 10 mg of the drug was weighed accurately and dissolved in 100 ml of mobile phase to give standard stock solution of concentration 100 µg/ml. The mobile phase and standard stock solution were filtered through 0.45 µ and 0.2 µ membrane filters, respectively. Various dilutions of ezetimibe in the concentration of 10, 15, 20, 25, 30, 35, 40 and 45 µg/ml were prepared. The dilution were injected through rheodyne injector with twenty microlitres sample loop into the chromatographic system at flow rate 1 ml/min. Ezetimibe was eluted at 4.24 min as shown in fig. 1. The calibration curve of the peak area Vs concentration of ezetimibe was found to be linear and in adherence to Beer-Lambert’s law over the concentration range of 10-45 µg/ml. The optical parameters are given in Table 2.
| Parameters | Optimized condition |
|---|---|
| Mobile phase | Acetonitrile:0.02 M Potassium dihydrogen orthophosphate buffer (72:28 v/v) |
| Column | Kromasil C8 (5µ) |
| Flow rate | 1 ml/min |
| Detection | 232 nm in UV detector |
| Injection volume | 20 µl |
| Temperature | Ambient |
| Retention time | 4.24 min |
| Run time | 10 min |
Table 1: Optimized chromatographic Conditions
| Parameter | Ezetimibe |
|---|---|
| Linearity range (μg/ml) | 10-45 |
| Slope | 675255 ± 243.796 |
| Intercept | -536939 ± 8465.044 |
| Correlation coefficient | 0.9996 |
| Limit of detection (μg/ml) | 0.0413 |
| Limit of quantitation (μg/ml) | 0.1253 |
| Retention time (min) | 4.24 ± 0.01155 |
| Robustness | Robust |
| Precision (% RSD) | |
| Inter-day (n=3) | 0.7727 |
| Intra day (n=3) | 0.7794 |
| Tailing factor | 0.65 ± 0.0075 |
| Theoretical Plates | 179776 |
| Mean % recovery | 99.66 ± 0.606 |
Table 2: Validation and system suitability Studies
For the estimation of ezetimibe in tablet formulation, twenty tablets of both brands T1, Ezedoc (Lupin) and T2, Filet (Emcure) were weighed and triturated to fine powder. Tablet powder equivalent to 10 mg of ezetimibe was weighed and dissolved in 100 ml mobile phase for each brand separately. It was kept for ultrasonication for 45 min. This was then filtered through Whatman filter paper No. 41 and 0.2 µ membranes filter to get stock solution of concentration of 100 µg/ml. From these stock solutions various dilutions were made with the mobile phase to get final sample solution of different concentrations, which were analyzed. The concentration of the drugin tablet sample solution was calculated by comparing peak area of standard chromatogram of ezetimibe. The results of the assay procedure are given in Table 3.
| Tablet formulation | Label claim (mg) | Amount found (mg)* | %* | SD* | COV* | SE* |
|---|---|---|---|---|---|---|
| T1 | 10 | 9.971 | 99.71 | 0.7072 | 0.7093 | 0.2887 |
| T2 | 10 | 10.050 | 100.05 | 0.4566 | 0.4543 | 0.1864 |
Table 3: Estimation of Ezetimibe In Tablet Formulation
Recovery studies were carried out at three different levels i.e. 80%, 100% and 120% by adding the pure drug to previously analyzed sample as per ICH guidelines [8,9], From the amount of drug found, percentage recovery was calculated (Table 2), which was found to be satisfactory. Repeatability of measurement of the peak area was done to confirm the interday, intraday precision of the method (Table 2). Robustness of the method was studied by introducing small deliberate changes in the flow rate, composition of mobile phase and temperature. The variation in flow rate done was 1±0.1 ml/min and percentage of acetonitrile in mobile phase 72±2% and temperature was altered 25±1°. With the change in flow rate the RT was found to be 4.24±0.155 and tailing factor was 0.65±0.0153. Variation done in the mobile phase gave RT of 4.24±0.185 and tailing factor was 0.65±0.04 similarly alteration in the temperature gave RT of 4.25±0.015 and tailing factor 0.65±0.04.this values indicate the method is robust.
The results of tablet analysis and recovery studies obtained by the proposed method were validated by statistical evaluation (Table 3). The percentage coefficient of variation was found to be 0.7093 for tablet formulation T1 and 0.4543 for tablet formulation T2, respectively. The low percentage coefficient of variation value indicating the suitability of this method for routine analysis of ezetimibe in pharmaceutical formulation dosage forms. The results of recovery studies showed percentage recovery to be 99.66±0.0606 with the percentage coefficient of variation less than 2% indicating high degree of accuracy and precision of the method. (Table 3)
Acknowledgements
We are deeply indebted to Hetero Labs Limited, Hyderabad for providing us the gift sample of the pure drug and to Principal, Dr. D. Y. Patil Institute of pharmaceutical Sciences and Research, Pimpri, Pune.
References
- Rosenblum SB, Huynh T. Afonso A, Davis HRJr, Yumibe N, Clader JW, Burnett DA. A designed, potent, orally active inhibitors of cholesterol absorption. J Med Chem 1998;41:973-80.
- Heek MV. In Vivo metabolism-based discovery of a potent cholesterol absorption inhibitor. J Pharmacol Exp Ther 1997;283:157.
- Dujovne A. Efficacy and safety of a potent new selective cholesterol absorption inhibitor, ezetimibe, in patients with primary hypercholesterolemia. J Cardiol 2002;90:1092-7.
- Budavari S, editor. The Merck Index, 13th ed. Merck and Co., Inc: Whitehouse Station, NJ; 2001. p. 693.
- Sweetman SC, editor. In ; Martindale, The Complete Drug Reference, 34th ed. The Pharmaceutical Press: London; 2002. p. 914.
- Sistla R. Tata VS, Kashyap YV, Chandrasekar D, Diwan PV. Development and validation of reversed-phase HPLC method for the determination of Ezetimibe in pharmaceutical dosage forms. J Pharm Biomed Anal 2005;39:517-22.
- Sethi PD. In ; HPLC high performance liquid chromatography, quantitative analysis of pharmaceutical formulations, 1st ed. CBS Publishers and Distributors: New Delhi; 2001. p. 116-20.
- International Conference on Harmonisation, ICH Harmonised Tripartite Guideline-Text on Validation of Analytical Procedures. Fed Regist 1995;60:11260.
- International Conference on Harmonisation, ICH Harmonised Tripartite Guideline-Validation of Analytical Procedures: Methodology. Fed Regist 1997;62:27463


