- *Corresponding Author:
- S. S. Shelake
Department of Pharmaceutics, Ashokrao Mane College of Pharmacy, Peth-Vadgaon-416 112, India
E-mail: sardarshelake289@gmail.com
| Date of Submission | 29 December 2016 |
| Date of Revision | 29 July 2017 |
| Date of Acceptance | 10 March 2018 |
| Indian J Pharm Sci 2018;80(3): 420-427 |
This is an open access article distributed under the terms of the Creative Commons Attribution-NonCommercial-ShareAlike 3.0 License, which allows others to remix, tweak, and build upon the work non-commercially, as long as the author is credited and the new creations are licensed under the identical terms
Abstract
Nanoparticles have applications in the formulation of poorly water soluble drugs to improve their bioavailability. Preparation and evaluation fenofibrate-loaded nanoparticles by precipitation method to enhance solubility and bioavailability was the primary aim of the present investigation. Nano particles of fenofibrate, a BCS class II drug, were prepared by precipitation technique and characterized using Fourier-transform infrared spectroscopy, differential scanning calorimetry, powder X-ray diffraction, scanning electron microscopy, zeta potential and drug release studies in vitro. Data from the differential scanning calorimetry, powder X-ray diffractometry and Fourier transform infra-red spectroscopy showed no interaction between drug and the polymers. Scanning electron microscopy images indicated that nanoparticles were spherical in shape. Water solubility of drug-loaded nanoparticles was increased as compared to the pure drug and showed improved dissolution profile, which indicated that nanoprecipitation was simple and precise. This laboratory scale method as well as this approach could be employed for solubility and bioavailability improvement of BCS class II drugs.
Keywords
Fenofibrate, BCS class II drug, antilipidemic, nanoprecipitation, bioavailability
The major nanoparticulate drug delivery system is liposomes and polymeric nanoparticles have particular advantage for site-specific drug delivery and to enhance the dissolution rate along with bioavailability of poorly water soluble drugs [1]. Formation of drug-loaded nanoparticles is actually a very promising approach. Particle size reduction to the nanometre range can be achieved using various techniques and these techniques have been extensively described [2]. Poor solubility and low dissolution rate of Biopharmaceutical Classification System (BCS) class II drugs in the aqueous gastrointestinal fluids often causes insufficient bioavailability and this can only be enhanced by increasing the solubility and dissolution rate by using various novel techniques [3]. Some of the techniques employed to improve drug dissolution rate are solid dispersion, inclusion complex formation, microparticles and nanoparticles.
Nanoparticles are colloidal particles ranging from 10 to 1000 nm, in which the active principles (drug or biologically active material) are dissolved, entrapped [4]. And these are of different types include, nanospheres, nanocapsules, dendrimers, solid-lipid nanoparticle, polymeric micelles and liposomes. With the development in nanotechnology, it is now possible to produce drug nanoparticles that can be utilized in a variety of innovative ways. New drug delivery pathways can now be used to increase drug efficacy and reduce side effects [5]. Solid-lipid nanoparticles are at the rapidly developing field of nanotechnology with several potential applications in the clinical medicine and research. Nanoparticles are receiving considerable attention for the delivery of therapeutic drugs. Depending on the physicochemical characteristics of a drug, it is now possible to choose the best method of preparation with the best polymer to achieve an efficient entrapment of the drug [6]. Different methods for the preparation of nanoparticles are available, which include, solvent evaporation, nanoprecipitation, emulsification/solvent diffusion, salting out, dialysis, supercritical fluid technology and rapid expansion of supercritical solution, rapid expansion of supercritical solution into liquid solvent.
The Nanoprecipitation technique (or solvent displacement method) is a straightforward technique, rapid and easy to perform. It involves the precipitation of a preformed polymer from an organic solution and the diffusion of the organic solvent in an aqueous medium in presence or absence of a surfactant. It requires two solvents that are miscible with water. Ideally, both, the polymer and the drug should be soluble in one solvent and insoluble in another (non-solvent). Nanoprecipitation occurs by a rapid desolvation of the polymer when the polymer solution is added to the non-solvent (aqueous solution). Indeed, as soon as the polymer-containing organic solvent has diffused into the aqueous medium, the polymer precipitates, involving immediate drug entrapment. Polymer deposition on the interface between the water and the organic solvent, caused by fast diffusion of the solvent, leads to the instantaneous formation of a colloidal suspension. This technique is most suitable for hydrophobic compounds soluble in ethanol or acetone, but has very limited solubility in water.
Fenofibrate is an antilipidemic agent, which reduces both cholesterol and triglycerides in the blood. It is used alone or along with statins in the treatment of hypercholesterolemia and hypertriglyceridemia [7]. Present work deals with the preparation and evaluation of fenofibrate-loaded nanoparticles by precipitation method.
Materials and Methods
Fenofibrate was received as a gift sample from Smruthi Organics Pvt. Ltd. (Solapur, India), Eudragit L-100 was purchased from Research Lab Chemical Centre, (Mumbai, India), poly vinyl alcohol, methanol and acetone were purchased from Molychem, (Mumbai, India). All other materials or chemicals used were of analytical grade.
Preformulation study
Preformulation is the first step in rationale development of any pharmaceutical dosage form of a new drug. Preformulation study focuses on those physicochemical properties of the new compound that can affect drug performance and development of an efficacious dosage form. These preformulation investigations confirm that there are no significant barriers to the compounds development. Melting point of fenofibrate was determined by open capillary tube method.
Drug excipients compatibility study was carried out by Fourier-transform infrared spectroscopy (FTIR, Agilent Technologies, carry 630 FTIR). The sample was analysed in the region of 4000 and 400 cm-1. The initial spectrum of drug and polymer mixture was taken then the same mixture of drug and polymer were kept in a stability chamber at 40° and 75 % relative humidity for 3 mo. After three months, sample mixtures were analysed by FTIR spectroscopy. The compatibility study was done by comparing initial spectra and the spectra of samples after 3 mo.
Method of preparation
The nanoparticles of fenofibrate were prepared by nanoprecipitation technique using the different polymer concentrations by applying a 33 factorial design as given in Table 1. Eudragit L100 was dissolved in methanol and drug in acetone separately. These two solutions were mixed and added drop-wise under stirring at 700 rpm for 120 min in aqueous solution with poly vinyl alcohol as a surfactant. After complete removal of organic solvent, it was centrifuged at 13 000 rpm and settled nanoparticles were collected and dried at 40° for 1 h [8].
| Formulation code |
Independent variables | ||
|---|---|---|---|
| X1 (Drug:polymer) |
X2 (Conc. of surfactant) |
X3 (Ratio of organic solvent) |
|
| F1 | 1:4 | 0.5 % | 1:3 |
| F2 | 1:5 | 0.5 % | 1:3 |
| F3 | 1:6 | 0.5 % | 1:3 |
| F4 | 1:4 | 1.0 % | 1:3 |
| F5 | 1:5 | 1.0 % | 1:3 |
| F6 | 1:6 | 1. 0 % | 1:3 |
| F7 | 1:4 | 1.5 % | 1:3 |
| F8 | 1:5 | 1.5 % | 1:3 |
| F9 | 1:6 | 1.5 % | 1:3 |
| F10 | 1:4 | 0.5 % | 1:4 |
| F11 | 1:5 | 0.5 % | 1:4 |
| F12 | 1:6 | 0.5 % | 1:4 |
| F13 | 1:4 | 1.0 % | 1:4 |
| F14 | 1:5 | 1.0 % | 1:4 |
| F15 | 1:6 | 1.0 % | 1:4 |
| F16 | 1:4 | 1.5 % | 1:4 |
| F17 | 1:5 | 1.5 % | 1:4 |
| F18 | 1:6 | 1.5 % | 1:4 |
| F19 | 1:4 | 0.5 % | 1:5 |
| F20 | 1:5 | 0.5 % | 1:5 |
| F21 | 1:6 | 0.5 % | 1:5 |
| F22 | 1:4 | 1.0 % | 1:5 |
| F23 | 1:5 | 1.0 % | 1:5 |
| F24 | 1:6 | 1.0 % | 1:5 |
| F25 | 1:4 | 1.5 % | 1:5 |
| F26 | 1:5 | 1.5 % | 1:5 |
| F27 | 1:6 | 1.5 % | 1:5 |
Table 1: Experimental Design for Preparation of Nanoparticles
Characterization of nanoparticles
Organoleptic properties of the nanoparticles like colour, odour and physical appearance were observed visually and recorded. Practical yield was calculated using the Eqn., PY (%) = amount of product obtained/ amount of total solid used (polymer+drug)×100.
Percent drug loading and entrapment efficiency (EE)
Weighed samples of drug-loaded nanoparticles (10 mg) were dissolved in 10 ml of dichloromethane under sonication for 1 h. The samples were filtered through a membrane filter and analysed spectrophotometrically at 248 nm using a UV/Vis spectrophotometer (Shimadzu 1800). The percent drug loading and EE were determined using the below Eqns. All analyses were carried out in triplicate [9]. % drug loading = mass of drug in nanoparticles/mass of nanoparticles recovered×100; % EE = mass of drug in nanoparticles/ mass of drug used in preparation×100.
Particle size analysis
Determination of mean average particle size of fenofibrate nanoparticles was carried out by using Malvern instrument ver. 6.12. The analysis was performed by adding 0.3 ml sample into the viewing unit dynamic light scattering is used to measure particle size and molecule size. The particle size analysis was performed at a scattering angle of 90° at room temperature. The diameter was averaged from three parallel measurements and expressed as mean ± standard deviation. This technique measures the diffusion of particles moving under Brownian motion, and converts it to size and a size distribution [10].
Zeta potential measurement
The analysis was performed by using the Malvern Zetasizer ver. 6.12 (Malvern instrument, UK) the electrophoretic mobility was converted to the zeta potential. To determine the zeta potential, nanoparticle samples were diluted with KCl (0.1 mM) and placed in electrophoretic cell where an electrical field of 15.2 V/cm was applied. All measurement was performed in triplicate [11].
Solubility determination
Solubility of pure drug and all batches of nanoparticles in distilled water were obtained by adding an excess amount of the pure drug and nanoparticles in 10 ml of distilled water in conical flask to saturated solution. This conical flask was kept on orbital shaker for 24 h to ensure saturation. After attaining the equilibrium solubility, clear supernatant was filtered, appropriately diluted and analysed spectrophotometrically by UV/Vis spectrophotometer at 248 nm [12].
Scanning electron microscopy (SEM)
Nanoparticles were coated with a thin gold-palladium layer by sputter coater unit (VG- Microtech, United Kingdom) and the surface topography was analysed with a Cambridge Stereoscan S120 SEM (Cambridge, United Kingdom) operated at an acceleration voltage of 10 kV.
Powder X-ray diffraction analysis (PXRD)
PXRD of pure drug and optimized batch of nanoparticles were analysed by Philips PW 1729 X-ray diffractometer. Samples were irradiated with monochromatized Cu Kα-radiations (1.542 A°) and analysed between 2-60° (2θ). The voltage and current used were 30 kV and 30 mA, respectively. The range was 5×10³ cycles/s and the chart speed was kept at 100 mm/2θ.
Differential scanning calorimeter (DSC) analysis
Thermal properties of pure drug and optimized batch of nanoparticles were analysed by DSC (TA Instruments, USA, model: SDT 2960). Indium standard was used to calibrate the DSC temperature and enthalpy scale. Nitrogen was used as the purge gas through DSC cell at flow rate of 50 ml per min and 100 ml per min through the cooling unit. The sample (5-10 mg) was heated in a hermetically sealed aluminium pans. Heat runs for each sample were set from 0 to 300° at a heating rate of 10°/min.
In vitro drug release studies
Nanoparticle samples were placed in dialysis bags, which were sealed and placed in dissolution medium (phosphate buffer pH 6.8 with 1 % sodium lauryl sulphate). Drug release study was carried out employing the USP dissolution test apparatus, type II at 37 ± 0.5° and 100 rpm for 2 h. At each time interval 5 ml of sample was collected and replaced with fresh buffers. The collected samples were filtered by Whatman filter paper 41 and analysed spectrophotometrically after the appropriate dilutions [13].
Factorial design/statistical analysis
Experimental design with coded level of variables and their actual values are illustrated as the effects of the different concentrations of drug and polymer ratio (X1), concentration of surfactant (X2) and ratio of organic solvents (X3) on the responses such as practical yield (Y1), EE (Y2) and particle size (Y3).
Results and Discussion
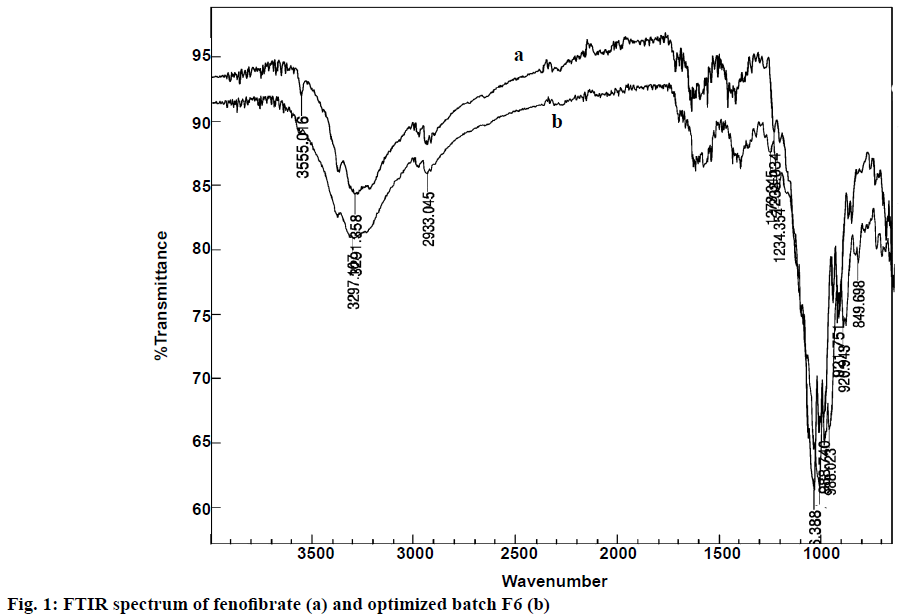
After visual observation, the sample of fenofibrate was found to be a white and crystalline powder. The reported melting point of fenofibrate is in the range of 80 to 82° and the observed melting point was 81°, which confirmed purity of the drug. The FTIR spectra of the drug and drug with excipients were shown in Figure 1. The initial FTIR spectrum of the drug polymer mixture (1:1) showed the presence of similar functional groups as O-H stretching, C=O of COOH stretching, C=O conjugated with COOH stretching, single bond stretching of alcoholic and acidic group at 2941, 1721, 1669, 1397 cm-1, respectively, confirmed the compatibility of drug with the excipients. After 3 mo, FTIR spectra of the drug polymer mixture showed same fundamental peaks at same peak position, indicated that there is no any incompatibility between drug and polymers. The nanoparticles were found to be white, odourless and amorphous powder.
Practical yield, drug loading and EE were given in Table 2. Practical yield of the prepared nanoparticles was in the range of 49.00 ± 0.70 to 68.57 ± 1.00 %. The yield of nanoparticles decreased with increasing the concentration of drug and polymer ratio, which might be due to generation of stickiness by polymer Eudragit L-100. It was found that with increasing the amount of polymer, the actual drug loading and EE increased. The EE was found to be in the range from 59.29 ± 1.29 to 92.43 ± 1.44 %. The drug loading of nanoparticles was found to be in the range of 22.00 ± 1.31 to 26.95 ± 1.24 %. It was observed that the drug content and encapsulation efficiency depends on the concentration of polymer, solvent ratio and stirring rate. On the basis of high yield, actual drug content and encapsulation efficiency batch F6 was observed as optimized batch for the preparation of nanoparticles [14,15].
| Batch code |
Practical yield (%) |
Drug loading (%) | Entrapment efficiency (%) | Batch code |
Practical yield (%) |
Drug loading (%) | Entrapment efficiency (%) |
|---|---|---|---|---|---|---|---|
| F1 | 49.00 ± 0.80 | 25.89 ± 1.2 | 63.45 ± 1.22 | F15 | 65.00 ± 0.87 | 25.80 ± 1.34 | 83.85 ± 1.27 |
| F2 | 61.66 ± 1.02 | 26.19 ± 1.2 | 80.77 ± 1.45 | F16 | 54.00 ± 1.00 | 24.50 ± 1.44 | 66.15 ± 1.28 |
| F3 | 65.71 ± 1.60 | 26.38 ± 1.1 | 86.73 ± 1.38 | F17 | 59.16 ± 0.95 | 25.38 ± 1.28 | 75.13 ± 1.29 |
| F4 | 59.00 ± 0.90 | 25.89 ± 1.3 | 76.40 ± 1.52 | F18 | 63.57 ± 0.91 | 25.89 ± 1.29 | 82.32 ± 1.22 |
| F5 | 65.00 ± 1.03 | 26.29 ± 1.3 | 85.47 ± 1.25 | F19 | 54.00 ± 1.05 | 25.12 ± 1.19 | 65.88 ± 1.26 |
| F6 | 68.57 ± 1.06 | 26.95 ± 1.2 | 92.43 ± 1.44 | F20 | 59.16 ± 0.88 | 25.59 ± 1.24 | 75.72 ± 1.28 |
| F7 | 57.00 ± 1.27 | 25.68 ± 1.3 | 73.24 ± 1.41 | F21 | 62.14 ± 1.00 | 26.29 ± 1.28 | 81.71 ± 1.25 |
| F8 | 60.83 ± 0.70 | 26.08 ± 1.2 | 79.35 ± 1.51 | F22 | 54.00 ± 1.16 | 25.50 ± 1.25 | 68.85 ± 1.26 |
| F9 | 65.00 ± 1.00 | 26.49 ± 1.2 | 86.12 ± 1.22 | F23 | 57.50 ± 1.05 | 25.89 ± 1.27 | 74.46 ± 1.24 |
| F10 | 55.00 ± 1.08 | 25.09 ± 1.2 | 69.02 ± 1.20 | F24 | 61.42 ± 0.73 | 26.48 ± 1.29 | 81.38 ± 1.28 |
| F11 | 60.00 ± 0.55 | 25.70 ± 1.1 | 77.10 ± 1.21 | F25 | 53.00 ± 0.95 | 25.39 ± 1.31 | 67.31 ± 1.29 |
| F12 | 64.28 ± 0.67 | 26.19 ± 1.2 | 84.20 ± 1.31 | F26 | 58.33 ± 0.99 | 25.99 ± 1.27 | 75.82 ± 1.24 |
| F13 | 54.00 ± 1.95 | 24.79 ± 1.2 | 66.96 ± 1.30 | F27 | 60.71 ± 1.05 | 26.38 ± 1.25 | 80.13 ± 1.26 |
| F14 | 60.83 ± 0.94 | 25.18 ± 1.3 | 76.64 ± 1.28 |
Table 2: Practical Yield, Drug Loading and Entrapment Efficiency of Nanoparticles
The average particle size of nanoparticles was listed in Table 3. Average particle size of nanoparticles was found to be 91 ± 0.59 to 128 ± 0.47 nm. The zeta potential is defined as the electrical potential between the medium and the layer of the fluid attached to the dispersed particles [16]. Zeta potential is a measure of the magnitude of the electrostatic or charge repulsion or attraction between particles and is one of the fundamental parameters known to affect stability. Zeta potential of prepared nanoparticles was found in range between 0.663 ± 0.34 to 0.865 ± 0.37 mV. It was found that higher the zeta potential less will be the particle aggregation, due to electric repulsion and hence more will be the stability of nanoparticles. The zeta potential value of batch F6 was 0.791 ± 0.32 mV. It was observed that positive charge appears on the surface of nanoparticles can be attributed to the presence of the quaternary ammonium groups of Eudragit L-100 [17] (Figure 2).
| Batch code | Size (nm) | Average zeta potential (mV) |
Solubility (mg/ml) | Batch code | Size (nm) | Average zeta potential (mV) |
Solubility (mg/ml) |
|---|---|---|---|---|---|---|---|
| F1 | 96 ± 0.64 | 0.672 ± 0.24 | 2.010 ± 0.04 | F15 | 112 ± 0.66 | 0.865 ± 0.37 | 2.140 ± 0.04 |
| F2 | 104 ± 0.44 | 0.681 ± 0.28 | 2.145 ± 0.06 | F16 | 97 ± 0.40 | 0.660 ± 0.38 | 1.820 ± 0.02 |
| F3 | 106 ± 0.71 | 0.710 ± 0.31 | 2.120 ± 0.01 | F17 | 107 ± 0.63 | 0.672 ± 0.37 | 1.970 ± 0.04 |
| F4 | 109 ± 0.61 | 0.669 ± 0.31 | 2.140 ± 0.03 | F18 | 89 ± 0.71 | 0.678 ± 0.32 | 1.830 ± 0.01 |
| F5 | 97 ± 1.02 | 0.778 ± 0.33 | 2.170 ± 0.07 | F19 | 103 ± 0.78 | 0.663 ± 0.34 | 1.970 ± 0.061 |
| F6 | 91 ± 0.59 | 0.791 ± 0.32 | 2.190 ± 0.08 | F20 | 109 ± 0.83 | 0.673 ± 0.35 | 1.830 ± 0.05 |
| F7 | 96 ± 0.42 | 0.651 ± 0.27 | 2.019 ± 0.01 | F21 | 118 ± 0.80 | 0.691 ± 0.41 | 2.060 ± 0.04 |
| F8 | 98 ± 0.51 | 0.667 ± 0.29 | 1.850 ± 0.02 | F22 | 128 ± 0.47 | 0.665 ± 0.27 | 2.023 ± 0.02 |
| F9 | 92 ± 0.74 | 0.698 ± 0.21 | 1.810 ± 0.06 | F23 | 126 ± 0.58 | 0.771 ± 0.27 | 2.015 ± 0.03 |
| F10 | 93 ± 0.42 | 0.680 ± 0.33 | 2.105 ± 0.09 | F24 | 83 ± 0.67 | 0.784 ± 0.28 | 2.100 ± 0.04 |
| F11 | 106 ± 0.55 | 0.692 ± 0.25 | 1.900 ± 0.01 | F25 | 89 ± 0.70 | 0.648 ± 0.30 | 1.990 ± 0.06 |
| F12 | 111 ± 0.61 | 0.721 ± 0.45 | 1.810 ± 0.02 | F26 | 94 ± 0.69 | 0.658 ± 0.29 | 1.184 ± 0.08 |
| F13 | 114 ± 0.81 | 0.840 ± 0.37 | 2.148 ± 0.06 | F27 | 97 ± 0.40 | 0.711 ± 0.42 | 1.790 ± 0.07 |
| F14 | 98 ± 0.75 | 0.852 ± 0.40 | 2.120 ± 0.08 | Pure drug - - | 0.250 ± 0.01 | ||
Table 3: Mean Particle Size, Average Zeta Potential and Solubility of Nanoparticles
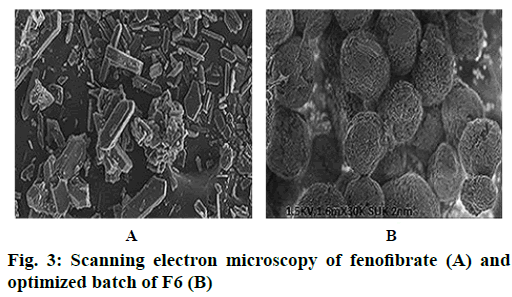
Saturation solubility studies of pure drug and all batches of nanoparticles were studied in distilled water. The result of pure drug and all batches of nanoparticles were shown in Table 3. Results indicated that solubility of all batches of the nanoparticles increased as compared to pure drug [18]. SEM photograph was shown in Figure 3. SEM has shown that the nanoparticles were small, spherical and porous in nature. The SEM image of fenofibrate powder appeared as smooth-surfaced, irregularly shaped, flat crystals in shape. However, the converted solid nanoparticles appeared as smoothsurfaced particles indicating complete adsorption of lipids containing amorphous drug inside the pores of Eudragit L-100 polymer.
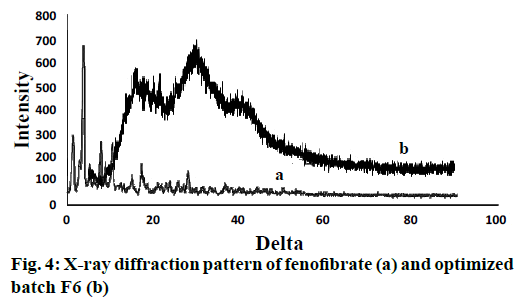
In Figure 1, it could be seen that the fundamental peaks were retained in the pure drug and optimized batch of nanoparticles. Presence of C-H stretching showed 2850-3000 and CH3 bending at 1365 cm-1, C=O stretching of carbonyl at 1670-1820 cm-1, COO stretching at 1000-1300 cm-1 confirmed the presence of drug in optimized batch of nanoparticles (F-6). Eudragit L-100 also showed carboxylic acid OH stretching and C=O stretching at 1700-1725 and 2500- 3300 cm–1, respectively. CH3-CO- at around 1750, 1300, respectively showed ester as C=O stretching and alkane contains C-H stretching and C-H bending at 2850-3000 and 1350-1480, respectively. The optimized batch of nanoparticles showed identical spectrum with respect to the spectrum of the pure drug and polymers, indicating no chemical interaction or changes between the drug molecule and polymers during preparation of nanoparticles [19]. The PXRD study of nanoparticles was shown in Figure 4. It revealed that the intensity of the peaks for the pure drug was sharp but for the drug-loaded nanoparticles, the intensities of the peaks decreased due to the reduced crystallinity of the fenofibrate [17].
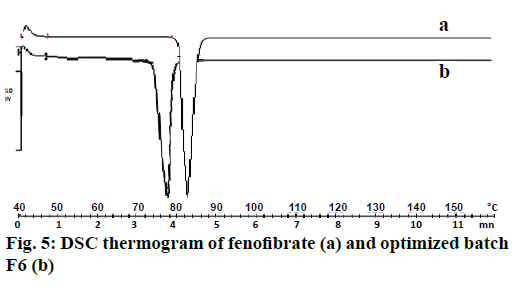
The DSC thermogram of drug and nanoparticles was shown in Figure 5. In case of pure fenofibrate, a sharp endothermic peak was observed at 82° corresponding to its melting point. In the drug-loaded nanoparticles, melting endotherm was observed at 80° with sharp appearance. This change in slightly decreasing the temperature indicated reductions the crystallinity of fenofibrate in the formulation of nanoparticles [20].
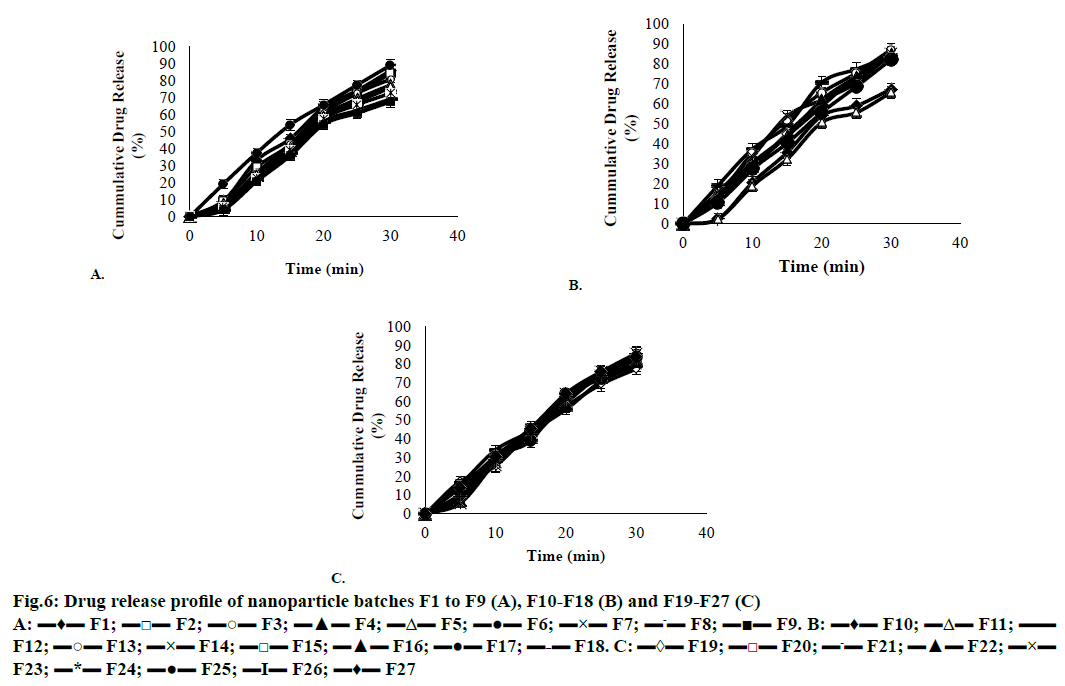
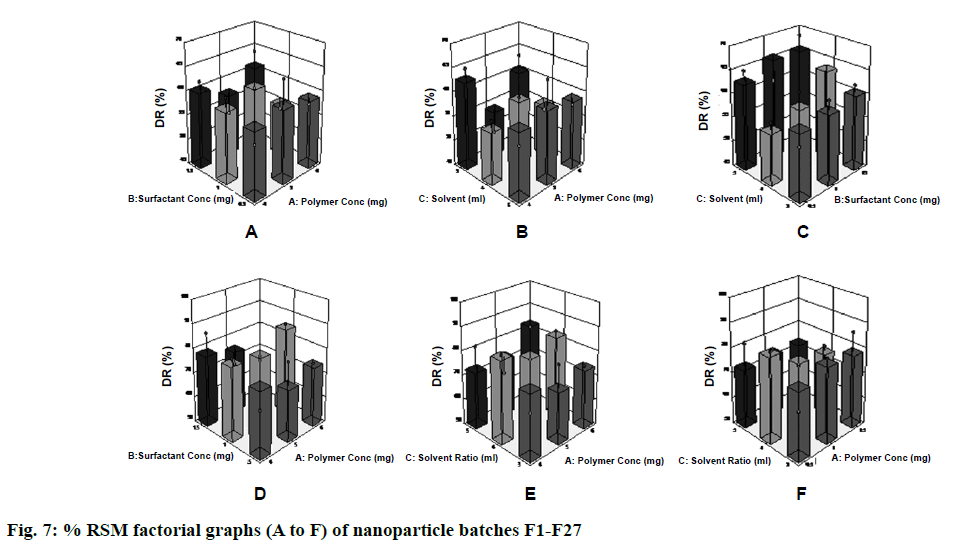
The in vitro drug release profile of the formulation was in the range of 65.79 ± 1.80 to 89.01 ± 0.30 % for 30 min (Figure 6). The batch F6 showed the fastest dissolution rate, with approximately 89 % of the drug being released within 30 min [20]. The results obtained were subjected to multiple regression analysis using Stat-Ease (Design Expert trial, version 8.0) software. The application of response surface methodology yielded the following regression equations, which suggested an empirical relationship between the values of the responses and independent variables in coded unit were shown in Figure 7 and the particle size observed for F6 batch was 91 nm. So F6 batch was optimized as it showed good favourable results on the basis of in vitro drug release study, entrapment efficiency, drug loading, solubility study, particle size and practical yield.
Figure 6: Drug release profile of nanoparticle batches F1 to F9 (A), F10-F18 (B) and F19-F27 (C)
A: ▬♦▬ F1; ▬□▬ F2; ▬○▬ F3; ▬▲▬ F4; ▬Δ▬ F5; ▬●▬ F6; ▬×▬ F7; ▬-▬ F8; ▬■▬ F9. B: ▬♦▬ F10; ▬Δ▬ F11;▬▬ F12; ▬○▬ F13; ▬×▬ F14; ▬□▬ F15; ▬▲▬ F16; ▬●▬ F17;▬-▬ F18. C: ▬◊▬ F19; ▬□▬ F20; ▬-▬ F21; ▬▲▬ F22;▬×▬ F23; ▬*▬ F24; ▬●▬ F25; ▬I▬ F26; ▬♦▬ F27
A satisfactory attempt was made to develop nanoparticles of fenofibrate, a BCS class II drug to enhance the solubility. A full 33 factorial design was used. As drug and polymer ratio increases beyond 1:6, EE, drug loading and particle size also increased but practical yield decreased. The formulation batch F6 was found to be optimized batch on the basis of size of nanoparticle, yield, encapsulation efficiency as well as in vitro drug release, which was satisfactory as per requirements. The FTIR and DSC studies revealed absence of any chemical interaction between drug and excipients. Morphology was observed by SEM analysis that the nanoparticles were small and spherical in nature. Particle size observed for optimized batch was 91 nm. Percent drug release for the optimized batch was 89.01 % at the end of 30 min. Optimized formulation for nanoparticle preparation contained 1:6 drug polymer ratio, 1:3 organic solvent ratio and 1 % surfactant. Thus, preparation of nanoparticles by precipitation method appeared to be a unique technology, which provided improved solubility and consequently increased bioavailability of BCS class II drugs that could prove to increase therapeutic effectiveness.
Acknowledgements
The authors thank Smruthi Organics Pvt. Ltd. Solapur, MS, India for supplying the pure fenofibrate. Authors also thank Dr. S. S. Patil, Principal, Ashokrao Mane College of Pharmacy, Peth-Vadgaon for providing required facilities to carry out this research work.
Financial support and sponsorship
Nil.
Conflicts of interest
There are no conflicts of interest.
References
- Sharma R, Yasir M, Bhaskar S. Formulation and evaluation of paclitaxel loaded PSA-PEG nanoparticles. J Appl Pharm Sci 2011;01:96-8.
- Hecqa J, Deleers M, Fanara D, Vranckx H, Amighi K. Preparation and Characterization of nanocrystals for solubility and dissolution rate enhancement of nifedipine. Int J Pharm 2005;299:167-77.
- Savjani KT, Gajjar AK, Savjani JK. Drug solubility: importance and enhancement techniques. ISRN Pharm 2012;2012:195727.
- Nair R, Arunkumar KS, Priya KV, Sevukarajan M. Recent advances in solid lipid nanoparticle based drug delivery systems. J Biomed Sci Res 2011;3:368-84.
- Mohante S, Boga PK. Role of nanoparticles in drug delivery system. Int J Res Pharm Biomed Sci 2010;1:41-66.
- Soppimath KS, Aminabhavi TM, Kulkarni, AR, Rudzinski WE. Biodegradable Polymeric nanoparticles as drug delivery devices. J Control Release 2001:1-20.
- Wysocki J, Belowski D, Kalina M. Effects of micronized Fenofibrate on insulin resistance in patients with metabolic syndrome. Int J Clin Pharmacol Ther 2004;42:212.
- Sambhara GD, Kukkala BR, Pulugu RB, Gedagamma S, Malleswara RP, Mounica TD. Formulation and evaluation of floxacin nanoparticles. Int J Biol Pharm Res 2012;3:659-62.
- Shendge RS, Sayyad FJ. Formulation development and evaluation of colonic drug delivery system of budesonide microspheres by using spray drying technique. J Pharm Res 2013;6:456-61.
- Bathool A, Vishakante GD, Khan MS, Shivakumar HG. Development and characterization of atorvastatin calcium loaded chitosan nanoparticles for sustain drug delivery. Adv Mater Lett 2012;3:466-70.
- Nesalin JA, Smith AA. Preparation and evaluation of chitosan nanoparticles containing zidovudine. Asian J Pharm Sci 2012;7:80-4.
- Singh A, Nainwal P, Nanda D, Jain DA. Solubility enhancement study of pioglitazone using solid dispersion as solubilization technique. IJSID 2011;1:95-100.
- www.usfdadatabase.com
- Yadav AV, Kalimuthu S. Formulation and evaluation of carvedilol loaded Eudragit E100 nanoparticles. Int J Pharmtech Res 2009;1:179-83.
- Nagavarma BV, Yadav HK, Ayaz A, Vasudha LS, Shivakumar HG. Different techniques for preparation of polymeric nanoparticles: A Review. Asian J Pharm Clin Res 2012;5:16-23.
- Vollrath A, Schubert S, Windhab N, Biskup C, Schubert US. Labeled Nanoparticles Based on Pharmaceutical EUDRAGIT® S 100 Polymers. Macromol Rapid Commun 2010;31(23):2053-58.
- Shinde SS, Hosmani AH. Preparation and evaluation lipid nanoparticles of Fenofibrate obtained by spray drying technique. Pharmacophore 2014;5:85-93.
- Mahajan A, Singh S, Kaur S, Aggarwal A. Studies on solubility enhancement and in vitro dissolution profile of poorly water soluble drug atenolol using solid dispersion technique. Int J Res Pharm Sci 2013;4:344-49.
- Cortesi R, Ravani L, Menegatti E, Esposito E, Ronconi F. Eudragit microparticles for the release of budesonide: A Comparative study. Int J Pharm Sci 2014;415-21.
- Bhise KS, Naeem M. Formulation and development of Fenofibrate loaded liposphere system. J Drug Deliv Ther 2013;3:1-10.
