- *Corresponding Author:
- Hetal P. Thakkar
Shri G. H. Patel Pharmacy Building, Faculty of Pharmacy, Maharaja Pratapsinhrao Gaekwad Parisar, The Maharaja Sayajirao University of Baroda, Fatehgunj, Vadodara-390 002, India
E-mail: hetal_thakkar11@yahoo.com
| Date of Submission | 22 March 2017 |
| Date of Revision | 12 April 2018 |
| Date of Acceptance | 01 November 2018 |
| Indian J Pharm Sci 2019;81(1):22-31 |
This is an open access article distributed under the terms of the Creative Commons Attribution-NonCommercial-ShareAlike 3.0 License, which allows others to remix, tweak, and build upon the work non-commercially, as long as the author is credited and the new creations are licensed under the identical terms
Abstract
The aim of the present investigation was to develop an inclusion complex-based hydrogel for transdermal delivery of raloxifene hydrochloride. Inclusion complexation was tried using two types of cyclodextrins, β-cyclodextrin and hydroxypropyl-β-cyclodextrin. Kneading, co-precipitation, solvent evaporation and freeze drying were the methods explored for preparing inclusion complexs. The prepared complexes were characterized using differential scanning calorimetry, Fourier transform infrared spectroscopy, X-ray powder diffraction and both in vitro and ex vivo drug release studies. Kneading method was found to be the most suitable for preparing the inclusion complexes. Phase solubility studies indicated that β-cyclodextrin gave rise to Bs type of curve while hydroxypropyl-β-cyclodextrin resulted in Ap type of curve. The stability constants (K1:1) obtained for β-cyclodextrin and hydroxypropyl-β-cyclodextrin were 1572 and 2960, respectively. Complexation efficiency of hydroxypropyl-β-cyclodextrin was higher than that of β-cyclodextrin. Differential scanning calorimetry, Fourier transform infrared spectroscopy and X-ray powder diffraction studies indicated the superiority of hydroxypropyl-β-cyclodextrin for complexing raloxifene hydrochloride. In vitro and ex vivo studies showed that highest drug release occurred from inclusion complex prepared with hydroxypropyl-β-cyclodextrin with a ratio of 1:2.5. Histopathology studies revealed that the developed hydrogel was non-irritant and micropores were clearly visible for the microporated skin.
Keywords
Raloxifene hydrochloride, skin microporation, inclusion complex, transdermal, permeation enhancement
Menopause is a biological process that occurs as a part of ageing in women. One of the key factors of the menopause is oestrogen deficiency. Oestrogen, through its receptors, ERα and ERβ [1], plays a key role in modulation of bone density [2]. Thus, its deficiency often leads to osteoporosis in post-menopausal women [3], causing a decrease in bone mineral density and an increased risk of fracture. Oestrogen deficiency also leads to the increased risk of breast cancer [4]. Hormone replacement therapy (HRT) with oestrogen alone or in combination with progesterone has remained the first choice for the treatment of postmenopausal osteoporosis. However, the prolonged use of HRT further increases the risk of breast cancer [5,6]. This dictates the need for an alternative approach for the management of postmenopausal osteoporosis. Out of several available therapies for the treatment of postmenopausal osteoporosis, selective oestrogen receptor modulators are gaining preference over long-term HRT [7]. Raloxifene hydrochloride (RH), [6-hydroxy-2-(4-hydroxyphenyl)benzo-[b]thien- 3-yl][4-[2-(1-piperidinyl)ethoxy]-phenyl]ethanone hydrochloride, is an important drug of this category. RH reproduces the beneficial effects of oestrogens on the skeletal systems, without the negative effects oestrogens on breast and endometrium. It is commonly prescribed for the prevention of osteoporosis and also possesses beneficial actions on lipoprotein metabolism, reducing both total cholesterol and low-density lipoprotein. However, the use of RH is severely limited by its poor bioavailability, high inter-individual and intra-individual variability (30 %) of most pharmacokinetic parameters and several associated adverse events like vasodilation (hot flushes), venous thromboembolism (deep vein thrombosis, pulmonary embolism and retinal vein thrombosis) and leg cramps (idiopathic). It is a biopharmaceutical classification system class II drug with low solubility and high permeability [8]. Presently available marketed preparations include film-coated tablets containing 60 mg of RH per tablet administered orally. Absolute bioavailability of RH is only 2 % due to its poor water solubility and extensive first-pass metabolism. Novel drug delivery systems such as micro-emulsion [9], self-micro-emulsifying systems [9], solid-lipid nanoparticles [10] and inclusion complexation [11] have been reported to enhance the oral bioavailability of RH. One of the approaches for avoidance of the first pass hepatic metabolism is delivery of drug through alternative routes such as buccal, sublingual, vaginal, nasal, rectal or transdermal. The avoidance of portal circulation and thereby hepatic metabolism leads to the enhancement of bioavailability. The advantages such as patient compliance, possibility of cessation of the treatment if required, avoidance of hepatic first pass metabolism and thereby decrease in metabolite-related side effects make transdermal delivery an attractive route for administration of RH. Transdermal delivery of RH using novel carriers such as nanotransfersomes [12], ethosomes [13] and a patch [14] using various polymers have been reported. Transdermal delivery is limited to potent drugs having favourable partition coefficient and low molecular weight. Stratum corneum (SC) is a principal barrier to the permeation of drug molecules across the skin. RH has extremely poor solubility (aqueous solubility 0.25 mg/l) and high lipophilicity as indicated by its log P value of 5.69 [15]. In order for a drug to cross the SC layer, it needs to be in solubilized state. This necessitates utilization of an approach, which can solubilize RH. Inclusion complexation of drug with cyclodextrin (CD) molecules improves the aqueous solubility of drug required for penetration across viable skin tissues rich in water content. Squeezing out of CD complexes through SC have also been reported to enhance drug permeation [16]. Thus, one of the approaches selected for the present study was to prepare the inclusion complex of RH with CD. Our previous work on ethosomes [13] indicated that pre-creation of micropores on the skin using microneedles could significantly increase the transdermal permeation compared to the intact skin. A combination of two or more techniques is usually required to achieve sufficient transdermal permeation.
Application of microneedles, a physical penetration enhancement technique that breaches SC in a painless manner, have shown significant impact on systemic delivery of certain drugs via transdermal route [17]. Thus, in the present investigation, a combination of two approaches viz. CD inclusion complexation and use of microneedles was used for enhancement of transdermal permeation of RH.
Materials and Methods
RH was obtained as a gift sample from Aarti Drugs Ltd., Mumbai. βCD and hydroxypropyl-β-CD (HPβCD) were purchased from HiMedia Pvt. Ltd, Mumbai. Dermastamp® was purchased from Coherent Medical Service, Mumbai. All other reagents were of analytical grade.
Phase solubility study [18]
About 10 ml of distilled water containing different concentrations of βCD and HPβCD (Table 1) were taken into vials and 2 mg of RH (amount exceeding its solubility) was added to each vial. Mixtures were stirred for two days and allowed to stand for one day at room temperature to attain equilibrium. Content of each vial was filtered using Whatman filter paper and concentration of RH in filtrate was estimated using a validated UV/Vis spectrophotometric method at 287 nm absorption maximum. The solubility experiments were conducted in triplicate. A phase solubility diagram was then constructed by plotting the solubility of the substrate (RH) on the y-axis and the total molar concentration of ligand (CD) on the x-axis. The complexation efficiency (CE) and the stability constant (K1:1) were calculated from the slope of the graph and the intrinsic solubility (S0) of RH (i.e, solubility in absence of CD) by the following Eqn. 1 and 2, respectively: CE = slope/(1–slope) and K1:1 = CE/S0 = slope/S0(1–slope).
| Molar ratio of RH: βCD/ HPβCD |
Concentration of βCD/HPβCD taken (mM) | Solubility of RH with βCD* (mM) | Solubility of RH with HPβCD* (mM) |
|---|---|---|---|
| 1:0 | 0.0 | 0.134±0.008 | 0.134±0.008 |
| 1:0.5 | 0.195 | 0.081±0.04 | 0.153±0.010 |
| 1:1 | 0.390 | 0.158±0.02 | 0.207±0.012 |
| 1:1.5 | 0.585 | 0.242±0.031 | 0.270±0.018 |
| 1:2 | 0.780 | 0.308±0.02 | 0.314±0.027 |
| 1:2.5 | 0.975 | 0.225±0.03 | 0.408±0.071 |
*Values represented as mean±SD (n=3)
Table 1: Phase Solubility Studies
Preparation of CD complexes
Various methods as explained below were tried for the preparation of inclusion complex of RH with βCD or HPβCD. The yield as well as drug complexes of the inclusion complexes so prepared were determined by the method described in a subsequent section.
Kneading method [19]
RH and βCD or HPβCD with molar ratio as given in Table 2 were accurately weighed and transferred to a mortar. The mixture was then triturated in a mortar with a small volume (1 ml per g of mixture) of watermethanol (1:1 v/v) solution till a homogenous paste was formed. The paste that formed was kneaded for 30 min and then dried at 50° in an oven. The dried mass was passed through a 20# sieve.
| Batch code | Method | Type of CDs | RH-CD Molar ratio | Yield* (%) | Drug complexed* (%) |
|---|---|---|---|---|---|
| CB1:1 | Co-precipitation | βCD | 1:1 | 53.5±0.87 | 3.24±0.96 |
| CB1:2 | 1:2 | 56.1±1.32 | 8.24±0.78 | ||
| CH1:1 | HPβCD | 1:1 | 56.1±1.12 | 80.2±1.19 | |
| CH1:2.5 | 1:2.5 | 51.2±1.14 | 71.3±1.43 | ||
| KB1:1 | Kneading | βCD | 1:1 | 95.5±0.44 | 97.3±0.76 |
| KB1:2 | 1:2 | 93.0±0.57 | 99.1±0.22 | ||
| KH1:1 | HPβCD | 1:1 | 83.0±0.52 | 83.9±1.32 | |
| KH1:2.5 | 1:2.5 | 83.4±1.23 | 98.5±1.89 | ||
| SB1:1 | Solvent evaporation | βCD | 1:1 | 85.8±2.11 | 71.3±0.47 |
| SB1:2 | 1:2 | 75.1±1.32 | 69.6±1.75 | ||
| SH1:1 | HPβCD | 1:1 | 62.5±2.34 | 81.9±1.54 | |
| SH1:2.5 | 1:2.5 | 60.3±3.21 | 72.5±1.48 | ||
| FB1:1 | Freeze drying | βCD | 1:1 | 85.0±0.34 | 71.0±0.67 |
| FB1:2 | 1:2 | 81.2±0.65 | 68.0±0.88 | ||
| FH1:1 | HPβCD | 1:1 | 80.6±1.25 | 55.1±0.81 | |
| FH1:2.5 | 1:2.5 | 72.0±1.13 | 58.0±0.66 |
*Values represented as mean±SD (n=3)
Table 2: Optimization of Complexation Method
Solvent evaporation method [20]
Weighed quantities of βCD or HPβCD and RH were dissolved in methanol. Evaporation of methanol was done at 65° under vacuum of 110 mm Hg using rotary evaporator to obtain a solid powdered inclusion complex. The complex was scrapped from round bottom flask and passed through 20# sieve.
Co-precipitation method [21]
RH (200 mg) was added to 2:1 water:methanol and the mass so obtained was heated at 55-60° until complete dissolution. βCD and HPβCD as per molar ratio (Table 2) were then added. The mass was completely dissolved at 55-60°. The solution was cooled and maintained at 8-10° to assist precipitation. The precipitates were separated by filtration and dried in hot air oven at 50°.
Freeze drying method [21]
RH and βCD or HPβCD as per molar ratio (Table 2) were dissolved in water and methanol (2:1) mixture. The mixtures were frozen at –70° followed by drying by lyophilization (Heto Drywinner DW 1, Denmark).
Evaluation of CD complexes, percent yield
In order to select appropriate method for complexation, the prepared CD complexes were evaluated for percent yield and percent drug complexation. The prepared inclusion complexes using different methods mentioned above were weighed using a high precision calibrated balance (Shimadzu, Japan) and the % yield was calculated using the Eqn. 3, percent yield = total weight of powdered complex obtained/total weight of RH and CD taken×100.
Drug content
The accurately weighed quantities of prepared complexes were dissolved in water-methanol (9:1) and the amount of RH present was estimated using a validated UV/Vis spectrophotometric method at 287 nm λmax to calculate drug content using the Eqn. 4, drug content = amount of RH measured in complexes/ amount of RH initially taken×100.
Differential scanning calorimetry (DSC)
DSC analysis was carried out using a differential scanning calorimeter (DSC-60, Shimadzu, Japan) at a heating rate of 10° per minute in the range of 30-300° under inert nitrogen atmosphere. DSC thermograms were recorded for RH, CDs and their complexes.
Fourier-transform infrared spectroscopy (FTIR)
FTIR spectroscopy was carried out using potassium bromide disc method. Samples of 1-2 mg each were mixed with potassium bromide, compressed into discs and prepared pellets were scanned using Alpha FTIR spectrophotometer (Bruker Optics, USA) over the range of 4000-500 cm-1. The samples used were RH, CDs and their complexes.
X-ray diffraction (XRD) analysis
XRD of RH, CDs, and their complexes were obtained using X'Pert Pro XRD (PANalytical, The Netherlands) equipped with copper high intensity X-ray tube operated at 45 KV and a current of 40 mA as radiation source. The diffraction patterns were achieved using continuous scan mode with 2 θ values ranging from 5-50°.
Preparation of inclusion complex-loaded hydrogel
The optimized CD complex was incorporated into Carbopol 940 hydrogel. The composition of the hydrogel is shown in Table 3. CD complex was added into a mixture of ethanol and propylene glycol and stirred till complete solubilisation. The solution was then added to overnight soaked Carbopol 940 and stirred for uniform mixing. Triethanolamine was added to this dispersion drop-wise and pH was adjusted to 6.8. This resulted into a transparent hydrogel.
| Components | Concentration (% w/w) |
|---|---|
| Raloxifene HCl containing Complexes | 0.1 |
| Carbopol 940 | 2 |
| Ethanol | 20 |
| Propylene Glycol | 10 |
| Triethanolamine | 0.07 |
| Water | Up to100 |
Table 3: Composition of Inclusion Complex-Loaded Hydrogels
In vitro drug release study
In vitro drug release study was performed for the plain drug solution, plain drug hydrogel and CD-loaded hydrogel. Franz diffusion cell was used for the study. Activated dialysis membrane (12 kD, HiMedia Pvt. Ltd, Mumbai) mounted on the Franz diffusion cell was used as permeation barrier. The receptor chamber was filled with 15 ml diffusion medium (phosphate buffer pH 7.4 containing 10 % methanol). The membrane was positioned on the receptor chamber using suitable adhesive. The test formulations containing 0.5 mg RH were applied to the membrane. The diffusion medium was continuously stirred. Samples (3 ml) were withdrawn from the receptor compartment at predetermined time intervals over 24 h and the cell was replenished with the same volume of fresh diffusion medium. The samples were analysed using a UV/Vis spectrophotometric method at 287 nm for estimation of RH.
Ex vivo drug permeation and skin deposition study
The samples studied for ex vivo skin permeation and skin deposition studies were plain drug solution, plain drug hydrogel and inclusion complex-loaded hydrogel. The studies were carried out using full thickness pig ear skin. The study for all the above mentioned samples was performed for intact skin as well as skin pre-treated using microneedles. Freshly excised pig ear skin was dipped in hot water and subcutaneous fat was removed using scalpel. It was then impregnated in phosphate buffer (pH 7.4)-glycerol (9:1) and preserved at –70° for not more than two months. Before starting the experiment, the skin was thawed at room temperature, rinsed with phosphate buffer (pH 7.4) and mounted on the Franz diffusion cell. Receptor chamber was filled with 15 ml of 9:1 phosphate buffer (pH 7.4):methanol as diffusion medium. The skin was positioned on the receptor chamber with SC facing upwards and fixed using a suitable adhesive. The excess skin was trimmed off and the whole assembly was put on magnetic stirrer. Before applying formulation, skin was placed in diffusion media for 30 min to achieve equilibration. The test formulations containing 0.5 mg RH were applied to the skin. The content of the cell was continuously stirred at 100 rpm. Samples (3 ml) were withdrawn from the receptor compartment at predetermined time intervals over 24 h and each time an equal volume of fresh diffusion medium was replaced. After suitable dilution, samples were analysed on a UV spectrophotometric method at 287 nm absorption maximum. At end of permeation experiments (24 h), the skin surface was washed three times with the diffusion medium (15 ml) to remove the drug retained on the skin. About 3 ml aliquot from this washing was suitably diluted and analysed by UV spectrophotometric method. The drug deposited within the skin was also estimated for which washed skin was cut into small pieces using a chopper. All pieces were collected in methanol (20 ml) and to extract out the drug present in these pieces, the mix was subjected to bath sonication for 3 cycles each of 5 min followed by homogenization for 5 min under cold condition. The extracted out drug was then separated by centrifugation at 4000 rpm for 10 min. The supernatant was collected and drug present in it was analysed by UV spectrophotometric method as mentioned above.
To study the effect of microneedles pre-treatment on the drug permeation, micropores were created on the skin by microneedle stamp (Dermastamp®) using our earlier reported method[13]. The experiments were performed using the procedure described above.
Histopathological study
Optimized KH1:2.5 hydrogel containing 0.5 mg drug was applied on freshly excised rat abdominal skin. After six hours, skin was immersed in 10 % buffered formalin, dehydrated in gradually increasing concentrations of ethanol, immersed in xylene and finally embedded in paraffin. The 5-μm thick sections of skin were cut from these paraffin blocks using microtome and placed on glass slides. The paraffin wax was removed by gently warming the slide and washing the molten wax with xylene. Sections were then washed with absolute alcohol and water and stained with hematoxylin and eosin to determine gross histopathology and collagen deposition, respectively. Commercial glycerol’s mounting fluid was used to finally mount the stained sections. Negative control and positive control slides were also prepared by treating rat skin with phosphate buffer solution pH 7.4 and isopropyl alcohol (IPA) respectively using the method as mentioned above. The slides were analysed at 10-fold magnification using optical microscope (Magnus MLX).
Stability Study
A stability study was performed as per ICH guidelines to establish product’s integrity with respect to desirable characteristics. The optimized CD complexes hydrogel samples were filled in aluminium tubes, which were sealed and stored under two different environmental conditions viz., 4±2° with ambient RH; 30±2° with 60±5 % RH. Samples were withdrawn from the tube fortnightly for 3 mo, diluted with methanol and evaluated for percent drug retained as an indicator of stability.
Results and Discussion
Inclusion complexation with CDs has been reported to enhance the solubility of guest molecules which have the ability to fit into the hydrophobic cavity. Out of the various types of CDs, βCD and its derivatives are most widely used in pharmaceutical dosage forms. βCD is the most accessible, the lowest-priced and generally the most useful. Derivatives of βCD such as HPβCD are also preferred for preparation of inclusion complexation because of the higher solubility compared to the parent CD. RH is poorly water soluble drug and hence its solubilisation is necessary prior to its incorporation into a transdermal delivery system. Inclusion complexation with βCD and HPβCD increase in the apparent aqueous solubility of the drug and thereby amplify the thermodynamic driving force for transdermal permeation. Additionally, high concentrations of CDs can disrupt the protein structure of the SC promoting the transdermal permeation of solubilized compounds [22].
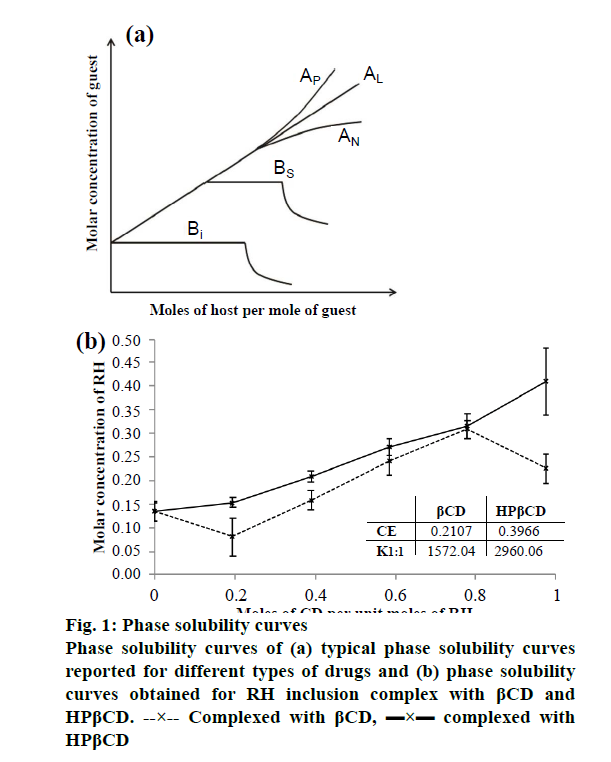
Phase solubility study is useful for evaluation of the affinity between βCD, the host molecule and guest molecule. The typical phase solubility diagrams observed for different types of drugs is shown in Figure 1a and the phase solubility diagram obtained for RH inclusion complex with βCD and HPβCD is shown in Figure 1b. As shown in Figure 1a, the phase solubility diagram falls into two main categories, A- and B-type. A-type curves indicative for the formation of soluble inclusion complexes, while B-type behaviour is suggestive of the formation of inclusion complexes of poor solubility. The phase solubility diagram of RH with βCD is shown in Figure 1b. It is evident that the aqueous solubility of RH increases linearly as a function of βCD concentration up to 1:2 molar ratio. With further increase in the concentration of βCD, there was a decrease in the solubility. The phase solubility diagram is of Bs type, which indicates formation of a complex with limited solubility. The stability constant (K1:1) obtained with βCD was 1572 M-1, indicating formation of stable 1:1 molar ratio complex. Highest solubility was obtained with 1:2 molar ratio. So, for preparation of inclusion complex with βCD, two different molar ratios viz. 1:1 and 1:2 were selected.
The CE was found to be 0.210. The phase solubility diagram of the RH with HPβCD is shown in Figure 1b. The aqueous solubility of RH increases linearly as a function of HPβCD concentration. Phase solubility diagram of RH in the presence of HPβCD can be classified as the Ap type indicating formation of higher order complexes with respect to the ligand at higher ligand concentrations. Stability constant with HPβCD was obtained 2960 M-1, indicates formation of stable 1:1 molar ratio complex and from highest solubility was obtained with 1:2.5 molar ratio. The CE calculated was 0.397. The significantly higher values of stability constant and the CE in case of HPβCD compared to the βCD indicates that more stable complex with higher efficiency is obtained with HPβCD. It has been reported that while βCD often gives rise to B-type curves due to the poor water solubility of the ligand itself, the chemically modified CDs including HPβCD and SBEβCD usually produce soluble complexes (i.e. A-type systems).
Various methods were tried for the preparation of the inclusion complex using the drug:ligand ratios selected in phase solubility studies. The % yield and % drug complexes of the different batches are shown in Table 2. It is evident that the highest yield and % drug complexes were obtained using kneading method while lowest values were obtained by co-precipitation method. The reason for lower yield may be the incomplete precipitation at the cooling temperature. Co-precipitation method has not received considerable success owing to low yield, risk of using organic solvents, and longer time required for the preparation in larger scale [23]. Kneading method is simpler and does not require sophisticated instrumentation and hence it is more feasible at larger scale. Thus further investigations were done on the batches prepared using kneading method.
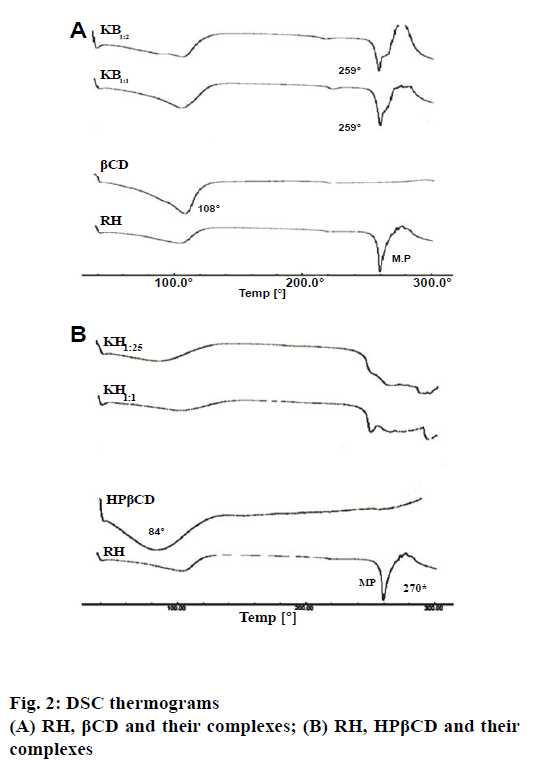
Figure 2a and 2b showed the DSC thermograms of pure components and their corresponding complexes, RH- βCD and RH-HPβCD, respectively. DSC thermogram of RH showed two endotherms, one at 110° and another at 270°. The endotherm at 110° could be attributed to the loss of water of hydration, while the sharp endotherm at 270° corresponds to the melting point of RH. However, the thermogram of βCD and HPβCD showed a broad and weak endothermic effect, which attained a maximum around 108° and 84°, respectively. These results might be due to the release of water [24]. The DSC thermograms of inclusion complex of RH with βCD show an endotherm at 259° indicating noncomplexation or incomplete complexation of RH with βCD. The Bs type of curve obtained in the phase solubility studies support this finding. However, in case of the inclusion complexation with HPβCD, there was a complete disappearance of the RH endothermic peak for both the ratios viz. 1:1 and 1:2.5. This could be attributed to the formation of an amorphous solid dispersion, and/or the molecular encapsulation of drug inside the CD cavity [24]. These results suggested the formation of inclusion complexes between HPβCD and RH.
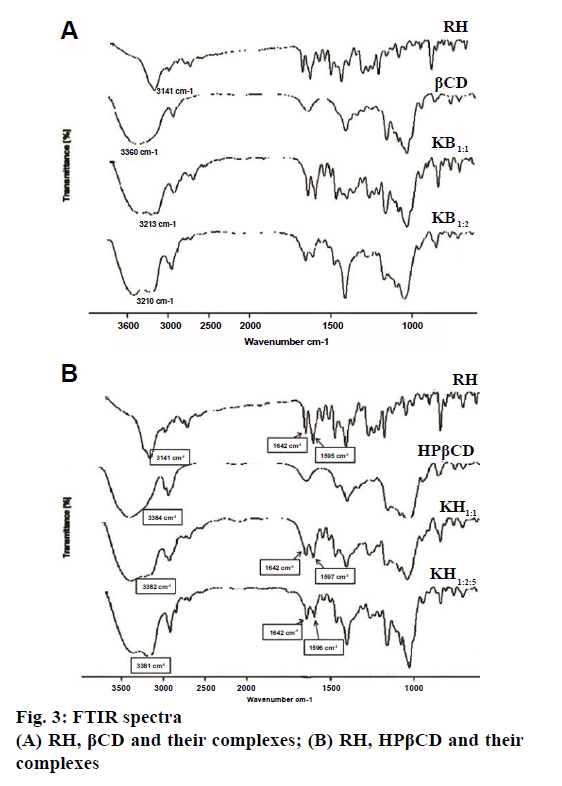
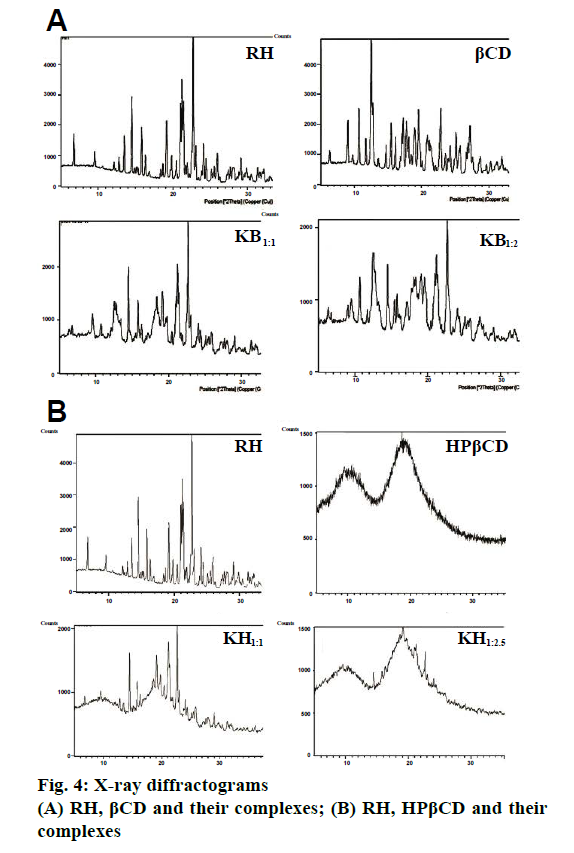
Fig. 3a and 3b showed the FTIR spectra of RH, βCD, HPβCD and their inclusion complexes. FTIR spectrum of RH is characterized by principal absorption peaks at 1642 cm-1 (C=0 group stretching), 1596 cm-1 (C-O-C group stretching), 1465 cm-1 (S-benzothiofuran ring). In βCD FTIR spectrum, peak at 3360 cm-1 was due to free –OH group vibration. The FTIR spectrum of HPβCD shows peaks at 3384 cm-1 (-OH group vibration) and around 3800 cm-1 (C=O glucosidic group stretching). FTIR spectrum of RH with βCD and HPβCD showed significantly reduced intensity and slight shifting of characteristic peak of drug. Such results could be attributed to the complex formation between RH and CDs. The XRD pattern of RH showed (Figure 4a and 4b) intense and sharp peaks, indicating its crystalline nature. Crystallinity was determined by comparing some representative peak heights in the diffraction patterns of the complexes with those of a reference (pure RH). The peak intensities of pure RH and its corresponding complexes are presented in Table 4. In the RH powder XRD, intense peaks at a diffraction angle (θ) of 2°, at position of 14.5, 15.8 and 22.7 depicts the crystalline nature of the drug. Similarly, diffractograms of βCD exhibited a series of intense peaks, showing its crystalline character. However, the XRD pattern of the RH-βCD of molar ratio 1:1 showed fewer, broader, and less intense peaks and molar ratio 1:2 showed a further decrease in peak area of drug (Figure 4a and 4b). At diffraction angle (θ) of 2°, at position of 15.8, area of complex was decreased than area of βCD. This reduction in crystallinity is an indication of inclusion complex formation which was better in 1:2 molar ratio compared to 1:1.The absence of any peak in the HPβCD diffractograms revealed the amorphous nature of this compound. XRD pattern of RH-HPβCD complexes, molar ratio 1:1 and 1:2.5 showed a reduction in peak intensity. These results suggested increased amorphous nature of drug due to inclusion complex formation.
| Position [°2θ] | RH | βCD | KB1:1 | KB1:2 | KH1:1 | KH1:2.5 |
|---|---|---|---|---|---|---|
| 14.5 | 253.33 | 73.84 | 165.12 | 91.77 | 92.9 | 21.11 |
| 15.8 | 159.75 | 191.11 | 81.73 | 50.69 | 59.9 | 21.07 |
| 22.7 | 544.35 | 271.19 | 275.51 | 237.65 | 172.8 | 40.87 |
Table 4: XRD Peak Areas of RH, βCD, HPβCD and their Complex
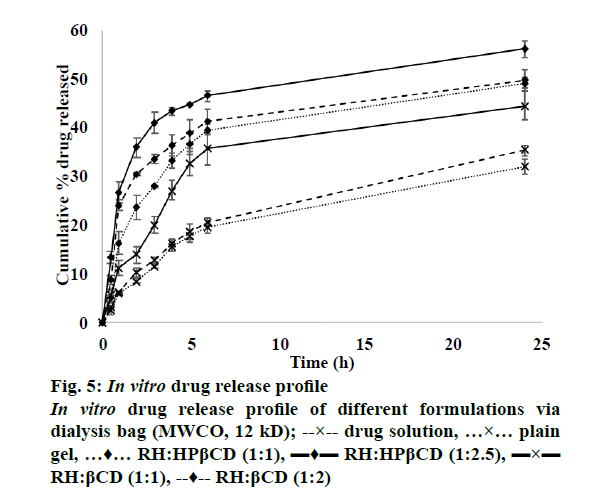
The release profile of RH solution, plain RH hydrogel and different formulations is shown in Figure 5. It is evident that the drug release after 24 h from the plain drug dispersion was 35.3 %, which was slightly higher than that obtained from the plain drug hydrogel. This might be due to the viscosity effect imparted by the gelling component. In case of inclusion complex-loaded hydrogels, both βCD and HPβCD showed significantly higher drug release than the plain drug indicating the solubilizing effect of the CDs. However, the effect was more pronounced for HPβCD with highest drug release obtained for the ratio 1:2.5. This finding is supported by the phase solubility studies and DSC studies, which indicated the superiority of HPβCD in forming inclusion complex with RH.
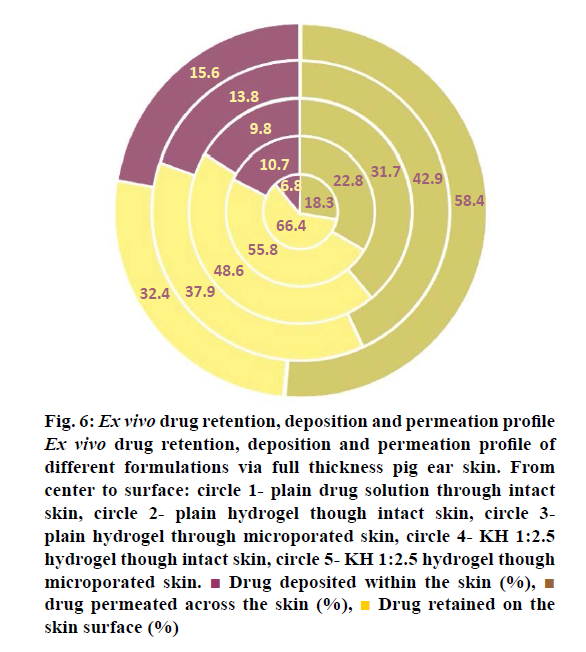
The results of the ex vivo studies conducted on full thickness pig ear skin are shown in Table 5. There was a good correlation between the results of the in vitro drug release studies and the ex vivo drug permeation studies. The results indicated that inclusion complex formed with HPβCD at a ratio of 1:2.5 showed maximum drug permeation after 24 h. This might be due to the presence of higher amount of CD, which is a known penetration enhancer along with the high solubilisation of RH due to inclusion complexation. The highest permeation through intact skin obtained was around 43 %. In order to further enhance the permeation, the skin was pre-treated with microneedles and this significantly increased the permeation to around 58 %. Microneedles are able to create micropores in the skin without causing pain to the patient as they have very short length and small diameter. Figure 6 shows the % drug retained on the surface, % drug deposited within the skin and the % drug release from different samples. It can be seen that highest % of drug retained on the surface was for plain drug solution followed by the plain drug hydrogel, which indicates the very less ability of the plain drug to cross the SC layer. Microporation led to a decrease in the drug retained on the skin surface indicating the effect of creation of pores on enhancement of drug permeation. Highest skin deposition (13.8±1.29 %) was found with KH1:2.5 hydrogel due to more carrying capacity of RH-HPβCD complex. This further increased the skin deposition to 15.6 %. Thus, the inclusion complex formed using HPβCD at a molar ratio of 1:2.5 (RH:HPβCD) was found to give maximum transdermal permeation, which was significantly increased by microporation of the skin.
Figure 6: Ex vivo drug retention, deposition and permeation profile
Ex vivo drug retention, deposition and permeation profile of
different formulations via full thickness pig ear skin. From
center to surface: circle 1- plain drug solution through intact
skin, circle 2- plain hydrogel though intact skin, circle 3-
plain hydrogel through microporated skin, circle 4- KH 1:2.5
hydrogel though intact skin, circle 5- KH 1:2.5 hydrogel though
microporated skin.  Drug deposited within the skin (%),
  drug permeated across the skin (%),
  Drug retained on the
skin surface (%)
| Time (h) | Intact skin* | Microporated skin* | ||||||
|---|---|---|---|---|---|---|---|---|
| Plain drug solution | Plain drug hydrogel | KB1:1 hydrogel | KB1:2 hydrogel | KH1:1 hydrogel | KH1:2.5 hydrogel | Plain drug hydrogel | KH1:2.5 hydrogel | |
| 0 | 0 | 0 | 0 | 0 | 0 | 0 | 0 | 0 |
| 0.5 | 0.5±0.03 | 0.4±0.02 | 0.8±0.04 | 2.4±0.06 | 0.8±0.06 | 4.8±0.03 | 0.7±0.04 | 6.3±0.22 |
| 1 | 1.9±0.10 | 1.6±0.09 | 4.6±0.47 | 5.5±0.17 | 2.5±0.44 | 6.3±0.25 | 2.1±0.42 | 9.5±0.47 |
| 2 | 5.4±0.17 | 5.7±0.23 | 6.2±0.87 | 6.7±0.21 | 5.1±0.67 | 9.4±0.43 | 3.8±0.76 | 11.7±0.76 |
| 3 | 6.8±0.24 | 8.4±0.41 | 10±0.75 | 9.6±0.32 | 6.3±1.56 | 11.6±0.54 | 4.9±0.98 | 16.8±0.97 |
| 4 | 8.1±0.47 | 10.1±0.54 | 11.8±0.92 | 11.3±0.54 | 9.4±0.78 | 14.1±1.26 | 7.9±1.12 | 20.6±1.09 |
| 5 | 8.9±0.39 | 11.2±0.68 | 13.6±0.87 | 13.8±1.26 | 11.6±1.46 | 16.2±1.23 | 11.7±1.35 | 23.7±1.43 |
| 6 | 9.4±0.61 | 12.3±1.12 | 14.6±1.43 | 14.7±1.75 | 12.6±1.34 | 19.3±1.87 | 17.8±1.32 | 30.7±1.54 |
| 24 | 18.3±1.01 | 22.8±1.06 | 26.3±1.47 | 29.8±1.89 | 28.5±0.98 | 42.9±1.34 | 31.7±1.55 | 58.4±1.87 |
| JSS# | 1.6 | 2.581 | 2.876 | 3.908 | 3.711 | 5.801 | 3.407 | 6.809 |
| PER | - | 1.61 | 1.80 | 2.44 | 2.32 | 3.63 | 2.13 | 4.26 |
*Values represented as mean±SD (n=3); # in µg/cm2/h
Table 5: Ex Vivo Drug Permeation Study
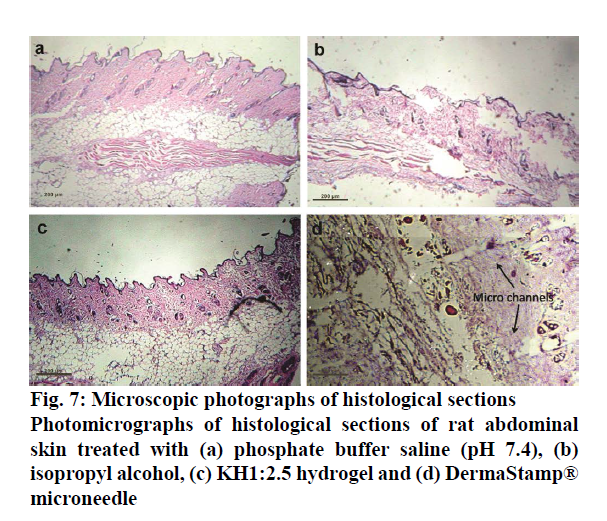
Histopathology studies were thus conducted on this optimized formulation to visualize the pores and assess any toxic or irritation potential of the formulation. The images obtained in these studies are shown in Figure 7. It was found that IPA-treated rat skin showed disruption and swelling in the epidermal and subepidermal regions, which was absent in the skin treated with phosphate buffer solution pH 7.4. KH1:2.5 hydrogel contained HPβCD and Carbopol 940, which are nontoxic to skin. KH1:2.5 hydrogel showed insignificant disruption, damage and oedema in the epidermal and sub epidermal regions. That was indication of nontoxicity of formulation on rat skin. The results of the stability studies are shown in Table 6. It is evident that the prepared formulation is more stable under refrigerated conditions than at room temperature.
| Time (months) |
Drug retained* (%) | |
|---|---|---|
| 4±2° ambient RH |
30±2° 60±5 %RH |
|
| 0 | 100.0±0.00 | 100.0±0.00 |
| 1 | 100.0±0.00 | 98.2±0.03 |
| 2 | 99.1±0.42 | 95.0±0.51 |
| 3 | 96.6±0.61 | 94.7±0.32 |
*Values represented as mean±SD (n=3)
Table 6: Stability Study of KH1:2.5 Hydrogel
RH could form a stable inclusion complex with HPβCD. Out of the different methods tried, kneading method was found to give maximum yield and drug complexed. In vitro drug release studies indicated a significantly higher release from the inclusion complexes than the plain drug. Ex vivo studies revealed enhancement of transdermal permeation with the use of inclusion complexation, which could be further increased upon pre-treatment of skin with microneedles. The histopathology studies indicated a non-irritating nature of the developed formulation with clear visualization of the formation of micropores. Extended research involving pharmacokinetic and pharmacodynamic studies may be able to prove the superiority of the formulation upon the marketed tablet dosage form.
Acknowledgements
Authors express thanks to Aarti Drugs Ltd., Mumbai, India and Polar Genetics, Jalandhar, India for providing gift samples of Raloxifene hydrochloride and pig ears, respectively.
Conflict of interest
There is no conflict of interest.
Financial support and sponsorship
Nil.
References
- Couse JF, Korach KS. Estrogen receptor null mice: what have we learned and where will they lead us? Endocr Rev 1999;20:358-417.
- Chen FP, Hsu T, Hu CH, Wang WD, Wang KC, Teng LF. Expression of estrogen receptors alfa and beta mRNA and alkaline phosphatase in the differentiation of osteoblasts from elderly postmenopausal women: comparison with osteoblasts from osteosarcoma cell lines. Taiwan J Obstet Gynecol 2006;45:307-12.
- Riggs BL, Khosla S, Melton LJ 3rd. Sex steroids and the construction and conservation of the adult skeleton. Endocr Rev 2002;23:279-302.
- Zs S. Estrogen Prevention for Breast Cancer. 1st ed. Hauppauge, New York, United States: Nova Science Publishers, Inc.; 2013. p. 1-22.
- Beral V; Million Women Study Collaborators. Breast cancer and hormone-replacement therapy in the Million Women Study. Lancet 2003;362:419-27.
- Rossouw JE, Anderson GL, Prentice RL, LaCroix AZ, Kooperberg C, Stefanick ML, et al. Risks and benefits of estrogen plus progestin in healthy postmenopausal women: principal results From the Women's Health Initiative randomized controlled trial. JAMA 2002;288:321-33.
- Mitlak BH, Cohen FJ. In search of optimal long-term female hormone replacement: the potential of selective estrogen receptor modulators. Horm Res 1997;48:155-63.
- Teeter JS, Meyerhoff RD. Environmental fate and chemistry of raloxifene hydrochloride. Environ Toxicol Chem 2002;21:729-36.
- Thakkar H, Nangesh J, Parmar M, Patel D. Formulation and characterization of lipid-based drug delivery system of raloxifene-microemulsion and self-microemulsifying drug delivery system. J Pharm Bioallied Sci 2011;3:442-8.
- Patel BD, Modi RV, Thakkar NA, Patel AA, Thakkar PH. Development and characterization of solid lipid nanoparticles for enhancement of oral bioavailability of Raloxifene. J Pharm Bioallied Sci 2012;4:S14-S16.
- Wempe MF, Wacher VJ, Ruble KM, Ramsey MG, Edgar KJ, Buchanan NL, et al. Pharmacokinetics of raloxifene in male Wistar–Hannover rats: Influence of complexation with hydroxybutenyl-beta-cyclodextrin. Int J Pharm 2008;346:25-37.
- Mahmood S, Taher M, Mandal UK. Experimental design and optimization of raloxifene hydrochloride loaded nanotransfersomes for transdermal application. Int J Nanomedicine 2014;9:4331-46.
- Thakkar HP, Savsani H, Kumar P. Ethosomal Hydrogel of RaloxifeneHCl: Statistical optimization and ex vivo permeability evaluation across microporated pig ear skin. Curr Drug Deliv 2016;13:1111-22.
- Chauhan BM, Bajpai M. Formulation and evaluation of transdermal drug delivery of raloxifene hydrochloride. Int J Pharm Sci Res 2010;1:72-9.
- Reimão JQ, Miguel DC, Taniwaki NN, Trinconi CT, Yokoyama-Yasunaka JK, Uliana SR. Antileishmanial Activity of the Estrogen Receptor Modulator Raloxifene. PLoS Negl Trop Dis 2014;8:e2842.
- Challa R, Ahuja A, Ali J, Khar RK. Cyclodextrins in drug delivery: an updated review. AAPS PharmSciTech 2005;6:E329-57.
- Choy YB, Prausnitz MR. The Rule of Five for Non-Oral Routes of Drug Delivery: Ophthalmic, Inhalation and Transdermal. Pharm Res 2011;28:943-8.
- Higuchi T, Connors K. Phase solubility techniques. Adv Anal Chem Instrum 1965;4:117-212.
- Hussein A, Ibrahim M, Amin M, Ahmed O, Afouna M. Improved in vitro dissolution parameters and in vivo hypolipidemic efficiency of atorvastatin calcium through the formation of hydrophilic inclusion complex with cyclodextrins. Drug Dev Res 2011;72:379-90.
- Agrawal R, Gupta V. Cyclodextrins – A Review on Pharmaceutical Application for Drug Delivery. IJPFR 2012;2:95-112.
- Vianna R, Bentley M, Ribeiro G, Carvalho F, Neto A, de Oliveira D, et al. Formation of cyclodextrin inclusion complexes with corticosteroids: their characterization and stability. Int J Pharm 1998;167:205-13.
- Kear CL, Yang J, Godwin DA, Felton LA. Investigation into the Mechanism by Which Cyclodextrins Influence Transdermal Drug Delivery. Drug Dev Ind Pharm 2008;34:692-7.
- Shah N, Seth AK, Balaraman R. Bioavailability enhancement of poorly soluble Raloxifene by Designing Inclusion Complex with β–Cyclodextrin. Int J Pharm Pharm Sci 2015;7:205-11.
- Fernandes CM, Vieira TM, Veiga FJ. Physicochemical characterization and in vitro dissolution behaviour of nicardipine–cyclodextrins inclusion compounds. Eur J Pharm Sci 2002;15:79-88.
