- *Corresponding Author:
- Y. Bal
Laboratory of Molecular and Macromolecular Physical Chemistry, University of Blida I, 09000 Blida, Algeria
E-mail: bal_y@yahoo.fr
| Date of Submission | 06 June 2016 |
| Date of Revision | 11 September 2016 |
| Date of Acceptance | 31 October 2016 |
| Indian J Pharm Sci 2016;78(6):715-724 |
This is an open access article distributed under the terms of the Creative Commons Attribution-NonCommercial-ShareAlike 3.0 License, which allows others to remix, tweak, and build upon the work non-commercially, as long as the author is credited and the new creations are licensed under the identical terms
Abstract
Formulations of encapsulated oxytetracycline in chitosan spherical beads have been developed in this work through the ionotropic gelation method in sodium tripolyphosphate or tripolyphosphate and characterized as drug delivery system to the gastrointestinal tract by Fourier transform infrared spectroscopy spectroscopy, thermal analysis and in vitro drug release in simulated gastric fluids. The Fourier transform infrared spectroscopy and differential scanning calorimetry measurements showed that tripolyphosphate and tripolyphosphate are cross linked ionically to chitosan and there was no significant drug interaction between the entrapped drug and the carrying polymer. With the respect to chitosan cross linking features, sodium hexametaphosphate seems to give better swelling, higher diffusion and faster release kinetics, while addition of glutaraldehyde as a second cross linking agent lowers the drug discharge. Release extent and kinetics were found to be pH dependent and approximated very well by the multistep models equations of Makoid-Banakar, Peppas-Sahlin and Korsmeyer-Peppas.
Keywords
Oxyteracycline, chitosan, encapsulation, crosslinking, release kinetics
Tetracyclines are broad spectrum antibiotics that exhibit activity against a wide range of Gram-positive and Gram-negative bacteria. Their favourable antimicrobial properties and the absence of major adverse effects have led to their extensive use in the therapy of human and animal infections [1-4]. Unfortunately, like the other antibiotic and as a result of the extensive prescription in conventional formulations, the emergence of microbial resistance has limited their effectiveness. So, other strategies are needed to keep tetracycline’s and other antibiotics as resources for the next generation and to restore their initial antimicrobial activity. These strategies are based on the development of new classes of drugs with unique antibacterial mechanisms or new formulations enabling the reduction of amounts of antimicrobials used worldwide. In particular, investigation of new formulations has been carried out in order to overcome the disadvantages resulting from the administration of antibiotics in conventional forms [5-7].
The specific addressing of active molecules to the organ, tissue or cell is considered now as a major challenge and promising route for the treatment of various human diseases, including bacterial infections, cancer or genetic diseases [8]. New carrying and targeting approaches for drug delivery have been extensively studied in recent years. Most of them are centered on the development of nano- or micro-scale carrying systems [9-11] or specific molecules to improve and maximize drug bioavailability and hence therapeutic effects over a period of time. This highly selective approach would ensure an optimum response from the dosage form which significantly lowers the side effects and reduce treatment’s expense.
As non-conventional pharmaceutical dosage forms, polymer-based drug delivery systems may be designed as safe and effective carrying systems to reach the targeted properties, for example, by improving the solubility of the active agent in specific environments. Natural biopolymers such as chitosan or alginate and their derivatives have attracted considerable interest in a wide range of biomedical and pharmaceutical applications including drug delivery and tissue engineering [12-15]. Several advantages including healing properties, biocompatibility, availability, biodegradability and non-toxicity [16-18] made them suitable for pharmaceutical preparations. Solutions of these biopolymers are frequently gelled through the ionotropic gelation (IG) method with appropriate crosslinking agents like glutaraldehyde and glyoxal [19,20] which may be associated with toxic effects or sodium tripolyphosphate and sodium hexametaphosphate [21-23] which are indicated to be safe.
The IG method appears now to be a very promising route for the encapsulation of various hydrophilic and lipophilic substances as well as cells, bacteria and many other materials. It may be simple, attractive and advantageous method that can be fully industrialized. From sustained recent development many workers reported rational characterization with impact on the pharmaceutical properties of systems prepared according to this method [24-26] or new applications such as fibbers like materials [27] or an onion-like multimembrane hydrogel structure fabricated via a multistep interrupted gelation that was able to control the release of both hydrophobic and hydrophilic model drugs [28].
This study focuses on the preparation and characterization of chitosan microcapsules intended to the carrying and delivering of oxytetracycline as active agent to colon as target organ. Fourier transform infrared spectroscopy (FTIR), thermal gravimetric analysis (TGA) and differential scanning colorimetry (DSC) are used to characterize the prepared delivery systems. Effects of some process parameters such as pH and concentration are examined in relation to release kinetics of the antibiotic in simulated body fluids.
Materials and Methods
Kitomer chitosan (CS) powder from prawn shells (Pandalus borealis), with a degree of deacetylation (DD) of 88.4%, was purchased from Marinard Biotech (Quebec, Canada). Oxytetracycline hydrochloride (OTC) of pharmacopoeias grade was obtained as a gift sample from Saidal Antibiotical, Algeria. Sodium tripolyphosphate (TPP) and sodium hexametaphosphate (HMP) of analytical grade were procured from Fluka. All other chemicals were of analytical grade and used as received. Distilled water was used throughout the study and other reagents were all analytical reagents grade.
Microcapsule preparation
CS microcapsules were prepared according to the following method. One gram of CS was accurately weighed and dissolved in a 1% (w/v) acetic acid solution. Two hundred and fifty milligrams of OTC equivalent to a theoretical loading of 25% (w/w) was then added at room temperature to the CS solution under stirring until homogenisation is obtained. Fifty millilitres of OTC-CS dispersion was then added drop wise at the rate of one drop per second through a needle of 0.5 mm (gauge 25) into 200 ml of 6% w/v TPP or 6% w/v HMP aqueous solution under stirring. The droplets instantaneously gelled into discrete OTC-CS microcapsules upon contact with the crosslinking agent. The OTC containing microcapsules were left overnight in a dark area to cure. They were then separated with paper filter, washed with water and dried at room temperature. Glutaraldehyde (GLU) as a second cross-linking agent was added according to three ways; in the first, it was added by mixing the dispersion of OTC in CS with GLU (0.01%) HMP solution giving the (CS/OTC)/(GLU/HMP) formulation. The OTC/CS dispersion was dropped with GLU and the resulting microcapsules were poured in the HMP solution which gave the second formulation (CS/OTC/GLU)/(HMP). The third system was obtained from the subsequent stiffening of the gelled material in HMP in GLU solution giving the (CS/OTC/HMP)/(GLU) formulation.
Drug content of microcapsules
For the encapsulation efficiency study and prior to the determination of OTC content, the beads were allowed to break during 24 h in aqueous solution of 0.1 N HCl. Tween 80 (0.5%) was added to enhance the drug solubility. The amount of drug was then assayed after filtration by UV/Vis spectrophotometry at 353 nm using Shimadzu 1280 UV/Vis instrument. The determination was made in triplicate and runs averaged. Loading efficiency (%) was calculated using the Eqn. L(%)=(Wa/Wt)×100, where Wa is the actual OTC content and Wt is theoretical OTC content.
Swelling tests
Dried microspheres were carefully weighed and immersed in 50 ml of simulated gastrointestinal fluid (SGF) with pH values ranging from 1.2 to 7.4 at room temperature. At pre-determined time intervals, swollen microspheres were taken out, and the excess water was blotted with filter paper from the surface, and then weighed on sensitive balance (Sartorius). Below Eqn. was used to determine the swelling degree S (%), which is S(%)=((Ms-Md)/Md)×100, where Md and Ms represent the mass of dry and swollen microspheres, respectively.
Morphological characterization
Morphological characterization of the microcapsules was carried out by scanning electron microscopy (SEM) using Jeol JSM-6360\L instrument. Prior to analysis, the samples were coated with a thin (2 nm) layer of gold.
FTIR spectroscopy
FTIR spectra of free and encapsulated OTC in CS containing samples were recorded on KBr pellets using Shimadzu 8400 FTIR spectrophotometer (400-4000 cm-1). The samples were thoroughly powdered and dried before milling with anhydrous KBr.
Thermal analysis
TGA were performed with HR 2950 thermal analysis system (TA Instruments, USA). TGA curves were obtained in the temperature range from 10 to 500°, using platinum crucibles (pan) with 4.0±0.1 mg of sample, under dynamic N2 atmosphere flowing at 45 ml/min and heating rate of 10°/min. The instrument was preliminarily calibrated at a room temperature using a certified thermometer and by the Curie point with alumel and nickel at 154.16 and 358.28°, respectively. Before test scanning, the air was discharged from the oven at the starting temperature during 3 min.
DSC curves were recorded using the TA 2920 differential scanning calorimeter (TA Instruments, USA) under an inert argon atmosphere at a flow rate of 50 ml/min. The instrument furnace, equipped with two identical crucibles, reference crucible and measurement crucible was preliminarily calibrated for a wide range of working temperature at heating rate of 5° min-1 with 5 standard substances (toluene, mercury, gallium, indium and tin). The cell constant calibration was determined with indium. For the current measurements, a test sample is accurately weighed and introduced into the measurement crucible.
In vitro release kinetics
Prior to drug release kinetic measurements, 0.01 g of dried beads with OTC content were suspended under stirring rate of 50 rpm in 10 ml of simulated gastrointestinal fluids at pH 7.4 and pH 1.2 and 37°. The simulated intestinal fluid (SIF) of pH 7.4 was composed by a mixture of KH2PO4, NaOH 0.2 N and pancreatin while the SGF of pH 1.2 contained NaCl, HCl and pepsin. Supernatant aliquots of 1 ml were withdrawn periodically and replaced with an equal volume of fresh buffered solution. The amount of OTC released in different media was then determined spectrophotometrically at 353 nm and plotted against time. The in vitro release kinetic measurements were performed in triplicate for each sample and in batch mode using conventional magnetic agitator with speed control and thermostated glass vessel.
The release kinetic curves were fitted to various mathematical formulas using appropriate models in which the most reliable models are summarized in Table 1. The modelling procedure was performed using the DD solver add-on tool [29] working under Microsoft® Excel which can estimate the parameters of a nonlinear function that provides the closest fit between experimental data and the non-linear function. The best fit solution was identified by evaluating the coefficient of correlation (R2), where the highest R2 value indicates the best fit. The various parameters derived from fitting models may be used to characterize the release properties and to make pairwise comparisons.
| Model | Equation | Parameter (s) |
|---|---|---|
| Higuchi | Qt=kH. t0.5 | kH, Higuchi kinetic constant; Qt is the amount of drug dissolved in time t |
| Weibull 1 | Qt=100×[1-e–(t–Ti)β/α)] | Tiis the location parameter, represents the lag time before the onset of the dissolution or release process and in most of the cases will be zero; α: is the scale parameter defines the time scale of the process; β:characterizes the curves as either exponential (b=1), S-shaped (b>1) or parabolic (b<1) |
| Peppas-Sahlin1 | Qt=k1. tm+k2.t2m | k1: constant that corresponds to the release rate of diffusion; k2: constant that corresponds to the release rate of polymer relaxation; m: constant. |
| Peppas-Sahlin2 | Qt=k1.t0.5+k2.t | k1, k2: for diffusion and erosion controlled release; |
| Korsmeyer-Peppas | Qt=kKP.tn | kKP: Korsmeyer-Peppas kinetic constant, n: is the release exponent , indicative of the drug release mechanism |
| Baker-Lonsdale | 3/2[1–(1–Qt/100)2/3]–Qt/100=kBLt | kBL: Baker-Lonsdalerelease kinetic constant |
| Makoid-Banakar | Qt=kMB. tne–k.t | kMB: Makoid-Banakar kinetic constant; k, n: constants |
Table 1: Model Equations Used for Fitting Drug Release Data
Results and Discussion
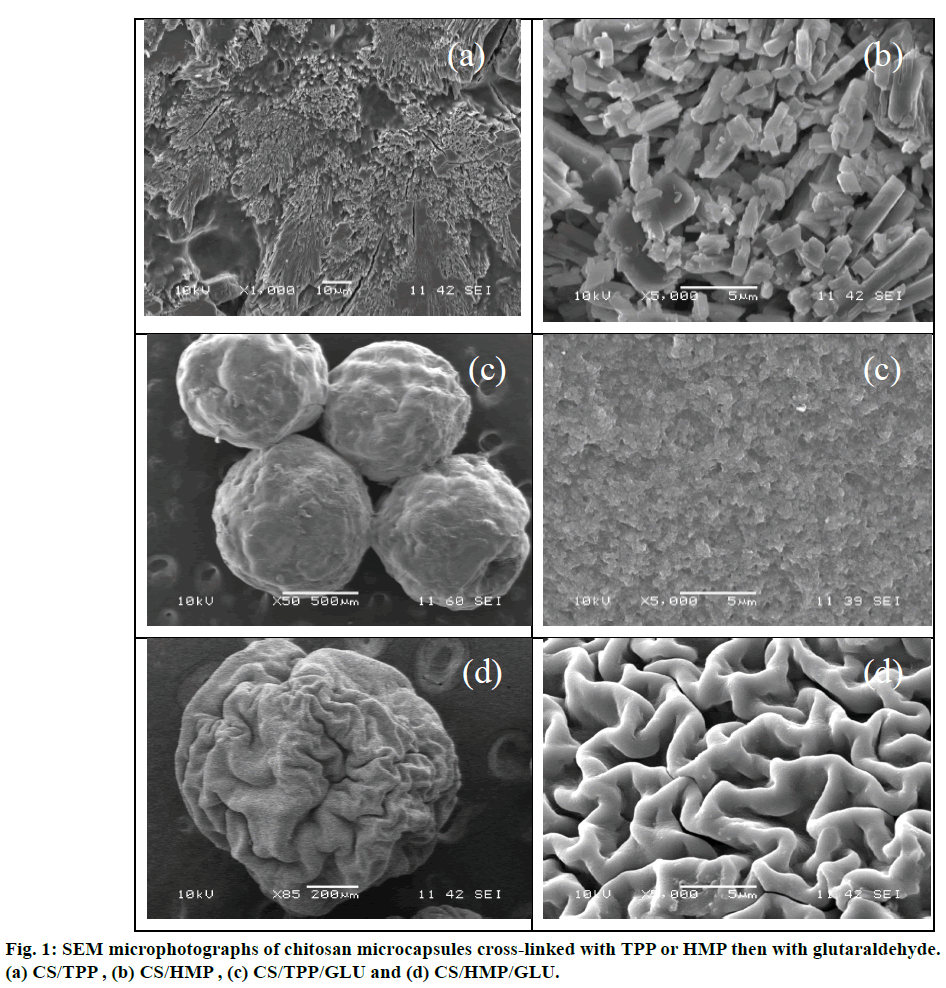
Scanning electron microscopy results in various CS microcapsules materials which are presented in Figure 1. As it is shown, the obtained microcapsules were spherical in shape and seem to have a micro reservoir structure with rough and porous surface. Careful examination demonstrated that the cross-linking procedure plays significant role in the morphology and microstructure of the microcapsules. The surface of the cross-linked microspheres by TPP becomes smooth and more rigid under the subsequent treatment with GLU, the action of which also reduces the size of the resulting microcapsule. Similar observation can be drawn up in the case of HMP which had, previously, flaky and less compact structure as it is depicted in HMP.
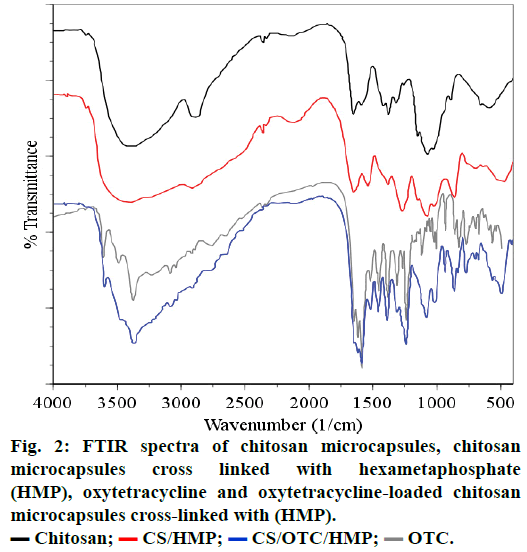
FTIR spectroscopy analyzes the infrared spectra of unmodified CS, cross-linked CS (Figure 2). In spectrum (a), a broad absorption band centered around 3437 cm-1 is attributed to either the hydrogen bonded O-H or primary amines N-H bonds or both. The polymer also showed characteristic bands at 1651 cm-1 attributed to the C=O stretching vibration in amide group and 1596 cm-1 arising from the bending vibration of the N-H bonds of the primary amine group. The strong peak appearing at 1080 cm-1 is due to the skeletal vibrations involving the C-O stretching which are usually regarded as the fingerprint peak for the saccharide structure of CS while the peak at 1380 cm-1 corresponds to the alkane C-H stretching vibration [30-33].
The spectra of cross-linked CS microspheres with HMP, (Figure 1b) and TPP (not represented) exhibit a strong and broadened antisymmetric band at about 3430 cm-1, which results from overlapping of the O-H and N-H stretching vibrations of functional groups engaged in hydrogen bonds[34]. Two absorption bands are observed in the spectrum of CS cross-linked with HMP: the band at 1654 cm-1, (1654 cm-1 in TPP crosslinks) assigned to antisymmetric deformation of N-H vibrations in -NH3 + ion [34,35] and the band at 1272 cm-1 (1215 cm-1 in TPP crosslinks) arising from P=O stretching vibrations in phosphate ions [36], i.e. the antisymmetric stretching vibrations of PO2- groups. Such a vibration confirms the formation of ionic crosslinks between -NH3+ groups of CS and TPP ions [35,37].
Comparison of the FTIR spectra of CS cross-linked with HMP or OTC (CS/HMP or CS/OTC in Figure 2) with the FTIR spectrum of the double cross-linked material CS/HMP/GLU (Figure 3) shows no significant difference except in the O-H and N-H stretching vibration regions (1740-1720 cm-1). Indeed, the broad peak in this region is larger for CS/HMP/GLU than CS/ HMP or CS/OTC likely due to more intense hydrogen bonds. Furthermore, the absence of characteristic peaks of aldehyde in all spectra confirms that GLU has totally reacted with CS. The presence of the vibration bands located at 1272, 1215 and 1257 cm-1, in CS/ HMP, CS/TPP/GLU and CS/HMP/GLU, respectively, is attributed to PO2 stretching vibrations whereas the peaks at 1651 cm-1 and 1647 cm-1 in CS/HMP/GLU and CS/TPP/GLU are assigned to the -NH2 bending vibration indicating that HMP and TPP anions interact with -NH3+ cations of CS, respectively [35,38].
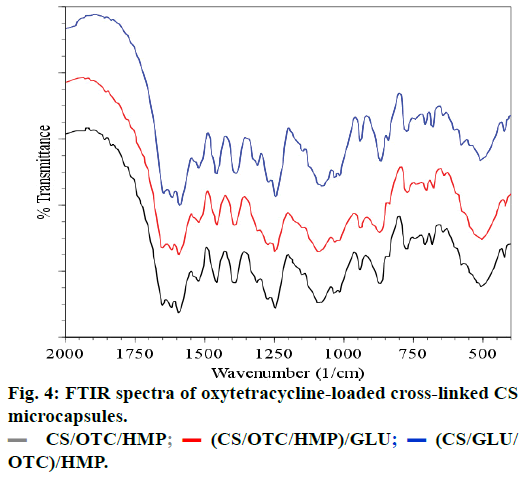
The spectra of OTC and OTC loaded CS microspheres cross-linked with HMP are presented in Figures 1c and 1d, respectively. The spectrum of OTC exhibits characteristic absorption bands at 1651-1589 cm-1 which arise from C=O and C=C bands of the aromatic cycle. The absorption band at 1650 cm-1 is attributed to >C=N-H groups while the N-H and N-C vibrations bands of amine are located at 3487 cm-1 and 3371 cm-1, respectively. The sharp band observed at around 3600 cm-1 comes from the stretching vibration of the free OH group and may be embedded with the absorption band of hydrogen-bonded hydroxyl groups which is usually broad in the 3550-3200 cm-1 region. The spectral analysis of OTC loaded CS microspheres reveals the absorption bands between 1600-1500 cm-1 attributed to the OTC. In particular, vibration bands at 1630, 1585 and 1334 cm-1 are assigned to amides, rotation vibration of aromatic C=CC and aromatic amines vibration, respectively. Furthermore, vibration bands located around 3602, 3485 and 3371 cm-1 are observed in the spectrum of OTC and CS/OTC/HMP as well. Therefore, FTIR spectra evidence that OTC does not react or interact significantly with CS or HMP after encapsulation in CS. The same conclusion is deduced with double cross-linked CS such as CS/OTC/HMP, CS/OTC/HMP/GLU and CS/GLU/OTC/HMP as depicted in Figure 4. The antibiotic agent OTC is therefore freely dispersed in the polymeric matrices.
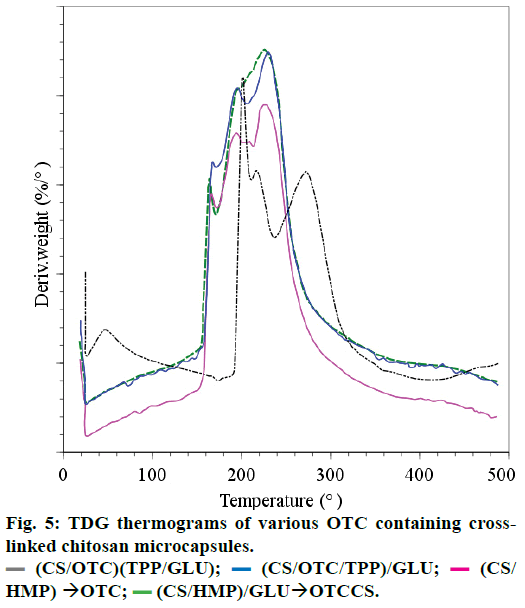
Thermal analysis, DSC and TG analyses were carried out on the following microcapsules: (a) double crosslinked CS microcapsules with HMP followed by GLU on which diffusion of OTC was performed [(CS/ HMP)+GLU×OTC)], (b) cross-linked CS with HMP on which diffusion of OTC was performed [(CS/ HMP)×OTC)], (c) microcapsules obtained using CS mixed with OTC in the TPP coacervate before GLU cross-linking [(CS/OTC/TPP)/GLU] and (d) CS mixed with OTC in the coacervate TPP and GLU [(CS/OTC) (TPP/GLU)].
The DSC thermograms (not reported here) for the samples a, b and c showed an endothermic peak attributed to the evaporation of water in strong interaction with the hydrophilic cross-linked CS matrix. This evaporation leads to a weight loss percentage of 10% (ATG measurements) for samples a, b and c between 25 and 165° and nearly 15% for sample d between 25 and 195°. Material degradation occurs at higher temperature since the materials lose nearly 41% in weight when the temperature rises up to 400° for sample d and around 54% in weight for samples c, b and a. The thermal phenomena occurring during the material degradation are complex as depicted in Figure 5 where DTG curves of various samples are displayed.
They are likely due to simultaneous degradation of cross-linked CS and OTC. The exothermic thermal degradation of samples a-d occurs at lower temperature than the thermal degradation of CS that occurs between 250 and 350° [39,40]. Therefore, it can be stated that the decrease of the thermal stability of cross-linked CS is due to the reduction of crystallinity. These results are in agreement with that reported by Kittur et al., [41] which confirms by XRD, DSC, ICP and EDAX that a reduction in crystallinity and an increase in hydrophilicity of CS occur after cross-linking with TPP. The present work shows that the thermal stability decreases as: CS>CS/(TPP+GLU)>CS/TPP/GLU=CS/ HMP=CS/HMP/GLU as reported in Pieróg et al. [42] In conclusion, cross-linked CS membranes with GLU and TPP are less stable than CS. Besides, repeated TG measurements performed on sample d, for example, confirmed the good homogeneity of this sample.
Literature data shows that the thermal degradation of CS structure does not follow a single mechanism but is a complex reaction that gives different decomposition products [43-46]. The decomposition starts from a random scission pathway of C-O-C bond of the pyranose ring and is followed by a further formation of small molecules and volatile compounds including acetic acid, acetic anhydride, acetamide and aromatic heterocycles such as pyrazines, pyridines, pyrroles and furans. However, it can be supposed that CS, cross-linking agent and OTC in cross-linked microcapsules, release small molecular products under more complex thermal degradation behaviour. Thermal analysis of tetracycline hydrochloride [47] showed an endothermic event at 225° and exothermic event at 235°, attributed to a fusion followed by thermal decomposition and oxidation of the evolved products.
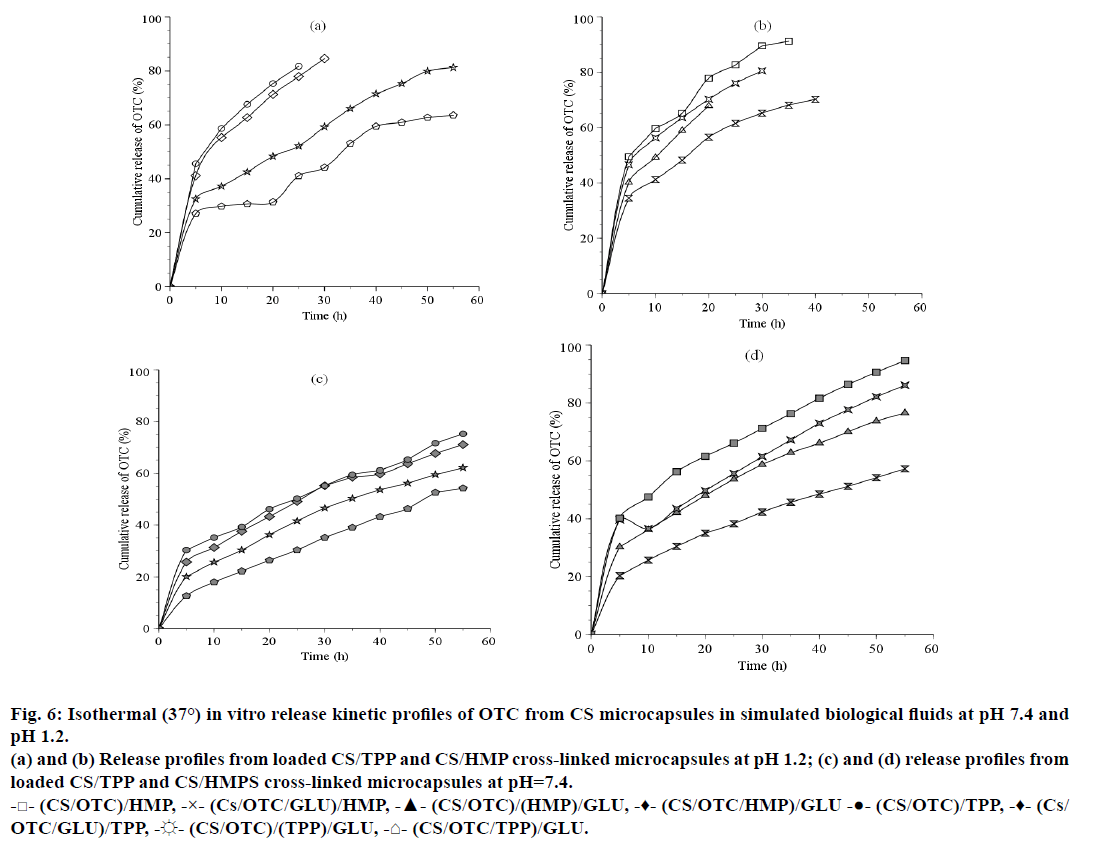
In the present work, OTC release was investigated vs. time in buffered solutions simulating gastric media at pH 1.2 and pH 7.4. Preliminary tests for drug loading efficiency determination indicated that an average of 162.5 mg/g (drug/CS), i.e. 65% can be obtained for an initial charge of 250 mg/g. Examination of Figure 6 reveals that the OTC release kinetics exhibits an initial rapid release phase (s release) during a period of 5 h corresponding to the release of OTC entrapped at the surface of the CS microspheres. It appears that the drug release is faster at pH 1.2 (Figures 6a and 6b) than at pH 7.4 (Figures 6c and 6d) and in the presence of HMP as crosslinking agent. In fact, 49.5% OTC was released with (CS/OTC)/HMP compared to 45.5% OTC with (CS/OTC)/TPP at pH 1.2 while 40.2% OTC was released with (CS/OTC)/HMPS compared to 30.2% OTC with (CS/OTC)/TPP at pH 7.4. Expanded release stage is obtained with the double cross-linked CS beads (CS/ OTC/TPP)/GLU (27.1% at pH 1.2 and 12.6% at pH 7.4). The curves presented in Figure 6 show that the burst period is followed by sustainable and slow release phase giving highest cumulative drug amount. For example, 81.7% and 50.3% OTC was released after 25 h at pH 1.2 and pH 7.4 with (CS/OTC)/TPP, respectively, while 82.7% and 66.1% OTC was released at pH 1.2 and pH 7.4 with (CS/OTC)/HMP, respectively. The influence of pH on the OTC release can be attributed to the highest OTC solubility in acidic media and more important polymeric matrix erosion in such media.
Figure 6: Isothermal (37°) in vitro release kinetic profiles of OTC from CS microcapsules in simulated biological fluids at pH 7.4 and pH 1.2.
(a) and (b) Release profiles from loaded CS/TPP and CS/HMP cross-linked microcapsules at pH 1.2; (c) and (d) release profiles from loaded CS/TPP and CS/HMPS cross-linked microcapsules at pH=7.4.
-□- (CS/OTC)/HMP, -×- (Cs/OTC/GLU)/HMP, -▲- (CS/OTC)/(HMP)/GLU, -♦- (CS/OTC/HMP)/GLU -●- (CS/OTC)/TPP, -♦- (Cs/OTC/GLU)/TPP, -☼- (CS/OTC)/(TPP)/GLU, -⌂- (CS/OTC/TPP)/GLU.
Comparison of the matrix type release system, where OTC molecules are uniformly dispersed within the polymer matrices, shows that CS/HMP systems improve OTC release kinetics in relation to the CS/TPP systems. Addition of GLU as a second cross-linking agent increases the rigidity and the density of the CS membrane and, thus, reduces OTC diffusion from the polymeric network, particularly when GLU is used during the final treatment, i.e. in (CS/OTC/HMP)/GLU or in (CS/OTC/TPP)/GLU. The release percentage was lowered down to 52% for (CS/OTC/HMP)/GLU and nearly 18% for (CS/OTC/TPP)/GLU.
Swelling measurements (not shown here) on the various OTC carrying systems were found to be consistent with the release kinetics yields discussed above. In general, the polymer reticulation greatly lowers the degree of swelling [48]. The swelling behaviour, which can be attributed to the presence of ionisable groups within the gel structure [48,49], was obviously pH dependent and varying with CS cross-linking features. The lowest swelling level was found with double cross-linked CS beads as in (CS/OTC/TPP)/GLU, (CS/OTC/GLU)/ HMP and (CS/OTC)/(HMP/GLU) formulations and GLU free matrices such as (CS/OTC)/TPP or (CS/ OTC)/HMP give rise to highest swelling content. The TPP systems are found to swell better at pH 7.4, whereas, HMP systems swell better at pH 1.2. For both pH, the swelling capacity decreases in the order, (CS/OTC)/X>(CS/OTC/GLU)/X>(CS/OTC)/(X/ GLU)>(CS/OTC/X)/GLU, where X=TPP or HMP.
The release kinetic curves given in Figure 6 are consistent with a multi-step model in which diffusion of the drug from the membrane and the bulk degradation of the polymer may be the control parameters [50]. However, to investigate the mechanism of drug release from the microcapsules and due the fact that in most cases the theoretical concepts does not exist, the release data were analyzed using various empirical or semi-empirical equations which have proved to be very appropriate. Most of the mathematical models commonly used to determine the drug release from carrying dosage forms are listed in recent literature [29,51,52].
Preliminary calculations (data not shown) indicate that zero order, first order and Hopfenberg model kinetics were not satisfactory by fitting the experimental release data that have been obtained. The correlation coefficient value R2 found with these models was under 0.95. Diffusion controlled release following Higuchian kinetics or the derived equation of Baker-Lonsdale are consistent with the experimental results which indicate that the dissolution of drug occurs after effectively enclosed polymeric matrix and is not ready to dissolve from carrier surface. However, correlation coefficient less than 0.99 indicates that the drug release behaviour is not governed by the diffusion mechanism only [53]. Satisfactory correlation is also given with the Weibull equation which is however an empiric model. By far, the Makoid-Banakar, Peppas-Sahlin and Korsmeyer- Peppas equations provide the best fit as depicted in Table 2 and since these models fit very well the release data, it is possible to elucidate the mechanism of OTC release from the obtained carrying beads. Combination of more than one type of release phenomenon could be involved here. At first consideration, the release process can be driven by Fick diffusion and polymeric matrix relaxation and erosion in agreement with Korsmeyer- Peppas model, for example, when the polymer matrix swells the mobility of the chains increases allowing an easy penetration of the solvent. Thus, the Kick diffusion of the entrapped substrate is dependent on the solvent diffusion velocity, which is considered to be smaller than the polymeric relaxation velocity [54,55].
| model | pH 1.2 | pH 7.4 | ||||||
|---|---|---|---|---|---|---|---|---|
| (Cs/OTC)/TPP | (Cs/OTC/TPP)/Glu | (Cs/OTC)/(TPP/Glu) | (Cs/OTC/Glu)/TPP | (Cs/OTC)/TPP | (Cs/OTC/TPP)/Glu | (Cs/OTC)/(TPP/Glu) | (Cs/OTC/Glu)/TPP | |
| Higuchi KH |
(0.9795) 17.25 |
(0.9560) 8.71 |
(0.9862) 11.12 |
(0.9868) 16.01 |
(0.9825) 10.09 |
(0.9646) 6.73 |
(0.9971) 8.37 |
(0.9939) 9.69 |
| Weibull 1 α; β |
(0.9984) 4.67; 0.63 |
(0.9438) 14.98; 0.67 |
(0.9719) 11.44; 0.71 |
(0.9961) 5.93; 0.68 |
(0.9802) 9.65; 0.61 |
(0.9909) 44.75; 0.88 |
(0.9947) 16.49; 0.69 |
(0.9928) 11.71; 0.65 |
| Peppas-Sahlin1 K1; K2 m |
(1.0000) 25.14; 0.65 0.34 |
(0.9595) 8.27; 1.48 0.37 |
(0.9901) 11.74; 2.20 0.35 |
(0.9995) 20.07; 2.82 0.32 |
(0.9925) 11.87; 2.31 0.32 |
(0.9973) 4.01; 0.45 0.50 |
(0.9977) 6.83; 2.26 0.34 |
(0.9970) 9.89; 2.65 0.32 |
| Peppas-Sahlin2 K1; K2 |
(0.9994) 22.87; -1.34 |
(0.9566) 8.303; 0.07 |
(0.9869) 11.66; -0.09 |
(0.9988) 19.84; -0.84 |
(0.9879) 11.480; -0.23 |
(0.9973) 4.01/0.45 |
(0.9975) 8.05; 0.05 |
(0.9963) 10.61; -0.15 |
| Korsmeyer-Peppas KKP; n |
(1.0000) 25.41; 0.36 |
(0.9561) 8.64; 0.50 |
(0.9879) 12.54; 0.47 |
(0.9995) 21.71; 0.40 |
(0.9907) 12.98; 0.43 |
(0.9955) 3.53; 0.68 |
(0.9974) 7.95; 0.51 |
(0.9966) 11.25; 0.46 |
| Baker-Lonsdale KBL |
(0.9989) 0.008 |
(0.9455) 0.002 |
(0.9768) 0.003 |
(0.9984) 0.007 |
(0.9864) 0.002 |
(0.9434) 0.001 |
(0.9882) 0.002 |
(0.9937) 0.002 |
| Makoid-Banakar KMB; n |
(1.0000) 25.68; 0.35 |
(0.9690) 16.64; 0.19 |
(0.9945) 19.17; 0.26 |
(0.9996) 22.79; 0.37 |
(0.9975) 19.27; 0.24 |
(0.9984) 5.44; 0.49 |
(0.9975) 8.41; 0.50 |
(0.9968) 12.06; 0.42 |
Table 2: Release Rate Constants with Correlation Coefficient (R2) for Model Equations Fitting of Otc Release Data
CS microcapsules used as carriers and delivery systems for OTC have been characterized and the effect of different formulations on the drug release behaviour has been investigated. FTIR spectroscopy indicates the formation of ionic crosslinks between CS and anionic groups of TPP and HMP and characteristic FTIR bands of OTC observed in loaded blends suggest that the antibiotic is dispersed freely within the microcapsule without any significant interactions. This result has been confirmed by DSC experiments which evidenced the occurrence of homogeneous preparations. The successful release extent of OTC from cross-linked CS beads is affected significantly by pH and cross-linking agent. Makoid-Banakar, Peppas-Sahlin and Korsmeyer- Peppas models lead to the best fit of experimental data, indicating that the release process may be governed by concomitance of various phenomena like drug dissolution and diffusion, swelling, relaxation and erosion of the polymeric matrix.
Conflict of interest
There is no potential conflict of interest.
Financial support and sponsorship
Nill.
References
- Chopra I, Roberts M. Tetracycline antibiotics: mode of action, applications, molecular biology, and epidemiology of bacterial resistance. MicrobiolMolBiol Rev2001;65:232-60.
- Dax SL. Antibacterial chemotherapeutic agents. London: Blackie Academic and Professional; 1997.
- Finch RG. Tetracyclines, In: Grady FO', Lambert HP, Finch RG, Greenwood D, editors. Antibiotic and Chemotherapy, 7th ed. Philadelphia: WB Saunders Company; 1997.469-84.
- Schnappinger D, Hillen W. Tetracyclines: antibiotic action, uptake, and resistance mechanisms. Arch Microbiol1996;165:359-69.
- Sendil D, Gursel I, Wise DL, Hasýrcý V. Antibiotic release from biodegradable PHBV microparticles. J Control Release 1999;59:207-17.
- Hejazi R, Amiji M. Stomach specific anti H. pylori therapy. I: preparation and characterization of tetracycline loaded chitosan microspheres. Int J Pharm 2002;235:87-94.
- Cruz MC, Ravagnani SP, Brogna FM, Campana SP, Triviño GC, Lisboa AC. Evaluation of the diffusion coefficient for controlled release of oxytetracycline from alginate/chitosan/poly (ethylene glycol) micro beads in simulated gastrointestinal environments. BiotechnolApplBiochem 2004;40:243-53.
- Ta HT, Dass CR, Dunstan DE. Injectable chitosan hydrogels for localised cancer therapy. J Control Release2008;126:205-16.
- Ravi Kumar MNV, Bakowsky U, Lehr CM. Preparation and characterization of cationic PLGA nanospheres as DNA carriers. Biomaterials 2004;25:1771-7.
- Felt O, Gurny R, Baeyens V. Delivery of antibiotics to the eye using a positively charged polysaccharide as vehicle. AAPS PharmSci2001;3:87-93.
- Maestrelli F, Garcia-Fuentes M, Mura P, Jose´ Alonso M. A new drug nanocarrier consisting of chitosan and hydoxypropylcyclodextrin. Eur J Pharm Biopharm 2006;63:79-86.
- Giri TK, Thakur A, Alexander A, Badwaik H, Tripathi DK. Modified chitosan hydrogels as drug delivery and tissue engineering systems: present status and applications. ActaPharmaceuticaSinica B 2012;2:439-49.
- Patel MP, Patel RR, Patel JK. Chitosan mediated targeted drug delivery system: A Review.J Pharm PharmaceutSci 2010;13:536-57.
- Riva R, Ragelle H, des Rieux A, Duhem N, Jérôme C, Préat V. Chitosan and chitosan derivatives in drug delivery and tissue engineering in. AdvPolymSci 2011;244:19-44.
- Sonia TA, Sharma CP. Chitosan and its derivatives for drug delivery perspective. AdvPolymSci 2011;243:23-54.
- Shashiwa H, Shegemasa Y, Roy R. Chemical modification of chitosan 11: chitosan-dendrimer hybrid as a tree like molecule. CarbohydrPolyms 2002;49:195-205.
- Dastan T, Turan K. In vitrocharacterization and delivery of chitosan DNA microcapsules into mammalian cells. J Pharm PharmSci 2004;7:205-14.
- George M, Abraham TE. Polyionic hydrocolloids for the intestinal delivery of protein drugs: Alginate and chitosan: a review. J Control Release 2006;114:1-14.
- Hejazi R., Amiji M. Stomach specific anti H. pylori therapy part III: Effect of chitosan microspheres crosslinking on the gastric residence and local tetracycline concentrations in fasted gerbils. Int J Pharm 2004;272:99-108.
- Berger J, Reist M, Mayer JM, Felt O, Peppas NA, Gurny R. Structure and interactions in covalently and ionicallycrosslinked chitosan hydrogels for biomedical applications. Eur J Pharm Biopharm 2004;57:19-34.
- Ko JA, Park HJ, Hwang SJ, Park JB, Lee JS. Preparation and characterization of chitosan microparticles intended for controlled drug delivery. Int J Pharma 2002;249:165-74.
- Shu XZ, Zhu KJ. A novel approach to prepare tripolyphosphate/chitosan complex beads for controlled release drug delivery. Int J Pharma 2000;201:51-8.
- Gupta KC, Jabrail FH. Preparation and characterization of sodium hexametaphosphate cross linked chitosan microspheres for controlled and sustained delivery of centchroman. Int J BiolMacromol2006;38:272-83.
- Kleine-Brueggeney H, Zorzi GK, Fecker T, El Gueddari NE, Moerschbacher BM, Goycoolea FM. A rational approach towards the design of chitosan based nanoparticles obtained by ionotropic gelation. Colloids Surf Biointerfaces 2015;135:99-108.
- Saccoa P,Paolettia S, Coka M, Asarob F, Abramic M, Grassid M, et al. Insight into the ionotropic gelation of chitosan using tripolyphosphate and pyrophosphate as cross-linkers. Int J BiolMacromol 2016;92:476-83.
- Patel MA, AbouGhaly MHH, Schryer-Praga JV, Chadwick K. The effect of ionotropic gelation residence time on alginate cross-linking and properties. CarbohydrPolym 2017;155:362-71.
- Pati F, Adhikari B, Dhara S. Development of chitosan-tripolyphosphatefibers through pH dependent ionotropicgelation. Carbohydr Res 2011;346:2582-8.
- Leong JY, Lam WH, Ho KW, Voo WP, Lee MFX, Lima HP, et al. Advances in fabricating spherical alginate hydrogels with controlled particle designs by ionotropic gelation as encapsulation systems. Particuology 2016;24:44-60.
- Yong Z, Meirong H, Jianping Z, Aifeng Z, Weize L, Chengli Y. An add-in program for modeling and comparison of drug dissolution profiles. AAPS J 2010;12:263-71.
- Peniche-Covas C, Argüelles-Monal W, Román JS. A kinetic study of the thermal degradation of chitosan and a mercaptan derivative of chitosan. PolymDegrad Stab 1993;39:21-28.
- Britto D, Campana-Filho SG. A kinetic study on the thermal degradation of N,N,N-trimethylchitosan. PolymDegrad Stab 2004;84:353-61.
- Neto CGT, Giacometti JA, Job AE, Ferreira FC, Fonseca JLC, Pereira MR. Thermal analysis of chitosan based networks. CarbohydrPolym, 2005;62:97-103.
- Pawlak A, Mucha. Thermogravimetric and FTIR studies of chitosan blends. ThermochimActa 2003;396:153‑66.
- K Nakamoto. Infrared and Raman Spectra of Inorganic and Coordination Compounds, Part A Theory and Applications in Inorganic Chemistry. 6thed. Hoboken, NJ: Wiley Interscience; 2008.
- Pieróg M, Gierszewska-Drużyńska M, Ostrowska-Czubenko J. Effect of ionic crosslinking agents on swelling behaviour of chitosan hydrogel membranes. PCACD 2009;14:75-82.
- He Z, Honeycutt CW, Xing B, McDowel RW, Pellechia PJ, Zhang T. Solid-state Fourier transform infrared and 31P nuclear magnetic resonance spectral features of phosphate compounds.Soil Sci 2007;172:501-15.
- Gierszewska-Drużyńska M, Ostrowska-Czubenko J. The effect of ionic crosslinking on thermal properties of hydrogel chitosan membranes. PCACD 2010;15:25-32.
- Ribeiro AJ, Silva C, Ferreira D, Veiga F. Chitosan-reinforced alginate microspheres obtained through the emulsification/internal gelation technique. Eur J Pharm Sci 2005;25:31-40.
- Sakurai K, Maegawa T, Takahashi T. Glass transition temperature of chitosan and miscibility of chitosan/poly (N-vinyl pyrrolidone) blends.Polymer 2000;41:7051-6.
- Zeng M, Fang Z, Xu C. Effect of compatibility on the structure of the microporous membrane prepared by selective dissolution of chitosan/synthetic polymer blend membrane. J MembrSci 2004;230:175-81.
- Kittur FS, Harish Prashanth KV, UdayaSankar K, Tharanathan RN. Characterization of chitin, chitosan and their carboxymethyl derivatives by differential scanning calorimetry. CarbohydrPolym 2002;49:185-93.
- Pieróg M, Ostrowska-Czubenko J, Gierszewska-Drużyńska M. Thermal degradation of double cross-linked hydrogel chitosan membranes. PCACD2012;17:67-74.
- Wanjun T, Cunxin W, Donghua Ch. Kinetic studies on the pyrolysis of chitin and chitosan. PolymDegr Stab 2005;87:389-94.
- Lopez FA, Merce ALR, Alguacil FJ, Lopez-Delgado A. A kinetic study on the thermal behaviour of chitosan. J Therm Anal Calorim 2008;91:633-9.
- Zawadzki J, Kaczmarek H. Thermal treatment of chitosan in various conditions. CarbohydrPolym 2011;89:395-401.
- Zeng L, Qin C, Wang L, Li W. Volatile compounds formed from the pyrolysis of chitosan. CarbohydrPolym 2011;83:1553-7.
- Fernandes NS, Filho MASC, Mendes RA, Ionashiro M. Thermal Decomposition of Some Chemotherapic Substances. J BrazChemSoc 1999;10:459-62.
- Mao J, Kondu S, Ji H-F, McShane MJ. Study of the near-neutral pH-sensitivity of chitosan/gelatin hydrogels by turbidimetry and microcantilever deflection. BiotechnolBioeng 2006;95:333-41.
- Ray M, Pal K, Anis A, Banthia AK. Development and Characterization of Chitosan-Based Polymeric Hydrogel Membranes. Des Monomers Polym 2010;13:193-206.
- Siegel RA, Rathbone MJ. Overview of controlled release mechanisms. In: Siepmann J, Siegel RA, Rathbone MJ, editors. Fundamentals and Applications of Controlled Release Drug Delivery. New York: Springer US; 2012. p.19-43.
- Pepas NA, Sahlin JJ. A simple equation for the description of solute release III: Coupling of diffusion and relaxation. Int J Pharm, 1989;57:169-72.
- Makoid MC, Dufour A, Banakar UV.Modelling of dissolution behaviour of controlled release systems. STP Pharma 1993;3:49-58.
- Pardakhty A, Varshosaz J, Rouholamini A. In vitrostudy of polyoxyethylene alkyl ether niosomes for delivery of insulin. Int J Pharm 2007;328:130-41.
- Masaro L, Zhu XX. Physical models of diffusion for polymer solutions, gels and solids. ProgPolymSci2007;24:731-75.
- Ritger PL, Peppas NA. A simple equation for description of solute release. Fickian and anomalous release from swellable devices. J Control Release1987;5:37-42.
 Chitosan;
  CS/HMP;
  CS/OTC/HMP;
  OTC.
OTC.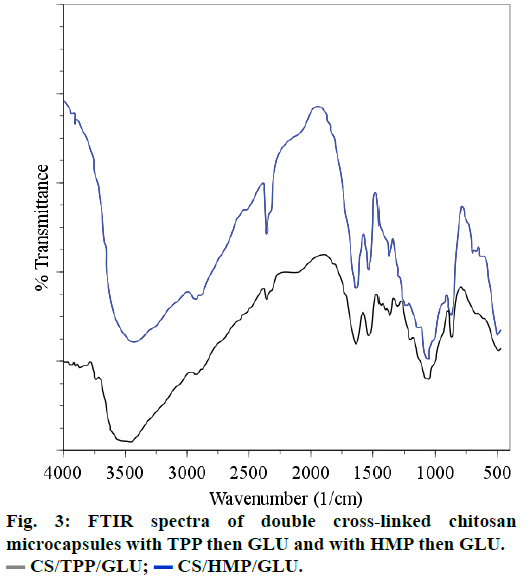
 (CS/OTC/TPP)/GLU;
  (CS/HMP) → OTC;
  (CS/HMP)/GLU → OTCCS.