- *Corresponding Author:
- S. Kumar
Division of Clinical Pharmacology, Department of Medicine, University of Stellenbosch, Cape Town, 7505, South Africa
E-mail: saneesh.7.kumar@gmail.com
| Date of Submission | 13 September 2016 |
| Date of Revision | 31 December 2016 |
| Date of Acceptance | 06 April 2017 |
| Indian J Pharm Sci 2017;79(3):353-360 |
This is an open access article distributed under the terms of the Creative Commons Attribution-NonCommercial-ShareAlike 3.0 License, which allows others to remix, tweak, and build upon the work non-commercially, as long as the author is credited and the new creations are licensed under the identical terms
Abstract
A simple, rapid and stable high performance liquid chromatography method for a combination of efavirenz, its major metabolite 8-hydroxy efavirenz and neostigmine was developed and validated. The drugs individually and in combination, were analysed using an Agilent 1260 high performance liquid chromatography coupled with variable wavelength detector. Successful separation of combined drugs were achieved by gradient elution on a reverse-phase C18 Phenomenex Evo 100A column (150ï?´4.6 mm, 2.6 μ), by gradient elution using a mobile phase consisting of water:acetonitrile at 0.6 ml min-1 flow rate, detection wavelength 245 nm, column oven temperature 27° and injection volume 15 μl. The same method was also deployed on a Restek Ultra biphenyl column (150ï?´4.6 mm, 5 μ) to compare the levels of separation of the drugs and the metabolite. The chromatographic retention times were consistent at 8.75, 9.33 and 10.20 min for efavirenz, 8-hydroxy efavirenz and neostigmine, respectively. Polynomial regression data for the calibration plots exhibited linear relationship (correlation coefficient=0.999) in the range of 2.5-150 μM for both efavirenz and 8-hydroxy efavirenz, and the lower limit of detection and lower limit of quantification at 32 μM and 96.97 μM for efavirenz and 29.49 μM and 89.38 μM for 8-hydroxy efavirenz, respectively. Pharmacological drug metabolism evaluation was done on the method specificity using in vitro incubations using human liver microsomes and linearity was established for the 30, 45 and 60 min incubations (correlation coefficient=0.97). The method provides a necessary tool to investigate herb and drug-drug interactions and can be applied for quantifying the drugs in in vitro drug metabolism assays.
Keywords
HPLC, C18, efavirenz, 8-hydroxy efavirenz, neostigmine, biphenyl column, human liver microsomes
Efavirenz (EFV, C14H9ClF3NO2) is an antiretroviral (ARV) agent employed in the treatment of human immunodeficiency virus (HIV) type 1 in combination with other drugs. It is an analogue of non-nucleoside ARV agent and a non-competitive reverse transcriptase inhibitor and is directly connected to the enzyme and blocks RNA and DNA-dependent, DNA-polymerase activities, causing destruction of the enzyme catalytic site. Chemically it is (S)-6-chloro-(cyclopropylethynyl)- 1,4-dihydro-4-(trifluoromethyl)-2H-3,1-benzoxazin- 2-one and is optically active with a molecular weight of 315.68 g/mol and melting point in the range 139- 141°. This crystalline powder has a white or slightly yellowish appearance. The substance has a melting point ranging from 136-141°, is nearly water insoluble but soluble in methanol and dichloromethane [1]. EFV is predominantly cleared by hepatic metabolism [2]. The metabolites identified in human plasma and urine (almost exclusively as glucuronide or sulphate conjugates) were 7- and 8-hydroxy efavirenz (primary metabolites) and 8,14-dihydroxy efavirenz (secondary metabolite). 8-hydroxy efavirenz (E8H, C14H9ClF3NO3) is the major metabolite from EFV primarily formed via CYP2B6 of the cytochrome P450 system [3]. It has the IUPAC name (4S)-6-chloro-4-(2- cyclopropylethynyl)-7-hydroxy-4-(trifluoromethyl)- 1H-3,1-benzoxazin-2-one with molecular weight 331.675 g/mol and melting point in the range of 186- 188°. Several analytical methods have been previously reported for the determination of EFV in human plasma, using either high-performance liquid chromatography using ultra-violet detection (HPLC-UV) [4-6] or liquid chromatography with mass spectrometric (LC-MS) detection [2,7]. HPLC-UV is, owing to its lower cost and greater robustness, still widely used for relatively less complex bioanalytical assays [8]. Also HPLC methods have already been developed to detect and separate EFV and its major metabolites [3]. This is of critical importance especially in assays involving human liver microsomes (HLM), to identify the metabolites and also quantify the rate of drug metabolism. Metabolites may interfere when analysing parent drugs [9]. It is important that potential interferences from all these compounds are part of the method. Drugs entering the body undergo biotransformation via phase I and phase II metabolic pathways. Based on the nature of the chemical reactions involved, metabolites formed from phase I reactions are more likely to be chemically reactive or pharmacologically active and therefore, more likely to need safety evaluation [10].
Neostigmine methyl sulphate (NEO, C13H22N2O6S) with molecular weight 334.387 g/mol, IUPAC name [3-(dimethylcarbamoyloxy)phenyl]-trimethylazanium; methyl sulphate and melting point in the range of 145- 149°, is a cholinesterase inhibitor used in the treatment of myasthenia gravis and to reverse the effects of muscle relaxants such as gallamine and tubocurarine. Studies have shown that, just as in myasthenia gravis, most of the lymphocytic infiltrate in HIV-1 infected thymuses is located within the perivascular space surrounding the thymic epithelium and contains peripheral CD8 cytotoxic T lymphocyte (CTL) effector cells [11]. The co-administration of neostigmine and ARVs in such cases has proven to be more effective [12].
The present study describes an HPLC-variable wavelength detector (VWD) method for the detection, separation and quantitation of EFV and E8H standard drugs, that is rapid with a shorter analysis time and selective in the presence of not only first-line ARV but also reversible acetylcholinesterase inhibitor drugs such as NEO as an internal standard. Also, a comparison of the separation methodology is achieved using a C18 column and a biphenyl column, since biphenyl columns have the capability to give better separation for compounds with ring structure. The method specificity is validated using in vitro HLM assays to analyse the robustness of the method to separate the drug, metabolite and the internal standard in exact consistency as the standards, in a complex matrix comprising of other sub-metabolites/cofactors facilitating the metabolism. The method is also unique in the sense it deploys a reverse phase gradient involving normal HPLC solvents and no buffers, unlike the other HPLC methods available today. The separation of the drug, its metabolite and the internal standard is satisfactorily stable and there is minimal interference from other sub-metabolites and cofactors involved in the actual HLM drug metabolism assays.
Materials and Methods
Pure E8H and NEO were obtained from Clearsynth Labs Ltd. (Mumbai, India) while EFV was obtained from Sigma-Aldrich (Steinheim, Germany). HPLCgrade acetonitrile and methanol was purchased from Sigma-Aldrich (Steinheim, Germany). High purity water was prepared by passage through a Millipore system (Millipore, Billerica, MA, USA) and was used as the mobile phase. The HLM screening was performed using pooled HLM (mixed gender) from Xenotech LLC, USA along with glucose-6-phosphate sodium salt, glucose-6-phosphate dehydrogenase, magnesium chloride, phosphate buffer solution 1 M and β-nicotinamide adenine dinucleotide phosphate hydrate (NADPH) from Sigma-Aldrich (Steinheim, Germany).
All stock solutions for the drugs were prepared in 4 mM concentrations, in methanol and the dilutions were made from the same with diluents: a mixture of mobile phase water and acetonitrile in the ratio 50:50 v/v for the C18 column tests and water:methanol in the ratio 50:50 v/v for the biphenyl column tests. All solutions were freshly prepared and filtered using 0.22 μ syringe filters, before use.
HPLC system used for method development and validation was Agilent Technologies 1260 Infinity module comprising of binary pump and degasser unit, combined with Agilent 1100 Series autosampler, autoinjector, column oven and VWD. The output signal was monitored and processed using Open Labs CDSChemstation Agilent software. A Phenomenex-Evo 100A C18 and a Restek Ultra Biphenyl column were used for the LC studies and method development.
Detection, separation methods and validation
Satisfactory separations were achieved on the C18 column (150×4.6 mm, 2.6 μ), by gradient elution using mobile phase comprising of water (A):acetonitrile (B) at a flow of 0.6 ml×min-1. The gradient solvent program was set as (TT min/% solution B) and 0/10, 5/80, 10/95, 11.5/10, 12.5/10. The detection wavelength was 245 nm. All mobile phases were filtered using 0.22 μm filter papers (Kimix Chemical and Lab Supplies, Cape Town, South Africa). The column oven temperature was maintained at 27° and the injection volume was 15 μl. A post runtime of 3 min was maintained between each injection.
The second separation was achieved on the biphenyl column (150×4.6 mm, 5 μ), by same gradient elution solvents program as above, but with a mobile phase comprising of acetonitrile (A):methanol (B) instead of water, at a flow of 1 ml×min-1 for a 15 min run. The detection wavelength was maintained at 245 nm, with the same gradient A:B flow ratio as on the C18 column. The parameters for the HPLC runs were varied for both the columns (Table 1).
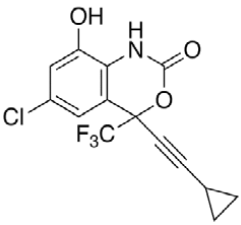
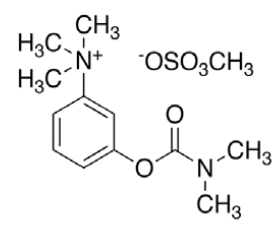
| Reference standard drug | Efavirenz | 8-Hydroxy efavirenz | Neostigmine methyl sulphate | |
|---|---|---|---|---|
| Structure | 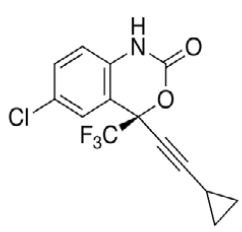 |
 |
 |
|
| Chemical formula | C14H9ClF3NO2 | C14H9ClF3 NO3 | C13H22N2O6S | |
| Column | Phenomenex-Evo 100A C18 column (150´4.6 mm, 2.6 μ) |
Restek ultra biphenyl column (150´4.6 mm, 5 μ) |
||
| Flow rate | 0.6 ml×min-1 | 1 ml×min-1 | ||
| Run time | 12.5 min | 15 min | ||
| Injection | 15 μl | 15 μl | ||
| Mobile phase (gradient) |
Water:acetonitrile 90:10 (0 min)→20:80 (5 min)→5:95 (10 min)→90:10 (11.5-12.5 min) |
Acetonitrile:methanol 90:10 (0 min)→20:80 (5 min)→5:95 (10 min)→90:10 (12.5-15 min) |
||
| Temperature | 27° | 27° | ||
| Wavelength | 245 nm | 245 nm | ||
HPLC parameters for separation method for both C18 column and biphenyl column, structure of efavirenz, 8-hydroxy efavirenz and neostigmine
Table 1: The HPLC-VWD parameters for separation method
The method was validated for accuracy, linearity and precision. Limit of detection (LOD) and limit of quantification (LOQ) were determined based on signalto- noise ratio of 3 and 10, respectively, as per ICH guidelines [13]. The signal-to-noise ratio was determined by comparing measured signals from samples with known lowest concentrations of analyte with those of blank samples following three replicate injections and establishing the minimum concentration at which the analyte can be reliably detected or quantified. The method was validated for specificity using HLM assay, by incubating EFV as the substrate and NEO as the internal standard. Briefly, a standard 200 μl incubation mixture containing liver microsomes (0.5 mg/ml protein concentration), EFV (100 μM) in 0.2 M phosphate buffer pH 7.4 at 37° was incubated for 30, 45 and 60 min, in duplicate. The reactions were initiated with NADPH (final concentration 1.3 mM) along with the co-factors MgCl2 (final concentration 3.3 mM), glucose-6-phosphate (final concentration 1.3 mM) and glucose-6-phosphate dehydrogenase (1 U/ml) and then terminated with 200 μl of chilled acetonitrile spiked with the internal standard NEO (10 μM). The samples were centrifuged at 10 000 rpm for 10 min and the supernatants were filtered in 0.22 μm centrifuge tube filters (Corning® Costar® Spin-X® cellulose acetate membrane filters) and were subjected to HPLC analysis.
Results and Discussion
The literature search indicated that many HPLC methods were available for individual and a combination of two drugs. Based on the literature search, attempts were made to develop a simple method, which had less retention time and higher selectivity. Efforts were made to develop an isocratic method, but separation of the three drugs was not satisfactory; hence, gradient elution was selected [14]. Method optimization was done by different logical modifications such as change in column length (100, 150 and 250 mm), inner diameter (2.6 and 4.6 mm), particle size (2.6, 3.5 and 5 μ) and change in the gradient program. The results looked more stable in this method, suggesting that factors such as gradient methodology, mobile phases, column length, inner diameter and particle size were also decisive in better separation of these drugs and the conditions were found sufficient for the proposed method.
The separation of all the drugs was consistent and reproducible in both columns but the C-18 column had a shorter run time (Figures 1 and 2) compared to the biphenyl column (Figure 3). The HPLC retention times were consistent at 8.75, 9.33 and 10.20 min for EFV, E8H and NEO, respectively for the C18 column (Table 2). The C18 column was also consistent with lower concentrations of both EFV and E8H and provided faster separation compared to the biphenyl column. Hence the C18 column was used for further runs and method validation.

Figure 1: HPLC chromatographic separation of E8H, EFV and NEO using the C18 column
Representative chromatogram of standards at 4 mM concentration and their retention times on the C18 column, where efavirenz
at 9.32 min, 8-hydroxy efavirenz at 8.78 min and neostigmine at 10.16 min

Figure 2: HPLC separation of E8H, EFV and NEO using the C18 column
Representative chromatogram of standards at 200 μM concentration and their retention times on the C18 column, where
efavirenz at 9.36 min, 8-hydroxy efavirenz at 8.75 min and neostigmine at 10.18 min

Figure 3: HPLC separation of E8H, EFV and NEO using the biphenyl column
Representative chromatogram of standards at 4 mM concentration and their retention times on the biphenyl column, where
efavirenz at 10.23 min, 8-hydroxy efavirenz at 9.21 min and neostigmine at 12.67 min
| Column | Phenomenex-Evo C18 100A column (150×4.6 mm, 2.6 μ) |
Restek ultra biphenyl column (150×4.6 mm, 5 μ) |
||||
|---|---|---|---|---|---|---|
| Drug | EFV | E8H | NEO | EFV | E8H | NEO |
| Retention time (min) | 8.75 | 9.33 | 10.20 | 9.20 | 10.22 | 12.66 |
| Overall run time (min) | 12.5 | 15 | ||||
HPLC overall run-time and retention times for efavirenz, 8-hydroxy efavirenz and neostigmine on both C18 and biphenyl columns
Table 2: HPLC-VWD run retention times for both columns
A linear response was obtained in the concentration 2.5 150 μM for both EFV and E8H (R2=0.99). NEO was maintained in same concentration in all HPLC runs, since the principle behind using this drug would be as an internal standard in the studies on drug metabolism using HLMs and the concentration of EFV used would be in the range of 50-100 μM. LOD and LOQ were calculated at 32.33 and 96.97 μM for EFV and 29.49 and 89.38 μM for E8H, respectively. The results of the system suitability tests and the regression statistics (Table 3) assure the adequacy of the proposed HPLC method for routine analysis of EFV, E8H and NEO alone or in combination.
| Statistical criteria | EFV | E8H |
|---|---|---|
| Linearity range (μM) | 2.5-150 | 2.5-150 |
| Linear correlation coefficient (R2) | 0.915713 | 0.9275 |
| Polynomial correlation coefficient (R2) | 0.9993 | 0.9991 |
| Standard error | 116.6889 | 54.2463246 |
| Intercept coefficient | -88.722 | -44.78345 |
| LOD (μM) | 32.33 | 29.49 |
| LOQ (μM) | 96.97 | 89.38 |
| %RSD | 0.918 | 0.982 |
Limit of detection (LOD) and limit of quantification (LOQ) and regression data for both efavirenz and 8-hydroxy efavirenz chromatograms
Table 3: Regression statistics for standards on c18 column
The percent relative standard deviation (RSD) values for intraday precision for both the standards as well as the in vitro incubation supernatants were less than 1%. Intermediate precision was determined by carrying out the experiment by on a different system (HPLC Waters HPLC 2695 with 2996 PDA). Almost similar retention time was observed for all the three drugs.
Robust analytical methods are required in quality control laboratories for routine use, as well as in experiments involving drug interaction studies. After finalizing the mobile phase composition and column, statistically designed experiments were performed to screen robustness of an analytical method and to select the appropriate system suitability parameters. The use of the design of experiments (DOE) is essential in the robustness evaluation of method conditions and provides significant knowledge to establish optimal robust operating conditions as well as identify potential failure modes. Various parameters such as flow rate of the mobile phase through the column, temperature of the column chamber and the detection wavelength were varied to validate the overall robustness of the method and the values for each factor showed consistent results (Table 4).
| Parameter | Variation | Retention time (min) | ||
|---|---|---|---|---|
| EFV | E8H | NEO | ||
| Flow rate | 0.6 ml×min-1 0.7 ml×min-1 0.8 ml×min-1 |
8.75 | 9.33 | 10.20 |
| 8.62 | 9.21 | 10.10 | ||
| 8.53 | 9.12 | 10.01 | ||
| Temperature | 27° 30° 32° |
8.75 | 9.33 | 10.20 |
| 8.69 | 9.39 | 10.28 | ||
| 8.79 | 9.21 | 10.19 | ||
| Wavelength | 245 nm 247 nm 250 nm |
8.75 | 9.33 | 10.20 |
| 8.70 | 9.28 | 10.29 | ||
| 8.69 | 9.39 | 10.31 | ||
| %RSD retention time | 0.918 | 0.982 | 0.935 | |
Table 4: Robustness evaluation parameters for C18 column runs
The applicability of the validated HPLC method for pharmacological drug metabolism studies was tested using in vitro human liver microsomal incubation assay. For all the three time slot incubations (30, 45 and 60 min), the metabolite E8H was detected using this method at consistent retention times along with EFV, NEO and the peak area of NEO was relatively constant (Figure 4). Linearity was established for the 30-60 min incubation range based on the ratio of the metabolite to the internal standard, with R2=0.97 (Table 5).

Figure 4: HPLC separation of E8H, EFV and NEO using the C-18 column, for the in vitro HLM-EFV incubation sample
Representative chromatogram of supernatant from HLM assay and the retention times of the resultant on the C18 column, where
efavirenz at 9.39 min, 8-hydroxy efavirenz at 8.76 min and neostigmine at 10.19 min
| Statistical criteria | E8H:NEO Ratio |
|---|---|
| Incubation time-linearity range (min) | 30,45 and 60 |
| Linear correlation coefficient (R2) | 0.968 |
| Standard error | 0.001 |
| Intercept coefficient | 0.0082 |
| %RSD retention times | 0.23 0.45 0.16 (EFV) (E8H) (NEO) |
Regression data for efavirenz, 8-hydroxy efavirenz and neostigmine in the in vitro assay analysis-chromatograms for the 30, 45 and 60 min incubations
Table 5: Regression statistics of in vitro assays
The understanding gained from the method development and the robustness of experiments enabled a choice of column for optimised resolution and provided assurance of separation of all the drugs, within a shorter run time. The chromatography yielded well-resolved peaks for EFV, E8H and NEO, with good accuracy, precision and recovery and the same was validated for specificity on the HLM incubations, where the results proved consistent. This HPLC-VWD method is suitable for therapeutic drug monitoring in patients with HIV/AIDS alone or co-infected with myasthenia gravis in a less resourced setting, studies involving in vitro metabolism of EFV and its major metabolites, as well as warranted in pharmacokinetic studies involving drug-drug and herb-drug interactions. Very few gradient methods were available on the HPLC-VWD for the separation of EFV and its major metabolites from in vitro assays involving HLM; the novelty of this method being the only reversegradient method using normal solvents (no buffers or formic acid) such as acetonitrile and water/methanol for a perfect separation of EFV and E8H, along with NEO as a marker internal standard on a C18 EVO 2.6 μ column as well as a biphenyl 5 μ column. The success of this method in handling a complex matrix as the in vitro assay sample, by separating the drug/ metabolite phase and the internal standard phase from the other components of the assay without using SPE methodologies, makes it simple, efficient and less time consuming.
Acknowledgments
The authors are grateful to the National Research Foundation Agency of South Africa (NRF IKS Grant No: 82641) for the funding. The authors also wish to thank the representatives of LECO Africa, Cape Town in association with Restek Corporation USA, for all their support in the supply of the column and the research study.
Financial assistance
This research is funded by the National Research Foundation agency of South Africa, Indigenous Knowledge Systems, Grant No: 82641.
Conflict of interests
None declared.
References
- De Clercq E. Antiviral drugs: current state of the art. J Clin Virol 2001;22:73-89.
- Mutlib AE, Chen H, Nemeth GA, Markwalder JA, Seitz SP, Gan LS, et al. Identification and characterization of efavirenz metabolites by liquid chromatography/mass spectrometry and high field NMR: species differences in the metabolism of efavirenz. Drug Metab Dispos 1999;27:1319-33.
- Ward BA, Gorski JC, Jones DR, Hall SD, Flockhart DA, Desta Z. The cytochrome P450 2B6 (CYP2B6) is the main catalyst of efavirenz primary and secondary metabolism: implication for HIV/AIDS therapy and utility of efavirenz as a substrate marker of CYP2B6 catalytic activity. J Pharmacol Exp Ther 2003;306:287-300.
- Mogatle S, Kanfer I. Rapid method for the quantitative determination of efavirenz in human plasma. J Pharma Biomed Anal 2009;49:1308-12.
- Ramachandran G, Kumar AK, Swaminathan S, Venkatesan P, Kumaraswami V, Greenblatt DJ. Simple and rapid liquid chromatography method for determination of efavirenz in plasma. J Chromatogr B Analyt Technol Biomed Life Sci 2006;835:131-5.
- Saras-Nacenta M, Lopez-Pua Y, Lopez-Cortes LF, Mallolas J, Gatell JM, Carne X. Determination of efavirenz in human plasma by high performance liquid chromatography with ultraviolet detection. J Chromatogr B Biomed Sci Appl 2001;763:53-9.
- Ogburn ET, Jones DR, Masters AR, Xu C, Guo Y, Desta Z. Efavirenz primary and secondary metabolism in vitro and in vivo: identification of novel metabolic pathways and cytochrome P450 2A6 as the principal catalyst of efavirenz 7-hydroxylation. Drug Metab Disp 2010;38:1218-29.
- Önal A. Analysis of antiretroviral drugs in biological matrices for therapeutic drug monitoring. J Food Drug Anal 2006;14:99-119.
- Dimeski G. Interference testing. Clin Biochem Rev 2008;29:43-8.
- https://www.fda.gov/downloads/Drugs/.../Guidances/ucm079266.pdf.
- Haynes BF, Hale LP, Weinhold KJ, Patel DD, Liao HX, Bressler PB, et al. Analysis of the adult thymus in reconstitution of T lymphocytes in HIV-1 infection. J Clin Invest 1999;103:453-60.
- Gorthi SP, Shankar S, Johri S, Mishra A, Chaudhary NR. HIV infection with myasthenia gravis. J Assoc Physicians India 2005;53:995-6.
- https://www.ich.org/fileadmin/Public_Web_Site/ICH_Products/Guidelines/Quality/Q2_R1/Step4/Q2_R1__Guideline.pdf.
- Varghese A, Pandita N, Gaud RS. In vitro and in vivo Evaluation of CYP1A Interaction Potential of Terminalia arjuna Bark. Indian J Pharm Sci 2014;76:138-47.