- *Corresponding Author:
- Madhuri Ramteke
Department of Pharmaceutical Sciences, Mahatma Jyotiba Fuley Shaikshanik Parisar, Amravati Road, Nagpur440 033, India.
E-mail: madhurishende@rediff.com
| Date of Submission | 10 January 2005 |
| Date of Revision | 06 August 2005 |
| Date of Acceptance | 16 June 2006 |
| Indian J Pharm Sci, 2006, 68 (3): 394-396 |
Abstract
Simple, accurate, and precise UV-Spectrophotometric method was developed for the estimation of atenolol and amlodipine besylate in tablets. The standard stock solutions of atenolol and amlodipine besylate as well as mixed standard solution were diluted appropriately. The absorption spectra of the resultant solutions of atenolol and mixed standard solution were obtained by scanning between 264 to 308 nm against solvent blank. The spectra thus obtained was derivatised to obtain third order derivative [Dl (N) = 2] spectra. A tangent was drawn through the two satellite minima (DL 278.5 nm and DH ~286 nm). An altitude was drawn through this tangent to the inverted maxima termed as DB (~282 nm). The peak height was measured in mm and plotted against respective concentrations. The absorbances of the resultant solutions of amlodipine besylate as well as mixed standard solutions were read at 361 nm. A graph of concentration versus peak height in mm for atenolol was constructed. The E1cm value was calculated for amlodipine besylate at 361 nm. Atenolol was estimated in tablets by interpolation on the calibration curve. The concentration of amlodipine besylate in tablets was determined by E1cm. The proposed analytical method was found to be accurate, precise, and reproducible.
Introduction
Atenolol [1] is an antihypertensive, antianginal, and antiarrhythmic drug; chemically, it is 4-(2-hydroxy-3-isopropyl aminopropoxy)-phenyl acetamide. Amlodipine besylate [2] is calcium antagonist and chemically, it is 3-ethyl-5-methyl-(4 RS)-2-[(2-amino ethoxy) methyl]-4-(2-chlorophenyl)-6-methyl-1,4-dihydropyridine-3,5-dicarboxylate benzene sulphonate. The IndianPharmacopoeia describes non-aqueous titration methodfor the assay of atenolol. The British Pharmacopoeiaexamines amlodipine besylate by liquid chromatography.HPLC [3], reversed phase HPLC [4], colorimetric method [5-7], HPTLC [8,9], gas liquid chromatography [10], difference spectrophotometric estimation [11] are few of the methods reported in literature for the analysis of atenolol and amlodipine besylate from their respective formulations. HPTLC [12], reversed phase HPLC [13], and HPTLC [14] methods are reported for simultaneous estimation of atenolol and amlodipine besylate in combined dosagec form, but no method is reported for simultaneous estimation of these drugs in combination by spectrophotometry [15] and hence the present work was undertaken.
Spectral and absorbance measurements were made on Shimadzu UV-1601 (Japan) UV/Vis spectrophotometer with 10 mm matched quartz cells. Dhona 100 DS analytical balance was used for weighing the samples. Gift samples of atenolol and amlodipine besylate were obtained from M/s Torrent Pharmaceuticals Ltd. and Sun Pharmaceutical Industries Ltd., respectively. Methanol used was of analytical grade and obtained from Qualigens Fine Chemicals, Mumbai. Two different brands of tablets each containing 50 mg of atenolol and 2.5 mg of amlodipine besylate were procured from the local market.
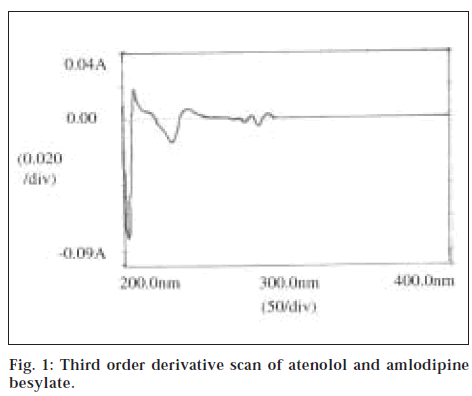
Standard stock solutions of atenolol and amlodipine besylate were prepared separately by dissolving 100 mg of each drug in 100 ml methanol (1 mg/ml). Mixed standard solution was prepared by dissolving 100 mg of atenolol and 10 mg of amlodipine besylate in 100 ml methanol. Aliquot portions of stock standard solution of atenolol and amlodipine besylate were diluted with methanol to obtain concentration of 10 μg/ml for both the drugs, respectively. The resultant solutions were scanned in UV range (400-200 nm) in 1.0 cm cell against solvent blank. The absorption spectra thus obtained were derivatised from first to fourth order. From the overlain spectra, third-order derivative [Δλ (N = 2)] was selected for the analysis of the drugs (fig. 1). The three peaks, viz., two satellite minima and one inverted maxima termed as DL (~278.5 nm), DH (~286 nm), and DB ( ~282 nm) were selected for the analysis of atenolol. It was observed that at other peaks, there was interference of both the drugs. Therefore, amlodipine besylate, which exhibits maximum absorption at 361 nm, was estimated at this wavelength individually using E1cm1% value.
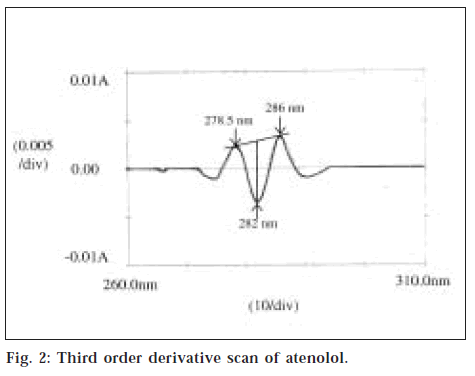
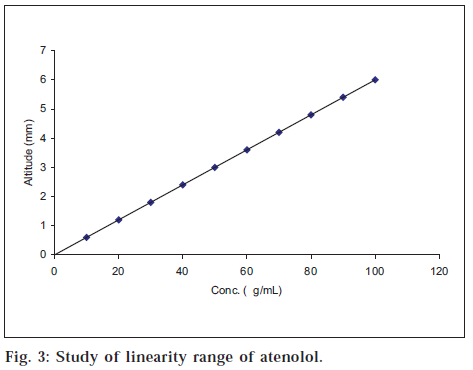
The standard stock solutions of atenolol and amlodipine besylate were diluted with methanol to get the series of concentration from 5-100 μg/ml for atenolol and 5-30 μg/ml for amlodipine besylate. Similarly, mixed standard solution was diluted appropriately to get series of concentration ranging from 5-100 μg/ml of atenolol. The absorption spectra of the resultant solutions of atenolol and mixed standard solution were obtained by scanning between 264 nm to 308 nm against solvent blank. The spectra thus obtained were derivatised to obtain third order derivative [Δλ (N) = 2] spectra. A tangent is drawn through the two satellite minima (DL ~278.5 nm and DH ~286 nm). An altitude is drawn through this tangent to the inverted maxima termed as DB (~282 nm) (fig. 2). The peak height was measured in mm and plotted against respective concentrations. Atenolol as pure drug, as well as mixed standard solution, shows linearity in the working range of 10-50 μg/ml. The graph of linearity range is shown in fig. 3. The absorbances of the resultant solutions of amlodipine besylate as well as the mixed standard solutions were read at 361 nm using methanol as blank. The E1cm1% value was calculated, and the average absorptivity value for amlodipine besylate at 361 nm was found to be 123.476.
For estimation of atenolol and amlodipine besylate in laboratory mixture, mixed standard solution containing 100 mg of atenolol and 10 mg of amlodipine besylate in 100 ml methanol was prepared. From the above stock solution, final concentration of (10:1) μg/ml of atenolol and amlodipine besylate, respectively was prepared by suitable dilution with methanol. The laboratory mixture was scanned between 400 and 200 nm. The spectra was further derivatised to obtain third-order [Δλ (N = 2)] spectra. A tangent was drawn through the two satellite minima (DL ~ 278.5 nm & DH ~ 286 nm). An altitude was drawn through this tangent to the inverted maxima termed as DB (~282 nm). The peak height was measured in mm, and the concentration of atenolol in laboratory mixture was obtained by interpolation on the calibration curve. For the estimation of amlodipine besylate in laboratory mixture, final concentration of (100:10) μg/ml of atenolol and amlodipine besylate, respectively was prepared from the stock solution.
The absorbance of the resulting solution was read at 361 nm. The concentration of amlodipine besylate in laboratory mixture was determined by E1cm1%. Good results were obtained and therefore, the method was applied to commercial formulations.
For analysis of commercial formulations, 20 tablets of two different brands were weighed. A quantity of composite equivalent to 100 mg of atenolol was accurately weighed and transferred to a 100 ml volumetric flask. Five such weighings were made separately. The contents were dissolved in 40 ml methanol with vigorous shaking and then volume was made up to the mark with methanol. The resulting solution was filtered through grade-1 filter paper. This gave the solution with 1000 μg/ml of atenolol and 100 μg/ml of amlodipine besylate. After appropriate dilutions, the contents of atenolol and amlodipine besylate were determined in the same manner as described in standard laboratory mixture. The results of estimation of atenolol and amlodipine besylate in marketed formulation are given in Table 1.
| Formulations | Ingredient | Label claimed mg/formulation | Amount found mg/formulation | % label claim | ±SD | RSD | C V | SE |
|---|---|---|---|---|---|---|---|---|
| Tablet I | Atenolol | 50 | 50.036 | 100.094 | 0.096 | 0.001 | 0.096 | 0.043 |
| Amlodipine besylate | 5 | 5.002 | 100.068 | 1.474 | 0.014 | 1.473 | 0.659 | |
| Tablet II | Atenolol | 50 | 50.018 | 100.040 | 0.388 | 0.003 | 0.388 | 0.173 |
| Amlodipine besylate | 5 | 5.012 | 100.264 | 0.943 | 0.009 | 0.941 | 0.422 |
Table 1: Results Of Analysis Of Commercial Formulations
Validation of the proposed method was carried out by performing recovery experiments in which preanalysed samples were taken and standard drug was added at five different concentration levels. The validation parameters like mean standard deviation, relative standard deviation, coefficient of variation, and standard error were calculated. The results are shown in Table 2.
| Formulation | Amount of pure drug added (mg) | Amount of pure drug recovered (mg) | % recovery | |||
|---|---|---|---|---|---|---|
| Atenolol | Amlodipine besylate | Atenolol | Amlodipine besylate | Atenolol | Amlodipine besylate | |
| Tablet I | 49.926 | 5.012 | 49.98 | 5.002 | 100.108 | 99.794 |
| Tablet II | 50.002 | 5.012 | 49.972 | 4.994 | 99.938 | 99.644 |
Table 2: Results Of Recovery Studies On Marketed Formulations
Atenolol and amlodipine besylate can be analysed by many methods. The proposed method is simple and can be applied to marketed formulation using simple instrument in small laboratory. Interestingly, atenolol can be estimated by third-order derivative while amlodipine besylate by E1cm1% in combined dosage form. The reproducibility of this method is verified by recovery studies.
Acknowledgements
The authors are grateful to Torrent Pharmaceuticals Ltd., India; and Sun Pharmaceutical Industries Ltd., India, for providing gift samples of atenolol and amlodipine besylate. The authors are also grateful to the Head of Department of Pharmaceutical Sciences, Nagpur, for providing the necessary facilities to carry out the research work.
References
- The Indian Pharmacopoeia, The Controller of Publications, New Delhi, 1996, 72.
- British Pharmacopoeia, CD-ROM, British Pharmacopoeia, HMSO, London, 2001, 72.
- Patki, R.V., Tamhankar, C.P. and Tipnis, H.P., Indian Drugs, 1994, 31, 560.
- Avadhanulu, A.B, Srinivas, J.S. and Y. Anjaneyulu, Indian Drugs, 1996, 33, 36.
- Phillip, A., Suvarna, G. K. and Satyanarayana, D., EasternPharmacist, 2000, XLIII (510), 111.
- Meyyanathan, S.M. Jose J., Scaria, S., Sowmya, S. and Suresh, B., Indian Drugs, 1998, 35, 296.
- Emmanual, J. and Quenim, U.S., Eastern Pharmacist, 1991, XXXIV (404), 151.
- Ilango, K., Kumar, P.B. and Vijaya Prasad, V.R., Indian J. Pharm.Sci., 1997, 59, 336.
- Chiu, F.C.K., Zhang, J.N., Li, R.C. and Raymond, K., Chem. Abst., 1997, 126, 324824y.
- Sadana, G.S. and Ghogare, A.B., Indian Drugs, 1990, 28, 142.
- Khopade, S.A. and Jain, N.K., Indian Drugs, 2000, 37, 351.
- Kaliappan, I., Pabisetty, B., Shanmuga, K. and Karunanidhi, L., IndianDrugs, 2000, 37, 497/ Chem. Abst., 2001, 134, 316251j.
- Ravishankar, S., Nanjan, M.J., Vasudevan, M., Shaat, N. and Suresh, B., Indian J. Pharm. Sci., 1997, 59, 171.
- Argekar, A.P. and Sawant, J.G., Chem. Abst., 2000, 132, 142078z.
- Beckett, A.H. and Stenlake, J.B., Practical Pharmaceutical Chemistry, 4thEdn., The Press of University of London, New Delhi, 1997, 281.


