- *Corresponding Author:
- M. R. Bhalekar
AISSMS College of Pharmacy, Kennedy Road, Near RTO, Pune-411 001, India
E-mail: mrb1570@yahoo.com
| Date of Submission | 10 September 2007 |
| Date of Revision | 05 May 2008 |
| Date of Acceptance | 30 July 2008 |
| Indian J Pharm Sci, 2008, 70 (4): 472-476 |
Abstract
The purpose of this research was to prepare a sustained release drug delivery system of venlafaxine hydrochloride by using a wax matrix system. The effects of bees wax and carnauba wax on drug release profile was investigated. A 3 2 full factorial design was applied to systemically optimize the drug release profile. Amounts of carnauba wax (X 1 ) and bees wax (X 2 ) were selected as independent variables and release after 12 h and time required for 50% (t 50 ) drug release were selected as dependent variables. A mathematical model was generated for each response parameter. Both waxes retarded release after 12 h and increases the t 50 but bees wax showed significant influence. The drug release pattern for all the formulation combinations was found to be approaching Peppas kinetic model. Suitable combination of two waxes provided fairly good regulated release profile. The response surfaces and contour plots for each response parameter are presented for further interpretation of the results. The optimum formulations were chosen and their predicted results found to be in close agreement with experimental findings.
Keywords
Venlafaxine HCl, bees wax, carnauba wax, sustained release, factorial design, response surface
Venlafaxine is a unique antidepressant, and is referred to as a serotonin-norepinephrine-dopamine reuptake inhibitor [1,2]. It works by blocking the transporter “reuptake” proteins for key neurotransmitters affecting mood, thereby leaving more active neurotransmitter in the synapse. The neurotransmitters affected are serotonin (5-hydroxytryptamine) and norepinephrine (noradrenalin). It is widely prescribed for the treatment of depression, depression with associated symptoms of anxiety, generalized anxiety disorder, and social anxiety disorder. The recommended oral dosages of venlafaxine hydrochloride are typically in the range of 75 to 225 mg per day. Because of its relatively short half-life of 5 h, venlafaxine should be administered in divided dosages throughout the day [3].
Hydrophobic wax matrix systems are being widely used in oral controlled drug delivery because of their flexibility to obtain a desirable drug release profile, cost-effectiveness, and broad regulatory acceptance [4]. Factorial design is an optimization technique, where all the factors are studied in all possible combinations. This technique is considered most efficient in estimating the influence of individual variables (main effects) and their interaction using minimum experimentation. A Factorial Design for two factors at three levels each 32 is considered identical to a two factor composite design [7].
Materials and Methods
Venlafaxine HCl was obtained from Torrent Pharmaceuticals Pvt. Ltd. (Ahemadabad, India), Talc powder by Cosmo Chem. (Pune, India), and lactose, from M/s Loba Chemie Ltd. (Mumbai, India) were procured from commercial sources. All other chemicals used in the study were of analytical grade.
Drug-excipient compatibility studies
Drug-excipient compatibility studies were done by Fourier Transform Infrared Spectroscopy. The drug with other excipients like carnauba wax, bees wax and Eudragit L 100 (on a 1:1 ratio) were subjected to storage at room temperature and elevated temperature in stability chamber at 45°/75% RH for three month. After three month the samples were taken and IR spectrum of samples were recorded with FTIR spectrometer (460 Plus, Jasco).
Preparation of wax matrix tablets
The preliminary study was done by using various waxes such as compritol, precirol, carnauba wax, bees wax and stearic acid. From the preliminary study bees wax and carnauba wax were selected for further study. The bees wax was selected for its retardant effect and carnauba wax to provide mechanical strength to the matrix.
The waxes were molten and then required quantity of drug (venlafaxine HCl) was slowly added to the molten wax. After cooling, the mass was subjected to granulation by passing through the sieve no 16. Granules were mixed with lactose and talc and blend was compressed into flat-faced tablets (200 mg, 8 mm diameter) using a Rimek Mini Press-II MT tablet machine (Karnawati Eng. Ltd., Mehsana, India) to achieve a tablet thickness of 1.5±0.1 mm [8-10].
Table 1 lists the composition of different formulations prepared by using varying amounts of bees wax, carnauba wax and lactose along with a fixed quantity of talc.
| Ingredients | Quantity (mg) |
|---|---|
| Venlafaxine | 37.5 |
| Bees wax | 18.75-56.25 |
| Carnauba wax | 18.75-56.25 |
| Talc | 5 |
| Lactose | q.s. |
Table 1: composition of wax matrix tablet of Venlafaxine hcl
Factorial Design
A 32 full FD was constructed where the amounts of Carnauba wax (X1) and bees wax (X2) were selected as the factors. The levels of the two factors were selected on the basis of the preliminary studies carried out before implementing the experimental design [11,12]. All other formulations and processing variables were kept invariant throughout the study.
Table 2 summarizes the experimental runs, their factor combinations, and the translation of the coded levels to the experimental units.
| Coded factor level | |
|---|---|
| X1 | X2 |
| -1 | -1 |
| -1 | 0 |
| -1 | 1 |
| 0 | -1 |
| 0 | 0 |
| 0 | 1 |
| 1 | -1 |
| 1 | 0 |
| 1 | 1 |
*X1 indicates amount of carnauba wax (mg); X2 amount of bees wax. Translation of coded levels in actual level is as follows, For -1, actual level of X1 and X2 is 18.75; For 0, actual level of X1 and X2 is 37.5; and For 1, actual level of X1 and X2 is 56.25.
Table 2: A 32 full factorial experimental Design layout
Physical evaluation
Ten tablets from each batch were evaluated for uniformity in tablet weight and thickness. Tablets from each batch were examined for friability using a Roche-type friabilator (Tropical Equipment Pvt. Ltd., Mumbai, India) and hardness using a Monsanto-type hardness tester (Campbell, Mumbai, India) [13,14].
In Vitro Release Study [15]
Drug release studies (n=3) were conducted for all the formulation combinations using dissolution test apparatus (Veego, DA-6D USP Standard). Distilled water (900 ml) was taken as the release medium at 100 rpm and 37±1º employing USP II paddle method (Apparatus 2). Aliquots of small samples were periodically withdrawn and the sample volume replaced with an equal volume of fresh dissolution medium. The samples were analyzed spectrophotometrically at 224 nm.
Data Analysis
The data obtained from dissolution kinetics studies
were analyzed using PCP Disso v2.08 software
developed by Poona College of Pharmacy,
Pune. The computed values of kinetic constant
(k) and diffusional release exponent (n) were
calculated using logarithmic transformation of the
relationship proposed by Korsmeyer, which was
 , where
Mt/M∞ is the fraction of drug released at time t.
The values of t50% were calculated by MS-Excel on
computers.
, where
Mt/M∞ is the fraction of drug released at time t.
The values of t50% were calculated by MS-Excel on
computers.
Various computations for the current optimization
study using RSM were carried out, employing
Stat Ease Design Expert Version 716. Statistical
second-order model including interaction and
polynomial terms were generated for all the response
variables. The general form of the model is, (Eqn. 2), where β0 the intercept, is the arithmetic
average of all quantitative outcomes of nine runs,
β1 to β8 are the coefficients computed from the
observed experimental values of Y, and X1 and X2 are
the coded levels of the independent variable(s). The
terms X1X2 and X2
i (i= 1, 2) are the interaction and
polynomial terms, respectively. The statistical validity of the polynomials was established on the basis of
Yates’ ANOVA. Subsequently, feasibility as well as
grid search was performed to locate the composition
of optimum formulations. Also, three-dimensional
response surface graphs and contour plots were drawn
in MS-Excel using the output files generated by the
State Ease Design Expert Version-7 software. of the polynomials was established on the basis of
Yates’ ANOVA. Subsequently, feasibility as well as
grid search was performed to locate the composition
of optimum formulations. Also, three-dimensional
response surface graphs and contour plots were drawn
in MS-Excel using the output files generated by the
State Ease Design Expert Version-7 software.
(Eqn. 2), where β0 the intercept, is the arithmetic
average of all quantitative outcomes of nine runs,
β1 to β8 are the coefficients computed from the
observed experimental values of Y, and X1 and X2 are
the coded levels of the independent variable(s). The
terms X1X2 and X2
i (i= 1, 2) are the interaction and
polynomial terms, respectively. The statistical validity of the polynomials was established on the basis of
Yates’ ANOVA. Subsequently, feasibility as well as
grid search was performed to locate the composition
of optimum formulations. Also, three-dimensional
response surface graphs and contour plots were drawn
in MS-Excel using the output files generated by the
State Ease Design Expert Version-7 software. of the polynomials was established on the basis of
Yates’ ANOVA. Subsequently, feasibility as well as
grid search was performed to locate the composition
of optimum formulations. Also, three-dimensional
response surface graphs and contour plots were drawn
in MS-Excel using the output files generated by the
State Ease Design Expert Version-7 software.
Validation of Optimization Model
Six optimum formulations were selected by intensive search, performed over the entire experimental domain, to validate the chosen experimental design and polynomial equations. The criterion for selection of optimum was primarily based on the highest possible values of the response parameters, which are released in 12 h and t50%. The formulations corresponding to this optimum were prepared and evaluated for various response properties. The resultant experimental data of response properties were subsequently quantitatively compared with predicted values, also linear regression plots between these, forcing the line through the origin were attempted.
Results and Discussion
FTIR spectrum shows no evidence of interaction between drug and studied excipients. All the major drug peaks (functional group) at 3669 cm-1 [CH stretch]; 1438 cm-1 [N-(CH3)2] and 2995 cm-1 [OH] were seen in subsequent spectra of drug and excipients kept together. The literature documented that significant reduction in the dose frequency can be achieved via SR drug delivery system of venlafaxine HCl [17,18]. Design of experiment (DOE) has been widely used in pharmaceutical field to study the effect of formulation variables and their interaction on response variable [19].
The nine formulations were designed, using various higher and lower levels of carnauba wax and bees wax (Table 1). All the preparations of each formulation passed weight variation test; the weight variation in all the nine formulations was found to be 198.5 mg to 202.8 mg, which was within pharmacopoeial limits. The hardness was found to be between 6 to 7 kg/ cm2. Friability of all the formulations was found to be less than 0.5%. In the current study, Table 3 shows that with the increasing amount of carnauba wax and bees wax, the release after 12 h is decreased and time taken for 50% drug release increases linearly.
| Trial No. | Release after 12 h ± SD | T50% (h) | n | k | Model |
|---|---|---|---|---|---|
| F1 | 88.21±0.0384% | 1.17±0.0821 | 0.2437 | 49.02 | Peppas |
| F2 | 78.46±0.0496% | 3.14±0.0649 | 0.3791 | 30.61 | Peppas |
| F3 | 68.79±0.0787% | 6.35±0.0512 | 0.5323 | 17.85 | Peppas |
| F4 | 82.59±0.0632% | 1.41±0.0481 | 0.2681 | 42.73 | Peppas |
| F5 | 71.49±0.0618% | 4.35±0.0432 | 0.4178 | 24.85 | Peppas |
| F6 | 59.50±0.2212% | 8.34±0.0419 | 0.5723 | 14.16 | Peppas |
| F7 | 77.29±0.0361% | 2.56±0.0632 | 0.3376 | 32.93 | Peppas |
| F8 | 68.30±0.0590% | 5.46±0.0305 | 0.5097 | 18.40 | Peppas |
| F9 | 48.50±0.0651% | 12.42±0.0213 | 0.6068 | 10.47 | Peppas |
n: Diffusional release exponent; k: Kinetic constant
Table 3: Dissolution parameters for wax Matrix formulations (n=3) prepared as per 32 Factorial design
Table 3 lists various dissolution kinetic parameters computed for all nine batches. In the current study, in all the nine cases studied, the n varied between 0.2437 and 0.6068. Further, the magnitudes of kinetic constant (k) ranges between 10.47 and 49.02; consequently, the value of t50% varies in between 1 h 17 min to12 h 42 min according to wax content.
The mathematical relationship constructed for the
studied response variables are expressed as Eqns. 2
and 3. All the polynomial equations were found to be
highly statistical significant (P< 0.001) as determined
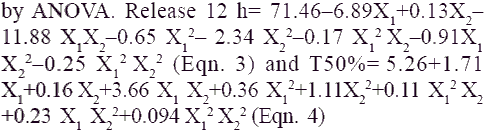
Application of two-way ANOVA based factorial analysis indicates that a high amount of carnauba wax and bees wax has a significant influence on release after 12 h and time required for 50% of drug release (P<0.001). (fig. 1), shows that release after 12 h varies in a nearly linear descending pattern with decrease in the amount of waxes. (fig. 2) also exhibits a near linear trend of t50%, but in ascending order. As there is no confounding of the contour lines in figs. 1 and 2, both the waxes seem to contribute independently towards drug release.

Figure 1: Response surface plots showing influence of carnauba wax and bees wax on percentage release in 12 h. A) Response surface plots showing influence of carnauba wax and bees wax on percentage release in 12 h for sustained release formulation of venlafaxine HCL. B) Contour plots showing relationship between various levels of carnauba wax and bees wax to attain fixed value of percentage release after 12h.  80-100% release after 12 h,
 60-80% release after 12 h and
  40-60% release after 12 h.

Figure 2: Response surface plots showing influence of carnauba wax
and bees wax on time required for 50% (t50%) drug release
(A) Response surface plots showing influence of carnauba wax and
bees wax on time required for 50% (t50%) drug release for sustained
release formulation of venlafaxine HCl. (B) Contour plot showing
relationship between various levels of carnauba wax and bees wax to
attain fixed value of t50%. 10-15 h required for 50% release of drug,
5-10 h required for 50% release of drug and 0-5 h required for
50% release of drug.
For all the six optimum formulations, the value of n ranged between 0.685 and 0.839, visibly indicating a peppas release behavior approaching. Evidently, the values of dissolution parameters had a propensity to range optimally between relatively controlled limits rather than those of the original formulations designed as per 32 factorial designs. The release profile of optimum formulations shows superiority in the drug release as depicted in the figs. 3a and b.

Figure 3: In vitro dissolution profile of sustained release formulations
of venlafaxine HCL
A) The plot shows release profile of nine formulations as per 32
Factorial Design. B) The plot shows release profile of an optimum
formulation. F1,
F1, F2,
F2,  F3,
F3, F4,
F4, F5,
F5,  F6,
F6, F7,
F7, F8,
F8,  F9,A1, A2, A3, A4, A5, A6.
Table 4 shows the values of observed and predicted responses using factorial design along with the percentage predicted errors for these six optimum formulations. The predicted error for the response variables ranged between -1.73 and 1.43%, with the mean±standard deviation of the percentage error being -0.2117±1.110%. Also, the linear plots between the predicted and observed responses demonstrated high of r2 (ranging between 0.9701 and 0.9977), indicating excellent goodness of fit. Thus, the low magnitudes of error, as well as the significant values of r2, designate a high prognostic ability of Response Surface Methodology (RSM).
| Formulationcode | Formulation compositionCarnauba/Bees wax | Response property | Experimental value | Predicted value | Percentage error |
|---|---|---|---|---|---|
| A1 | 18.75/41.71 | Release 12 h | 77.16 | 76.29 | 1.127 |
| A2 | 21.56/44.53 | T50% | 4.40 | 4.31 | 0.681 |
| Release 12 h | 73.47 | 73.64 | -0.231 | ||
| A3 | 31.87/34.68 | T50% | 5.003 | 4.99 | 0.259 |
| Release 12 h | 75.88 | 75.20 | 0.896 | ||
| A4 | 34.68/37.03 | T50% | 4021 | 4.26 | -1.187 |
| Release 12 h | 72.18 | 72.78 | -0.831 | ||
| A5 | 47.81/27.65 | T50% | 4076 | 4.83 | -1.470 |
| Release 12 h | 74.29 | 74.31 | -0.026 | ||
| A6 | 52.50/29.53 | T50% | 4.19 | 4.13 | 1.431 |
| Release 12 h | 70.42 | 71.64 | -1.732 | ||
| Mean (±SD) | T50% | 4.80 | 4.87 | -1.458 | |
| -0.2117±1.110 |
The results are average of three determinations. n- Diffusional release exponent, k-Kinetic constant
Table 4: Comparison of Observed And Predicted Response Parameters
Acknowledgements
The authors would like to thank Dr. K. G. Bothara for providing support for this project. Authors are also thankful to Torrent Pharmaceuticals Pvt. Ltd. (Ahmadabad, India), for providing gift sample of Venlafaxine HCl.
References
- Holiday SM, Benfield P. Venlafaxine: A review of its pharmacology and therapeutic potential in depression. Drugs 1995;49:280-94.
- Haskins JT, Moyer JA, Muth EA, Sigg E. Inhibition of noradrenergic neuronal activity by the novel bicyclic compounds, Wy- 45030 and Wy-45881. Soc Neurosci Abstr 1984;10:262.
- Troy SM, Parker VD, Fruncillo RJ, Chiang ST. The pharmacokinetics of venlafaxine when given in a twice-daily regimen. J Clin Pharmacol 1995;35:404-9.
- Goodhart FW, McCoy RH, Ninger FC. Release of a water soluble drug from a wax matrix timed release tablet. J Pharm Sci 1974;63:1748-51.
- Foster TP, Parrott EL. Release of highly water-soluble medicinal compounds from inert, heterogeneous matrix. J Pharm Sci 1990;79:938-42.
- Foster TP, Parrott EL. Release of highly water-soluble medicinal compounds from inert, heterogeneous matrix I: Physical mixture. J Pharm Sci 1990;79:806-10.
- Doornbos DA, Haan P. Optimization Techniques in formulation and Processing. In: Swarbrick J. Boylan JC, editors. Encyclopedia Pharmaceutical Technology. Vol. 11. New York: Marcel Dekker Inc; 1995. p. 77-160.
- Asker AF, Motari AM, Abdel-khalek MM. A study of same factors affecting the in vitro release of drug from prolonged release granulation 3: Effect of method preparation. Pharmazie 1971;26:215-7.
- Zhang YE, Schwartz JB. Effects of processing method and heat treatment on formulation of wax matrix tablet. Pharm Dev Tech 2001;69:131-44.
- Johnson JC. Tablet manufacture. 4th ed. New York: Marcel Dekker; 1974. p. 81-9.
- Bolton S. Pharmaceutical Statistics. New York: Marcel Decker Inc; 1990. p. 532-70.
- Franz RM, Browne JE, Lewis A. Experiment design, modeling and optimization strategies for product and process development. In: Libermann HA, Reiger MM, Banker GS, editors. Pharmaceutical Dosage Form: Disperse system. New York: Marcel Decker Inc; 1988. p. 427-519.
- Indian Pharmacopoeia. Government of India. Ministry of Health and Family Welfare. Delhi: Controller of Publication; 1996. p. 736.
- Banker GS, Anderson GR. Tablets. In: Lachman L, Libermann HA., Kanig JL, editors. The Theory and Practice of Industrial Pharmacy, 3rd ed. Mumbai: Varghese Publishing House; 1987. p. 293-343.
- The United States Pharmacopeia-24/National Formulary-19. Asian ed. Rockville MD: US Pharmacopoeial Convention, Inc; 2000. p. 1942.
- State-Ease, Design .Expert Software, Version 7, USA.
- Gothoskar AV, Oza KP, Rajabi AR. Study of slow release matrix formulation of highly soluble drug (Venlafaxine HCl). Colorcon Asia Pvt. Ltd. Goa, India: Control Release Society; 2005.
- Mukhija SN, Vavia PR. Once daily sustained release tablet of Venlafaxine: A novel antidepressant. Eur J Pharm Biopharm 2002;54:9-15.
- Singh B, Ahuja N. Book review on Pharmaceutical Experimental Design. Int J Pharm 2000;195:247-8.