- *Corresponding Author:
- S. S. Kumbhar
Drug Design and Development Group, Department of Pharmaceutical Chemistry, Bharati Vidyapeeth College of Pharmacy, Kolhapur-416 013, India
E-mail: santosh.kumbhar0307@gmail.com
| Date of Submission | 07 July 2016 |
| Date of Revision | 27 February 2017 |
| Date of Acceptance | 10 August 2017 |
| Indian J Pharm Sci 2017;79(5):813-819 |
This is an open access article distributed under the terms of the Creative Commons Attribution-NonCommercial-ShareAlike 3.0 License, which allows others to remix, tweak, and build upon the work non-commercially, as long as the author is credited and the new creations are licensed under the identical terms
Abstract
Anticoagulants are used for the prevention and treatment of venous and arterial thromboembolism. Factor IXa plays an important role in coagulation cascade and is a validated target for development of potent selective new antithrombotic agents. The present communication was an attempt to identify potent factor IXa inhibitors using development and validation of 3D-QSAR kNN-MFA and pharmacophore modelling. The results showed predictive capability (r2=0.9580, pred. r2=0.8687), k-nearest neighbor molecular field analysis showed high predictive ability (q2=0.9597, pred. r2=0.8440) and pharmacophore modelling of series of benzimidazole analogs showed important distinctive chemical features required for factor IXa inhibitors. The results of this present communication may be useful for the design and development of more potent benzimidazole derivatives as factor IXa inhibitors.
Keywords
Benzimidazole, factor IXa, QSAR, kNN-MFA, pharmacophore modelling, antithrombotic
Human body is designed to maintain a complex network of vasculature that is capable of continuously circulating blood for decades. It is also liable for its own repair when internal or external forces disturb the integrity of this system. Blood coagulation means conversion of fluid blood to a solid clot or gel-like structure. The conversion of soluble fibrinogen to insoluble fibrin is the main event of blood coagulation cascade [1]. Anticoagulants are used for the prevention and treatment of venous and arterial thromboembolism [2]. Thrombotic disorders are the underlying cause of 38% of all non-communicable disease related deaths worldwide. Thrombosis is a common pathology underlying ischemic heart disease, ischemic stroke, and venous thromboembolism (VTE). The Global Burden of Diseases, Injuries, and Risk Factors (GBD) Study 2010 documented that ischemic heart disease and stroke collectively caused one in four deaths worldwide. Factor IXa (FIXa) is also known as Christmas factor, which is a serine protease family enzyme of coagulation cascade discovered in 1952 by Christmas [3]. FIXa is synthesized in liver, which plays an important role in the blood coagulation [4]. Warfarin is the only orally active anticoagulant, which is clinically used nowadays. As it has a narrow therapeutic window and various side effects dose monitoring is required for warfarin [5]. Ximelagatran was the first oral direct thrombin inhibitor and had confirmed efficacy for prevention and treatment of VTE, stroke prevention and recurrent coronary events after acute myocardial infarction. But it was withdrawn by AstraZeneca in the year 2006 because of liver toxicity [6,7]. However, the new drugs available are still far away from fulfilling the desired objectives because, currently available anticoagulant therapy faces some limitations including inability to inhibit the clot-bound thrombin, variable patient responses, heparin-induced thrombocytopenia (HIT) and the enhanced chance of bleeding [8]. Hence design and development of newer anticoagulant agents with drug-like properties close to that of ideal antithrombotic agent is still a challenge. 3D quantitative structure-activity relationship models (QSAR) and k-nearest neighbor molecular field analysis (kNN-MFA) approach uses sampling based on methyl probe of charge +1, within the molecular lattice to determine the molecular properties particularly steric and electrostatic properties and their correlation with the biological activity. Pharmacophore is defined as the structural features, which are responsible for the biological activity of the molecules. The various interaction points are categorized as, hydrogen bond donor, hydrophobic and steric interaction points [8,9]. Here we studied the 3D QSAR, kNN-MFA analysis and pharmacophore modelling of some FIXa inhibitors, which would further give insight into structural features requirements for design and development of new FIXa inhibitors as antithrombotic class of drug.
Materials and Methods
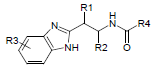
Dataset for the present study was taken from the literature reported by Parker et al. [10]. The data set was assorted into a training set (16 molecules) and a test set (7 molecules) using random selection. Structures and inhibitory activity listed in Table 1.
 |
|||||
|---|---|---|---|---|---|
| Sr. No. | R3 | R4 | FIXa Ki µM | ||
| 1 | 5-H | 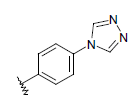 |
H | H | 114 |
| 2 | 5-Me | H | H | 8.52 | |
| 3 | 5-Cl | H | H | 7.76 | |
| 4 | 5-CF3 | H | H | 32.2 | |
| 5 | 5-MeO | H | H | 86.6 | |
| 6 | 4-Me | H | H | 145 | |
| 7 | 5-Amidine | H | H | 54.2 | |
| 8 | 4-OH, 7-Me | 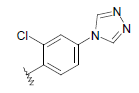 |
H | H | 131 |
| 9 | 5,6-Me |  |
H | H | 145 |
| 10 | 5,6-Me | 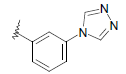 |
H | H | 145 |
| 11 | 5,6-Me | 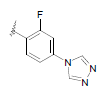 |
H | H | 2.04 |
| 12 | 5,6-Me | 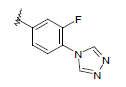 |
H | H | 18.8 |
| 13 | 5,6-Me | 2-chloro-phenyl | H | H | 145 |
| 14 | 5,6-Me | 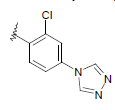 |
H | H | 0.26 |
| 15 | 5,6-Me | 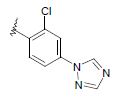 |
H | H | 2.12 |
| 16 | 5,6-Me |  |
H | H | 130 |
| 17 | 5,6-Me |  |
H | H | 145 |
| 18 | 5,6-Me |  |
H | H | 5.58 |
| 19 | 5,6-Me |  |
 |
55.4 | |
| 20 | 5,6-Me |  |
35.0 | ||
| 21 | 5,6-Me |  |
0.34 | ||
| 22 | 5,6-Me |  |
0.016 | ||
| 23 | 5,6-Me |  |
0.520 | ||
Dataset of benzimidazole derivatives used for study
Table 1: The data set and inhibitory activity of FIXa
QSAR analysis
The structures of benzimidazole substituents were drawn using 2D draw module in draw module of Vlife MDS 4.3 and converted them into 3D structures. Merck molecular force field (MMFF) and Gasteiger charges were utilized for the energy minimization to optimize ligand geometries till an energy gradient of 0.001 kcal/mol was reached with 10 000 number of cycles and 0.01 as convergence criteria (rms gradient) [11,12]. All the molecules of the present data set were aligned by the template-based technique, using the common structure of benzimidazole as template with the help of VLife MDS 4.3 and most active molecule (S. no. 22 having Ki 0.016 μM) as reference for alignment of molecules. Alignment of all the molecules is shown in Figure 1A and template used for that is shown in Figure 1B.

Figure 1: The alignment of the molecules (A) and benzimidazole
(template, B)
All the molecules were aligned by the template-based technique,
using the common structure of benzimidazole as template with
the help of VLife MDS 4.3 and most active molecule (S. no. 22
having Ki 0.016 μM) as reference for alignment of molecules
Same as other 3D QSAR methods, kNN-MFA also needs proper alignment of molecules. A suitable alignment of the given set of molecules was performed by using the Vlife MDS 4.3 engine. This is followed by generation of a common rectangular grid around the molecules. The steric, electrostatic and hydrophilic interaction energies for 3D QSAR and the steric and electrostatic energies were computed for kNN-MFA at the lattice points of the grid using methyl probe of charge +1. The values of these interaction energies were employed as values of 3D descriptors for correlation with bioactivity of the molecules. On the basis of biological and chemical variety, the data set was divided into a test set and training set using random selection. The bioactivity was expressed as inhibitory concentration (Ki μM) for FIXa inhibition was for the present 3D-QSAR, kNN-MFA and pharmacophore study.
3D-QSAR model
To correlate relationship between independent 3D fields and dependent bioactivity variables was determined using multiple linear regression (MLR) analysis and r2 was used to describe the fitness of data, models having correlation coefficient above 0.8 were used to check the external predictability whereas significance of the model was determined by F value. While those models show q2 below 0.7 were discarded. The selected models for FIXa are shown in Table 2 and Figure 2A showing the field points of QSAR model A.
| Model No. |
QSAR model Selected descriptors |
N | r2 | F value | Pred. r2 |
|---|---|---|---|---|---|
| A | Ki=8.0488(±0.5460)E_1113-4.5509(±0.4814)S_267 6.4650(±1.1067)S_355 | 16 | 0.9580 | 12 | 0.8687 |
| B | Ki=6.0392(±0.6696)E_1113-4.5202(±0.6163)S_267-1.4762(±0.5886) S_1231 | 16 | 0.9392 | 12 | 0.7278 |
Models were selected on the basis of values of r2, q2, pred. r2, F (degree of freedom)
Table 2: The selected 3d QSAR models along with statistical parameters employed for model selection and analysis

Figure 2: Field points of QSAR model A (A) and kNN-MFA model A (B)
kNN-MFA model
An optimal training and test set can be generated for kNN method using random selection algorithm. kNN methodology was applied to the descriptors generated over the grid after the training and test sets were generated. To generate 3D-QSAR equations kNNMFA with stepwise variable selection method was used [13]. Models having q2 above 0.8 were used to check the external predictivity while the models showing q2 below 0.6 were discarded. The selected models are shown in Table 3 and Figure 2B showing field points of kNN-MFA model A.
| Model No. |
QSAR model selected descriptors |
kNN | N | q2 | F value | Pred. r2 |
|---|---|---|---|---|---|---|
| A | E_524 -3.7557 -3.4399 S_258 30.0000 30.0000 E_536 -10.0000 -10.0000 |
2 | 16 | 0.9597 | 12 | 0.8440 |
| B | E_524 -3.4399 -1.8837 S_258 30.0000 30.0000 E_1212 -10.0000 7.5616 |
2 | 17 | 0.9344 | 13 | 0.8105 |
Models were selected on the basis of values of r2, q2, pred. r2, F (degree of freedom)
Table 3: The selected KNN-MFA model with statistical parameters employed for model selection
To thoroughly measure a QSAR model, a reliable validation is necessary. Generally, QSAR model is evaluated by the predicted activity of given dataset. Selected models for 3D QSAR and kNN-MFA having value above 0.8 were checked for their external predictive activity measured as predictive r2. The predicted and observed activity and residual values are shown in Table 4.
| Sr. no. | Observed activity FIXa Ki µM |
3D QSAR | kNN-MFA | ||
|---|---|---|---|---|---|
| Predicted activity | Residuals | Predicted activity | Residuals | ||
| 1# | 114 | 106.69 | 7.31 | 130.99 | -16.99 |
| 2 | 8.52 | 10.32 | -1.8 | 8.80 | -0.28 |
| 3 | 7.76 | 9.48 | -1.72 | 16.38 | -8.62 |
| 4 | 32.2 | 36.42 | -4.22 | 45.92 | -13.72 |
| 5# | 86.6 | 87.98 | -1.38 | 33.68 | 52.92 |
| 6# | 145 | 164.08 | -19.08 | 120.76 | 24.24 |
| 7 | 54.2 | 23.28 | 30.92 | 32.79 | 21.41 |
| 8 | 131 | 138.13 | -7.13 | 113.99 | 17.01 |
| 9# | 145 | 143.05 | 1.95 | 138.67 | 6.33 |
| 10 | 145 | 160.80 | -15.8 | 137.84 | 7.16 |
| 11# | 2.04 | 8.97 | -6.93 | 13.52 | -11.48 |
| 12 | 18.8 | 10.53 | 8.27 | 3.69 | 15.11 |
| 13 | 145 | 140.74 | 4.26 | 136.67 | 8.33 |
| 14 | 0.26 | 10.68 | -10.42 | 10.22 | -9.96 |
| 15 | 2.12 | 10.79 | -8.67 | 2.86 | -0.74 |
| 16 | 130 | 108.31 | 21.69 | 145 | -15 |
| 17 | 145 | 171.59 | -26.59 | 137.15 | 7.85 |
| 18 | 5.58 | 8.94 | -3.36 | 8.03 | -2.45 |
| 19# | 55.4 | 10.17 | 45.23 | 33.50 | 21.9 |
| 20# | 35.0 | 9.11 | 25.89 | 22.90 | 12.1 |
| 21 | 0.34 | 8.95 | -8.61 | 5.42 | -5.08 |
| 22 | 0.016 | 8.68 | -8.664 | 5.24 | -5.224 |
| 23 | 0.52 | 12.38 | -11.86 | 5.42 | -4.9 |
#: Molecules under test set
Table 4: The predicted activity and observed activity of 3d QSAR and KNN-MFA models
Pharmacophore modeling
Pharmacophore modeling was carried out in the workspace of mole sign module of Vlife MDS 4.3. Dataset of FIXa inhibitors was first aligned with reference to most active molecule as template. The minimum number of pharmacophore features for generated model was taken as 5.
Results and Discussion
In this present study, 23 molecules dataset was used to generate QSAR and kNN-MFA models. The steric, electrostatic and hydrophobic field points calculated for QSAR while steric and electrostatic fields for kNNMFA were calculated using the Tripos force field and Gasteiger-Marsili charges. After the successful running MLR, different set of equations were generated, which were further analysed to select best model. The best models were selected on the basis of values of r2, q2, pred r2, F (degree of freedom).
The structural requirements of benzimidazole derivatives as FIXa inhibition were obtained from the 3D descriptors of model A. The r2 value for model A was found to be 0.9580 while for model B it was 0.9392. Model A was found to be best to express anticoagulant activity as selected descriptors for model A were contributing to the anticoagulant activity. Descriptors of model A could help in refining the structural features, which establish to have good correlation between bioactivity and selected descriptors. The steric interaction field points represented in green lattice at S_267 and S_355 involve that the steric interaction at these lattice points are important in bioactivity of molecules and these are required to be addressed. The steric interactions at lattice point S_267 are negatively contributing to the bioactivity of molecules, which indicate that negative steric potential is favorable for activity and therefore smaller groups or groups with less steric strain substituent group is favored in that region. So aliphatic substitution at benzimidazole ring will improve activity of the molecules. The steric interaction fields at lattice point S_355 are positively contributing to the activity of molecules, which indicate that compounds which are having relatively bulky substituent's at the 6th position of benzimidazole ring could increase activity. The electrostatic interaction fields represented in blue lattice points E_1113 are positively contributing to activity, which indicates that positive electrostatic potential is favorable for activity. The contribution plot and fitness plot of model A shown in Figures 3 and 4A, respectively.

Figure 3: Contribution plot of descriptors for selected model A
 E_1113;
  S_267;
  S_355
S_355
The kNN-MFA model was selected on basis of q2, pred. r2, and F and k nearest neighbor (k=2) to evaluate the activity of the dataset [12]. The r2, coefficient of correlation and F-test is a statistical method of comparison of two different models. The lower values of pred. r2, q2 and r2 and higher value of F test indicates good model [12,14,15]. Model A was found to be best to articulate anticoagulant activity of FIXa inhibition. The q2 value for model A was 0.9597 and model B has 0.9344. The fitness plot of model A showed the correlation between predicted and observed activity of training set and test set molecules this will helps in cross-validation of model shown in Figure 4B. The steric interaction field points represented in green lattice at S_258 is positively contributing to the bioactivity of molecules, which indicate that compounds having relatively bulky R-substituent at the 3, 4 and 5th position of aromatic ring of benzimidazole be evidence for increase in activity of molecules. The electrostatic interaction at lattice point E_524 and E_536 are positively contributing to activity, which shows that positive electrostatic potential is favorable for activity. Therefore it indicates that less electronegative substituent groups are ideal at that lattice points. Groups which are electron rich or electron releasing groups increases activity of molecules.

Figure 4: Fitness plot (correlation plot) for selected 3D QSAR
model A (A) and for selected kNN-MFA model A (B)
 Training set;
  test set
A pharmacophore model for FIXa inhibitors was generated in the mole sign module of Vlife MDS 4.3. The distinctive features like hydrogen bond acceptor (purple colour), hydrogen bond donor (green colour), hydrophobic (buff colour) and aliphatic regions (orange colour) were observed in pharmacophoric hypothesis as shown in Figure 5. From the generated pharmacophore model indicated importance of amino bridge for H-bond interaction with amino acids like GLY216 [10] while aromatic features were found to be responsible for pi-stacking interactions with aromatic amino acids like PHE174 and TYR215.

Figure 5: Pharmacophore model for molecules of dataset under
study
The distinctive features like hydrogen bond acceptor (purple
colour), hydrogen bond donor (green colour), hydrophobic
(buff colour) and aliphatic regions (orange colour) were
observed in pharmacophoric hypothesis
Present study was an attempt to identify structural features of benzimidazole derivatives for as FIXa inhibitors, which involved a computational approach using 3D QSAR, kNN-MFA and pharmacophore modelling. Output of 3D QSAR analysis indicated importance of steric and electrostatic potentials towards biological activity. The occurrence of aromatic features in pharmacophoric hypothesis validated results of QSAR analysis. Thus generated QSAR model and pharmacophore hypothesis will be useful for development of the novel FIXa inhibitors.
Acknowledgements
The authors thank the UGC for funding a Major research project (MRP-MAJOR-PHAR-2013-39160), also thank Dr. H. N. More, Principal, Bharati Vidyapeeth College of Pharmacy, Kolhapur, India for providing facilities to carry out the research work.
Financial assistance
Nill.
Conflicts of Interest
The authors declare no conflicts of interest.
References
- Rang HP, Dale MM, Ritter JM, Moore PK. Pharmacology. 5th ed. London: Churchill Livingstone; 2003. p. 314-25.
- Bhatia M, Ingale K, Choudhari P, Bhatia N, Sawant R. Application quantum and physicochemical molecular descriptors utilizing principal components to study mode of anticoagulant activity of pyridyl chromen-2-one derivatives. Bioorg Med Chem 2009;17:1654-62.
- Biggs R, Douglas A, Macfarlane R, Dacie J, Pitney W. Christmas disease: a condition previously mistaken for haemophilia. Br Med J 1952;4799:1378-82.
- Zhong D, Bajaj M, Schmidt A, Bajaj S. The N-terminal epidermal growth factor-like domain in factor IX and factor X represents an important recognition motif for binding to tissue factor. J Bio Chem 1952;277:3622-31.
- Weitz J, Hudoba M, Massel D, Maraganore J, Hirsh J. Clot-bound thrombin is protected from inhibition by heparin-antithrombin III but is susceptible to inactivation by antithrombin III-independent inhibitors. J Clin Invest 1990;86:385-91.
- http://www.clotcare.com/astrazenecapullsexanta.aspx.
- Lee WM, Larrey D, Olsson R, Lewis JH, Keisu M, Auclert L, et al. Hepatic findings in long-term clinical trials of ximelagatran. Drug Saf 2005;28:351-70.
- Hogg PJ, Jackson CM. Fibrin monomer protects thrombin from inactivation by heparin-antithrombin III: implications for heparin efficacy. Proc Natl Acad Sci USA 1989;86:3619-23.
- Choudhari PB, Bhatia MS. 3D QSAR, docking studies, and pharmacophore modelling of selected factor Xa inhibitors. Med Chem Res 2012;21:1427-32.
- Parker DL Jr, Walsh S, Li B, Kim E, Sharipour A, Smith C, et al. Rapid development of two factor IXa inhibitors from hit to lead. Bioorg Med Chem Lett 2015; 25: 2321-25.
- Halgren T. Molecular Geometries and Vibrational Frequencies for MMFF94. J Comp Chem 1996;17:553-86.
- http://www.vlifesciences.com/products/VLifeMDS/Product_VLifeMDS.php.
- Gonzalez MP, Teran C, Saiz-Urra L, Teijeira M. Variable selection methods in QSAR: an overview. Curr Top Med Chem 2008;8:1606-27.
- Veerasamy R, Rajak H, Jain A, Sivadasan S, Varghese CP, Agrawal RK. Validation of QSAR Models- Strategies and Importance. Int J Drug Design Discov 2011;2:511-19.
- Cramer RD, Patterson DE, Bunce JD. Comparative molecular field analysis (CoMFA) 1. Effect of shape on binding of steroids to carrier proteins. J Am Chem Soc 1988;110:5959-67.