- Corresponding Author:
- Varalakshmi K. Nadumane
Department of Biotechnology, Centre for Post-Graduate Studies, Jain University, #18/3, 9th Main, III Block, Jayanagar, Bangalore-560 011, India
E-mail: kn.varalakshmi@jainuniversity.ac.in
| Date of Submission | 27 January 2013 |
| Date of Revision | 09 June 2013 |
| Date of Acceptance | 18 June 2013 |
| Indian J Pharm Sci 2013;75(5):507-514 |
Abstract
This study aims at the isolation of filamentous fungi, extraction of metabolites, and evaluation of the cytotoxic properties on HeLa cells and normal human lymphocytes. We isolated fungi from the soil by serial dilution method. One of the isolates was chosen and identified as Aspergillus ochraceus Wilhelm (Trichocomaceae) by standard techniques. The metabolites were extracted using methanol. Different concentrations of the extract were evaluated for their potential anticancer activity on HeLa cells by 3-(4,5-dimethylthiazol-2yl)-2,5-diphenyl tetrazolium bromide assay and the safety of the extract was checked on normal human lymphocytes. The extract was purified by chromatographic techniques like thin-layer chromatography and high-performance liquid chromatography, and subjected to mass spectrometric analysis. The extract showed significant cytotoxic potential on HeLa cells at low concentrations with a half maximal inhibitory concentration value of <50 μg/ml. The extract gave 10 fractions by thin layer chromatography, and fraction B had higher toxicity than the rest. This fraction gave a single peak by high-performance liquid chromatography and had a mass-to-charge ratio of 905.65, which did not match any of the earlier known fungal metabolites or metabolites from other strains of A. ochraceus. The metabolite from A. ochraceus is alkaloid in nature, cytotoxic to HeLa cells, and appears to be a novel with anticancer potentials, which could be explored further for characterization of the active component.
Keywords
Aspergillus ochraceus JGI 25, methanol extract, cytotoxic, novel metabolie, HeLa cells, lymphocytes
Recently, filamentous fungi have received increased attention as a source of diverse secondary metabolites of therapeutic importance [1]. These compounds are very diverse in structure and perform functions that are not always known. However, interest in these compounds is enormous, as many natural products produced by them are of medical, industrial, and/or agricultural importance [2].
Cancer is a dangerous disease that poses many complications in treatment owing to issues of drug efficacy and harmful side effects for normal cells. The search for novel drugs is still a priority goal for cancer therapy, due to the rapid development of resistance to multiple chemotherapeutic drugs. In addition, the high toxicity usually associated with chemotherapeutic drugs and their undesirable side effects increase the demand for novel antitumor drugs active against untreatable tumors, with fewer side effects, and/or with greater therapeutic efficiency [3]. Considering this as the main goal, our research teams in Bangalore isolated a few filamentous fungi from various soil sources. Among the isolates, Aspergillus ochraceus Wilhelm (Trichocomaceae) was chosen for our study as it was a known source for the production of the secondary metabolite emodin, which induces apoptosis in several kinds of cancer cells [4,5]. The metabolites from the mycelia were extracted using methanol. Different concentrations of the extract were evaluated for their potential anticancer activity on the cervical cancer cell line HeLa and also on normal human peripheral lymphocytes for testing their safety on humans. The bioactive metabolite was partially purified and identified by chromatographic techniques like thin-layer chromatography (TLC) and high-performance liquid chromatography (HPLC). The purified active component was subjected to electrospray ionization mass spectrometry (ESI-MS) analysis for further identification of the compound.
Materials and Methods
HeLa cell line was procured from the National Centre for Cell Sciences, Pune, India and maintained in Dulbecco’s modified Eagle’s medium (DMEM, HiMedia Laboratories, Mumbai, India) supplemented with 10% fetal bovine serum (FBS; HiMedia Laboratories, Mumbai, India), 100 U/ml of penicillin, and 100 µg/ml of streptomycin. The cells were incubated in a humidified incubator at 37º with 5% carbon dioxide (CO2) and 95% air.
Isolation of lymphocytes
Lymphocytes were obtained from the blood of five healthy male and female individuals, who were about 20 years of age, apparently free from infection by pathogenic agents, and had not been under any treatment for the last six months. The ethical guidelines for research of the Indian Council of Medical Research [6] were followed with regard to blood sampling. HiSep medium (Hi-Media Laboratories, Mumbai, India) was used for the isolation. The cells were suspended in complete Roswell Park Memorial Institute (RPMI) 1640 medium supplemented with 10% FBS, 5 g/ml phytohemagglutinin (PHA) and maintained at 37º in a 5% CO2 humidified incubator. The lymphocytes were used as control cells to assess the cytotoxicity of the fungal extract.
Isolation and identification of fungi
Filamentous fungi were isolated from various environmental sources including soil, air, cow urine, and cow dung by serial dilution method [7]. Fungal identification methods were based on the morphology of the fungal culture, the mechanism of spore production, and the characteristics of the spores [8-10]. The yellow-colored fungus was chosen for the study and was identified as A. ochraceus JGI 25 by Agharkhar Research Institute, Pune (pure culture deposited with acquisition no. AFCCI-2758).
Extraction of the metabolites
For extraction of the bioactive compound, 20 ml of 48 h old culture of A. ochraceus JGI 25, prepared by incubating active mycelial mat in 50 ml Czapek-Dox broth in 250 ml Erlenmeyer flasks at 25º in a rotary shaker [150 revolutions per minute (rpm)]. The enriched cultures (10 ml) were transferred as seed into each of 20 Erlenmeyer flasks (250 ml) containing 100 ml of Czapex-Dox broth medium and incubated for eight days at 25º in a stationary condition. To isolate the bioactive metabolites, the mycelial mass was separated by filtration through Whatman filter paper (No. 1) and the mat was dried in a hot-air oven. Dried hyphae were homogenized and the metabolites extracted with methanol, applying standard methods [11]. The extract from the mycelia was evaporated under vacuum at 50º till dryness. The obtained solid material was weighed and dissolved in dimethyl sulfoxide (DMSO) to form the crude extract.
MTT assay
HeLa cells were cultured in 96-well microtitre plates for 24 h and were treated with varying concentrations of the extract from A. ochraceus and incubated again for 24 h. After 24 h, 20 µl of 3-(4,5-dimethylthiazol-2-yl)-2,5-diphenyl tetrazolium bromide) (MTT) was added to each well. After the addition of MTT, the plates were incubated for three hours in a dark chamber; 100 µl of DMSO was added to dissolve the formazan crystals (100 µl of DMSO replaced 100 µl of the culture media in each well). The absorbance was recorded at 540 nm using enzyme-linked immunosorbent assay (ELISA) plate reader [12]. DMSO (0.1% final concentration) was used as vehicle control. The results were expressed as a percentage of DMSO control. The results of these assays were used to obtain the dose–response curves from which the half maximal inhibitory concentration (IC50) values were determined. The values represent the averages of three independent experiments, each with eight replicates.
Chromatographic separation of the bioactive compound
Thin layered chromatography (TLC) was carried out using TLC plates precoated with silica gel 60 F 254 (Merck). The silica gel-coated sheet was activated at 110º for 15 min. The fungal extract dissolved in methanol (20 µl) was spotted at the bottom of the silica gel-coated sheet. Chromatography was performed with the following solvent systems: chloroform:acetone (8:2 v/v); chloroform:acetone (6:4 v/v); hexane:acetone (2:8 v/v); acetone:dichloromethane (6:4 v/v). The chromatograms were detected with the help of an ultraviolet (UV) transilluminator (254 and 366 nm), and the Rf value of the fractions separated on the TLC plate were determined. Rf value=movement of solute from the origin/movement of solvent from the origin.
Detection of active compound
The bioactivity-guided fractionation was followed for the detection of the active compound separated in TLC. From the chromatogram developed as described earlier, each band was scraped, mixed with methanol, and centrifuged at 3000 rpm for 15 min. The supernatant was collected in a preweighed vial and kept for evaporation. The partially purified fractions obtained from preparative TLC were tested for cytotoxicity against HeLa cells by MTT assay as described earlier.
Determination of λ-max of the bioactive compound
The λ-max in methanol of the purified active compound was determined by using a (UV/Vis) spectrophotometer (Elico Ltd., Mumbai). A graph was plotted using wavelength versus optical density to determine the λ-max.
Observation of morphological changes
Cells plated in six-well culture plates (2×10⁵ cells per well) in DMEM supplemented with 10% FBS for 24 h were treated with the TLC-purified bioactive fraction of the fungal extract at various concentrations. After 24 h, the cells were observed under an inverted microscope (Labomed, Germany) and photographed.
Fluorescence microscopical analysis of apoptosis
Morphological evidence of apoptosis was obtained using acridine orange–ethidium bromide (AO/EB) staining [13]. Monolayer cell cultures in 96-well plates were used for these studies. The cells were treated with different concentrations (10, 20, and 30 µg/ml) of the bioactive fraction and incubated for 24 h. After removal of the incubation medium, the cells were rinsed and treated with a solution composed of AO/EB (100 mg/l phosphate-buffered saline (PBS) of each dye). The cells were examined using fluorescence microscopy and photographed.
Preliminary chemical investigation
Preliminary qualitative chemical analysis of the crude extract and the bioactive fraction B were performed for the identification of various constituents of the extracts. All the analyses were carried out using 0.5-1 ml of extract solutions. In the case of tests for carbohydrates, tests such as Fehling’s and Benedict’s tests were carried out. Tests for alkaloids (Wagner’s and Mayer’s tests), test for sterols (Salkowski test), tests for the detection of phenolic compounds and tannins, tests for proteins and peptides (Biuret test and Lowry’s test), and tests for the detection of flavonoids and saponins were performed.
HPLC analysis of the active fractions
To purify the active fractions further, the TLC‑purified fractions of the fungal metabolites were subjected to HPLC. The HPLC separation was performed using Waters HPLC system with 2487 dual λ UV detector, 1525 binary pump, and octadecylsilane (ODS) column (150×4.6 mm) with 5 μm particle size. The mobile phase consisted of solvent A: Solvent B (45:55). Solvent A was 0.4% phosphoric acid in water and acetonitrile in the ratio of 7:3. Solvent B was 100% methanol. The separation was performed using isocratic elution with a flow rate of 1.0 ml/min. The injection volume was 20 μl and UV detection was effected at 250 nm. The sample and mobile phase were filtered through 0.22 μm polyvinylidene fluoride (PVDF) filter before injecting into the column.
Spectroscopic analysis
The ESI mass spectra were recorded using a single-quadrupole mass spectrometer (Hewlett Packard HP 1100 MSD series). Spectra were acquired over the mass range 50-1300 m/z.
Statistical analysis
All experiments were carried out in triplicate. The results were calculated as mean±standard error (SE) values. Statistical significance was calculated using one-way analysis of variance (ANOVA) to test the null hypothesis. Duncan’s multiple range test (DMRT) was done to compare the sample means. The data were considered significantly different from each other when significance level was P<0.05.
Results and Discussion
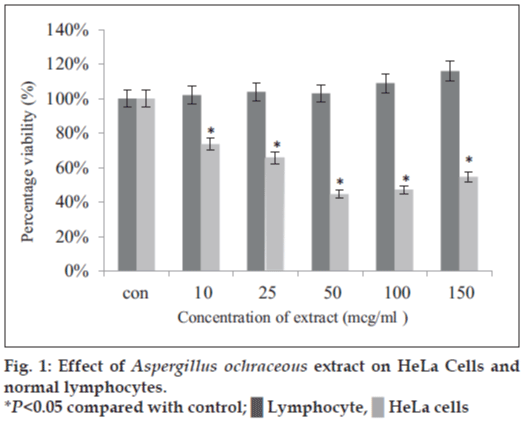
Secondary metabolites of fungi are remarkable resources for the preparation of clinically useful compounds. Fungi live in complex ecosystems and must compete with other organisms, such as bacteria, algae, other fungi, protozoans, and small metazoans. Due to this necessity for survival, they have probably acquired the ability to produce secondary metabolites that could inhibit the growth of their competitors. Thus, it is not surprising that fungal secondary metabolites have included a number of important drugs such as the antibiotic penicillin [13], the immunosuppressant cyclosporine [14], and the antihypercholesterolemic agent, lovastatin [15]. The spectrum of fungal metabolites ranges from polyketides and peptides to terpenes and heteroaromatic compounds, which illustrates the extraordinary structural diversity of secondary metabolites produced by these microorganisms [16]. Even though a remarkable number of fungal natural products are already known, the potential for further exploration is still wide open. Envisaging this, we planned and isolated filamentous fungi from various soil sources. Among the isolates, A. ochraceus was chosen for the study as it was a proven source for the secondary metabolite emodin which has anticancer activities. We extracted the metabolite from the fungal mycelia using methanol. This extract showed significant cytotoxic and apoptotic activity on cultured HeLa cells at very low concentrations (IC50 was <50 µg/ml) than at higher concentrations (100 and 150 µg/ml). The percent viability of cells treated with the methanol extract from A. ochraceus was 74.0, 65.0, 45.3, 47.2, and 54.6% at 10, 25, 50, 100, and 150 µg/ml, respectively (fig. 1). IC50 value was <50 µg/ml. It exihibited significant cytotoxicity at all the tested concentrations and very little or no toxicity to normal lymphocytes at the same concentrations with a P<0.05. When one-way ANOVA was performed between treatments, there was significant difference between the viability of 10 and 25 µg/ml treated HeLa cells, between 10 and 50 µg/ml treated cells, and also between 25 and 50 µg/ml treated groups of cells with a P<0.05. However, there was no significant difference between 50 and 100 µg/ml and between 100 and 150 µg/ml extract-treated HeLa cells (P>0.05). The inhibition was dose-dependent during a concentration of the extract increment from 10 to 50 µg/ml, but an increase beyond this level resulted in lower efficiency of the extract to inhibit HeLa cell proliferation. Similar observations were made by Gangadevi and Muthumary [17] about the cytotoxicity of taxol isolated from an endophytic fungus on various cancer cell lines. They showed a dramatic increase in apoptotic cell death with increase in taxol concentration from 0.005 to 0.05 µM, but further increase in apoptotic death with increase in taxol concentration was marginal.
| TLC fractions | Rf value | IC50 (µg/ml) |
|---|---|---|
| A | 0.94 | 60 |
| B | 0.85 | 40 |
| C | 0.78 | - |
| D | 0.73 | - |
| E | 0.50 | 70 |
| F | 0.46 | - |
| G | 0.41 | 75 |
| H | 0.31 | - |
| I | 0.17 | - |
| J | 0.02 | - |
TLC=Thin-layer chromatography
Table 1: Rf values of fractions separated by tlc and the IC50 values of the bioactive fractions
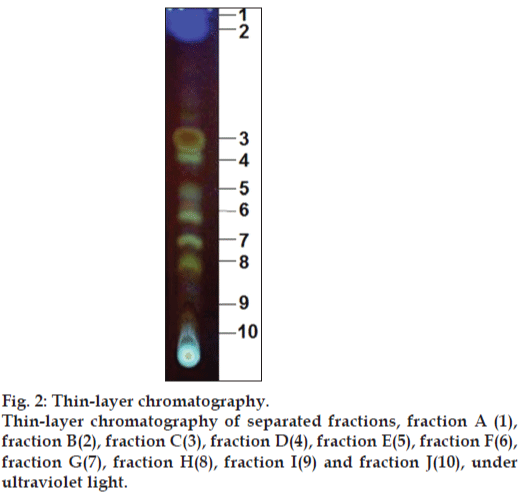
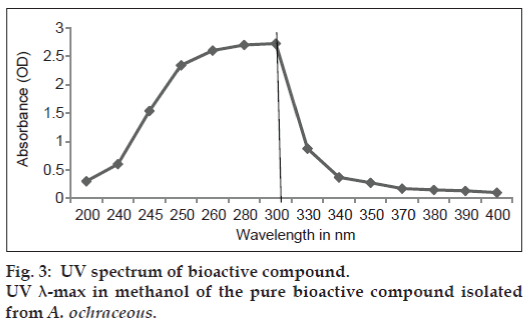
Ten fractions were separated by TLC (fig. 2), collected by preparative TLC, and tested on HeLa cells by MTT assay. From 10, fractions A, B, E and G were found to inhibit the HeLa cell proliferation in a dose‑dependent manner. Fraction A was yellow in color under normal light. IC50 of fraction A was found to be 60, B was 40, E was 70 and G was 75 μg/ml (Table. 1). The highest inhibition was by fraction B, followed by fraction A. The pure compound in fraction B was soluble in methanol with Rf value 0.85 and has UV λ-max in methanol at 300 nm (fig. 3).
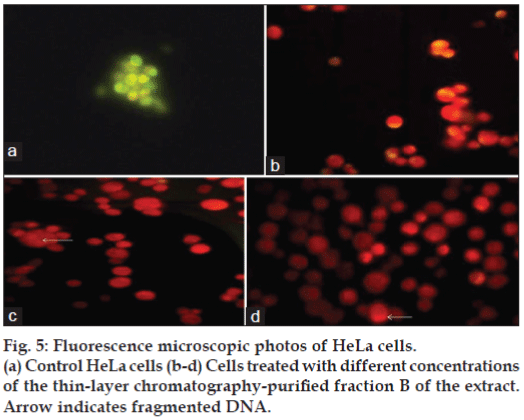
To confirm the results of the MTT assay further, the HeLa cells were treated with the bioactive fraction B for 24 h, and the changes in cell morphology induced by the treatment were observed under an inverted microscope. The cells showed many changes such as reduced cell number, presence of apoptotic bodies, membrane blebbing, rounding up and detachment from the substrate, and increased number of dead cells (fig. 4a-c). These cellular changes were the characteristics of the apoptotic induction of cell death. Fluorescence microscopic studies also confirmed the apoptotic induction of cell death induced by the bioactive fraction. Viable cells in the control flasks showed bright green colour (fig. 5a) and nonviable cells had bright orange chromatin when observed under the fluorescence microscope (fig. 5b-d) for samples treated with different concentrations of the bioactive compound of the fungal extract after staining with AO/EB dye. Apoptosis was demonstrated by the appearance of cells with orange fluorescence, nuclear condensation, nuclear fragmentation, and the presence of apoptotic bodies.
In chemical screening, among the different reagents used, when the samples (crude extract and the bioactive fraction B) were treated with a few drops of dilute 2N HCl and 0.5 ml Wagner’s reagent, a brown flocculent precipitate was obtained (Table 2). Based on the observation, the functional group of the active component was tentatively identified as alkaloids.
| Compound | Crude extract | Fraction B |
|---|---|---|
| Alkaloids | + | + |
| Phenols | – | – |
| Steroids | + | – |
| Reducing sugars | – | – |
| Tannins | – | – |
| Saponins | – | – |
| Proteins | + | – |
| Flavonoids | – | – |
Table 2: Results of the chemical screening of The crude extract and the bioactive fraction b
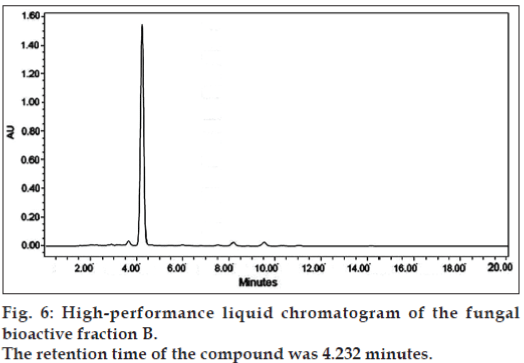
The two bioactive fractions were further subjected to HPLC purification. In HPLC analysis, fraction B gave a single peak when eluting with a reverse-phase C18 column, with a retention time of 4.232 min (fig. 6), covering an area of 89% among the eluents.
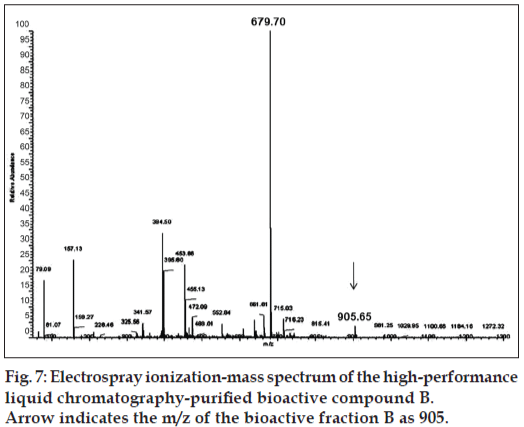
This purified bioactive compound was subjected to ESI-MS to determine the molecular mass. The mass spectrum of the purified bioactive metabolite from A. ochraceus is given in fig. 7. The bioactive metabolite showed a mass-to-charge ratio of 905.65 with a base peak value of 679.7 and other major fragment peaks were 715.03, 661, 453, 394.5, 157, and 79.09. From the results of the MS analysis, it appears that the bioactive component has a molecular mass higher than that of taxol (m/z 854) and lower than cyclosporine (m/z 1202) or a-amanitin which has an m/z value of 919 [18]. As this is a new compound, further nuclear magnetic resonance (NMR) and X-ray crystallographic studies are required to confirm the chemical structure and molecular weight of this new metabolite. From A. ochraceous MP2, three metabolites with antimicrobial properties were reported [19], whose molecular weights do not correspond to that of the bioactive fraction B from our isolate.
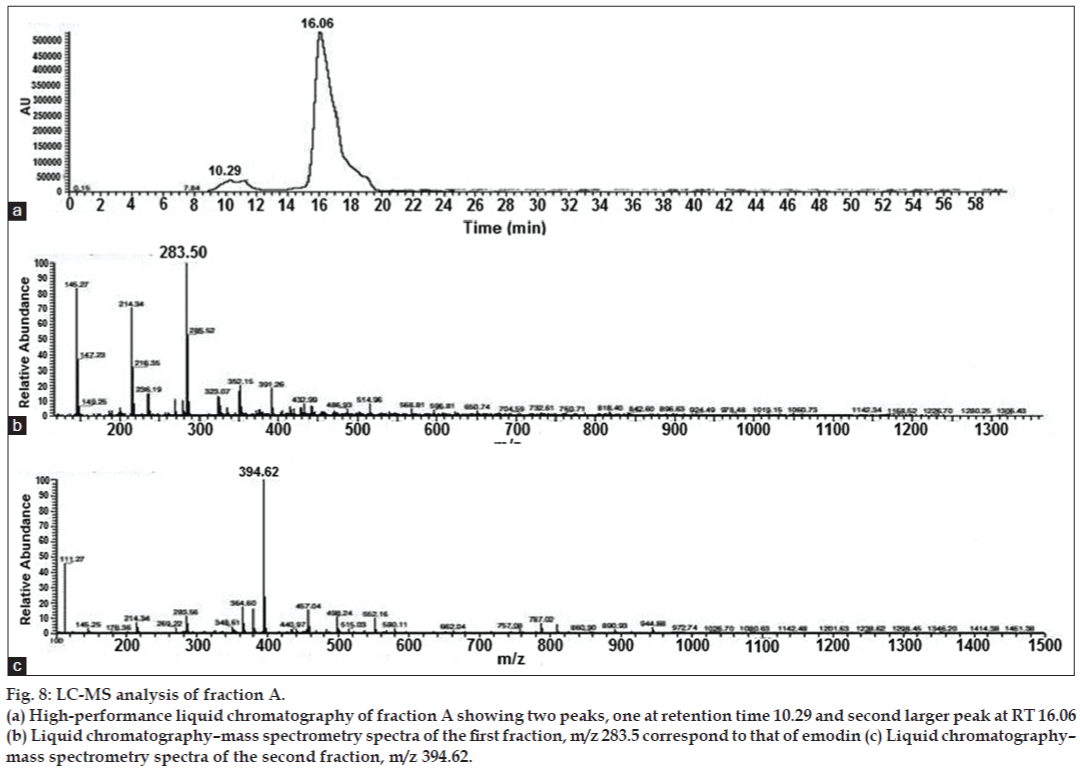
When the yellow fraction A was subjected to LC-MS analysis, it resulted in two peaks, one at retention time 10.29 and the other at 16.06 (fig. 8). The molecular weight of the first fraction corresponded to that of emodin (284), the well-known yellow pigment, with anticancer properties [20,21]. As compared to fraction B, it showed lesser cytotoxicity on the HeLa cell line but higher than that reported by earlier workers. Hsu et al. [22] reported the IC50 of emodin on hepatoma cells as varying between 66.9 and 101µM concentrations. The emodin from our isolate of A. ochraceus had an IC50 of 60 µg/ml corresponding to 0.21 µM concentration. The IC50 of our new metabolite in fraction B was 40 µg/ml. By bioassay-guided isolation, we could identify a bioactive compound with higher cytotoxic properties than the well-known secondary metabolite, emodin. Bioassay-guided isolation of secondary metabolites represents a rational and time-effective tool for the discovery of new and bioactive compounds. Further advantages of this method are obvious: It prevents novel compounds from being overlooked that often remain undetected in studies where the investigator only identifies compounds they are familiar with [23,24]. Sudarmono et al. [25] reported that the secondary metabolite extracted from an endophytic fungus 1.2.11 exhibited an IC50 of 361.21 µg/ml on HeLa cells after 24 h and an IC50 of 219.97 µg/ml after 48 h. The metabolite (Fraction B) was effective at lower concentrations with an IC50 of 40 µg/ml and had no significant inhibitory effects on normal human peripheral lymphocytes. Many fungal metabolites in clinical use for cancer or transplantation (cyclosporine, FK506, taxol, and the like), have profound side effects on normal healthy cells of the body [26-29]. In our study, we observed that there was not much difference between the viability of treated and untreated normal lymphocytes. Studies on test animals may be required to corroborate our results. It can be concluded that the fungal metabolite appears to be a novel one, and further studies are required to analyze the exact structure and mechanism of action of this potential anticancer agent. These results forecast the potential of the strain to be used as an agent for the production of an anticancer compound with least side effects.
Figure 8: LC-MS analysis of fraction A.
(a) High-performance liquid chromatography of fraction A showing two peaks, one at retention time 10.29 and second larger peak at RT 16.06
(b) Liquid chromatography–mass spectrometry spectra of the first fraction, m/z 283.5 correspond to that of emodin (c) Liquid chromatography–
mass spectrometry spectra of the second fraction, m/z 394.62.
Acknowledgements
The authors thank management of the Jain Group of Institutions for the infrastructural facilities provided to carry out the work.
References
- Amagata T, Rath C, Rigot JF, Tarlov N, Tenney K, Valeriote FA, et al. Structures and cytotoxic properties of trichoverroids and their macrolide analogues produced by saltwater culture of Myrotheciumverrucaria. J Med Chem 2003;46:4342-50.
- Demain AL, Fang A. The natural functions of secondary metabolites. Adv Biochem Eng Biotechnol 2000;69:1-39.
- Demain AL, Sánchez S. Microbial drug discovery: 80 years of progress. J Antibiot (Tokyo) 2009;62:5-16.
- Srinivas G, Anto RJ, Srinivas P, Vidhyalakshmi S, Senan VP, Karunagaran D. Emodin induces apoptosis of human cervical cancer cells through poly (ADP-ribose) polymerase cleavage and activation of caspase-9. Eur J Pharmacol 2003;473:117-25.
- Yi J, Yang J, He R, Gao F, Sang H, Tang X, et al. Emodin enhances arsenic trioxide-induced apoptosis via generation of reactive oxygen species and inhibition of survival signaling. Cancer Res 2004;64:108-16.
- Indian Council of Medical Research. Ethical guidelines for biomedical research on human participants. New Delhi: Indian Council of Medical Research; 2006.
- Aneja KR. Experiments in microbiology, plant pathology, tissue culture and mushroom production technology. 3rd ed. New Delhi: New Age International Publishers; 2001. p. 169-71.
- Ainsworth GC, Sparrow FK, Sussman AS. The Fungi, an Advanced Treatise. A Taxonomic Review Keys: Ascomycetes and Fungi Imperfecti. Vol. 4a. New York: Academic Press; 1973. p. 105-514.
- Hawksworth DL, Sutton BC, Ainsworth GC. Dictionary of the Fungi. 7th ed. Kew, Surrey: Common Wealth Mycological Institute; 1983.
- Barnett HL, Hunter BB. Illustrated Genera of Imperfecti Fungi. 3rd ed., translated in Chinese. Beijing: China Scientific Press; 1977. p. 144-5.
- Joshi VK, Attri D, Bala A, Bhushan S. Microbial pigments. Indian J Biotech 2003;2:362-9.
- Mosmann T. Rapid colorimetric assay for cellular growth and survival: Application to proliferation and cytotoxicity assays. J Immunol Methods 1983;16:55-63.
- Fleming A. On the antibacterial action of cultures of a penicillium, with special reference to their use in the isolation of B. infuenzae. Br J ExpPathol 1929;10:226-36.
- Borel JF, Kis ZL. The discovery and development of cyclosporine (Sandimmune). Transplant Proc 1991;23:1867-74.
- Galagan JE, Calvo SE, Cuomo C, Ma LJ, Wortman JR, Batzoglou S, et al. Sequencing ofAspergillusnidulansand comparative analysis with A. fumigatusand A. oryzae. Nature 2005;438:1105-15.
- Schneider P, Misiek M, Hoffmeister D. In vivo and in vitro production options for fungal secondary metabolites. Mol Pharm 2008;5:234-42.
- Gangadevi V, Muthumary J. Taxol, an anticancer drug produced by an endophytic fungus BartaliniarobillardoidesTassi, isolated from a medicinal plant, Aeglemarmelos Correa ex Roxb. World J MicrobiolBiotechnol 2008;24:717-24.
- Nielsen KF, Smedsgaard J. Fungal metabolite screening: Database of 474 mycotoxins and fungal metabolites for dereplication by standardised liquid chromatography–UV–mass spectrometry methodology. J Chromatogr A 2003;1002:111-36.
- Meenupriya J, Thangaraj M. Analytical characterization and structure elucidation of metabolites from Aspergillusochraceus MP2 fungi. Asian Pac J Trop Biomed 2011;1:376-80.
- Lu P, Zhao X, Cui T. Production of emodin from Aspergillusochraceusat preparative scale. Afr J Biotechnol 2010;9:512-7.
- Gill M, Morgan PM. New fungal anthraquinones. Arkivoc 2001;7:145-56.
- Hsu CM, Hsu YA, Tsai Y, Shieh FK, Huang SH, Wan L, et al. Emodin inhibits the growth of hepatoma cells: Finding the common anti-cancer pathway using Huh7, Hep3B, and HepG2 cells. BiochemBiophys Res Commun 2010;392:473-8.
- Duke SO, Rimando AM, Dayan FE, Canel CO, Wedge DE, Tellez MR, et al. Strategies for the discovery of bioactive phytochemicals.In: Bidlack WR, Omaye ST, Meskin MS, Topham DKW, editors. Phytochemicals as Bioactive Agents. Lancaster, PA: Technomic Publication. Co.; 2000. p. 1-20.
- Rimando AM, Olofsdotter M, Dayan FE, Duke SO. Searching for rice allelochemicals: An example of bioassay-guided isolation.Agron J 2001;93:16-20.
- Sudarmono P, Utji R, Kardono LB, Kumala S. Cytotoxic assay of endophytic fungus 1.2.11 secondary metabolites from Bruceajavanica(L) Merr towards cancer cell in vitro. Med J Indones2006;15:137-44.
- Schuette W, Nagel S, Blankenburg T, Lautenschlaeger C, Hans K, Schmidt EW. Phase III study of second-line chemotherapy for advanced non-small -cell lung cancer with weekly compared with 3-weekly docetaxel. J ClinOncol 2005;23:8389-95.
- Malingre MM, Beijnen JH, Rosing H, Koopman FJ, van Tellingen O, Duchin K, et al. The effect of different doses of cyclosporin A on the systemic exposure of orally administered paclitaxel. Anticancer Drugs 2001;12:351-8.
- Helgason HH, Kruijtzer CM, Huitema AD, Marcus SG, ten BokkelHuinink WW, Schot ME, et al. Phase II and pharmacological study of oral paclitaxel (Paxoral) plus ciclosporin in anthracycline-pretreated metastatic breast cancer. Br J Cancer 2006;95:794-800.
- Mohebbi N, Mihailova M, Wagner CA. The calcineurin inhibitor FK506 (tacrolimus) is associated with transient metabolic acidosis and altered expression of renal acid-base transport proteins. Am J Physiol Renal Physiol 2009;297:F499-509.
 Lymphocyte,
  HeLa cells