- *Corresponding Author:
- P. K. Mohapatra
Department of Pharmaceutical Sciences, Utkal University, Bhubaneswar, Odisha 751004, India
E-mail: mahapatra.kjr@gmail.com
| Date of Received | 21 February 2020 |
| Date of Revision | 06 December 2021 |
| Date of Acceptance | 30 November 2022 |
| Indian J Pharm Sci 2022;84(6):1556-1565 |
This is an open access article distributed under the terms of the Creative Commons Attribution-NonCommercial-ShareAlike 3.0 License, which allows others to remix, tweak, and build upon the work non-commercially, as long as the author is credited and the new creations are licensed under the identical terms
Abstract
Microspheres containing indinavir sulfate were prepared by the emulsion solvent evaporation technique using surfactant sorbitan monooleate 80. The evaluation reports for Fourier-transform infrared spectroscopy and X-ray diffraction spectroscopy were taken to see whether the surfactant altered the physicochemical features of the produced microspheres. Scanning electron microscopy was used to observe the surface topography of the microspheres. When sorbitan monooleate 80 was employed at dissimilar concentrations, the sorbitan monooleate 80 microspheres had higher concentrations that resulted in smaller particle size as compared to the lower concentrations of sorbitan monooleate 80 microspheres, therefore, the faster release rate was observed by utilizing a higher concentration of sorbitan monooleate 80. The microspheres entrapped 71 % to 96 % of the drug and released it for up to 7 h. X-ray diffraction revealed a decrease in the crystallinity of the drug. Scanning electron microscopy analysis revealed the spherical and after dissolution detected porous structure of microspheres. The excellent fit release kinetics is accomplished with the zero-order, Higuchi plot followed by first-order, Hixson-Crowell and Korsmeyer-Peppas equations. As a result, the drug indinavir sulfate release rate was influenced by surfactant concentrations, drug-polymer ratio, particle size and the diffusion release mechanism.
Keywords
Microspheres, sorbitan monooleate 80, indinavir sulfate, surfactant
Indinavir, a protease inhibitor utilized in Human Immunodeficiency Virus (HIV)/Acquired Immune Deficiency Syndrome (AIDS) pharmacotherapy, is accessible in capsules and exhibit pharmacokinetic profiles that rely upon pharmacogenetic designs[1]. Of several methods, microencapsulation is used as one method to deliver a drug in a controlled/ sustained manner. This technique gives the alteration and hindrance of the medicament release. Microspheres are broadly distributed all over the gastrointestinal tract, due to their small molecular size and this possibly increases drug absorption and decreases side effects of localized accumulation of irritating drugs on the gastrointestinal mucosa[2]. A number of methods was set up for the manufacture of microcapsules and from such methods, one method was the solvent evaporation method, which can be utilized for together polar soluble and polar insoluble medicaments to be encapsulated[3]. Having picked oil as the processing medium, the oil must be immiscible with the solvent utilized for polymer[4]. Entire other polar organic solvents example; methanol, acetone, ethyl alcohol, ethyl acetate, dimethylsulphoxide and tetrahydrofuran are miscible in oil and don't produce emulsions of the polymer solution in oil[5]. Surfactants play a key role in the ultimate characteristics of the microcapsules in microencapsulation by a solvent evaporation method and by different authors, the most frequently used surfactant is known as Sorbitan Monooleate 80 (Span 80)[6,7]. These substances decline the interfacial tension amongst the lipophilic and hydrophilic layers of the emulsion and streamline the development of the microspheres[8]. Throughout the procedure of bead formation in the solvent evaporation technique, the regular elimination of solvent from polymer beads is joined by a comparable decline in the volume and an increment in the viscosity of the individual beads. Specifically, profoundly thick beads coalesce a lot quicker than they can redivide. Droplet combination and particle coagulation can, for the most part, be overwhelmed by the utilization of a small quantity of a reasonable droplet/particle stabilizer (dispersing agent). The surfactants deliver a slim defensive layer around the droplets and consequently lessen the degree of their crash and coalescence[9]. Surfactants utilized can be different polymeric materials[10], proteins[8,11] or surfactants. So as to improve the drug stacking of moderate water-soluble substances, a waterin- oil (w/o) emulsion framework has been conveyed[12,13]. Surfactants utilized in w/o systems are particularly metallic cleansed (magnesium stearate, aluminum stearate), Sorbitan fatty esters (Span, Tween, Arlacel) and polyoxyethylene fatty ethers[14,15]. The current subject area aims to justify using different concentrations of surfactant[7,16] to prepare indinavir sulfate microspheres and study the effects on different characteristics of the prepared microspheres[17,18]. The protease active site was bounded by indinavir sulfate and HIV protease activity was suppressed, in HIV infection, an enzyme required for the proteolytic cleavage of viral polyprotein antecedents into individual functional proteins was obtained[19,20]. The immature, noninfectious viral particles are made due to the suppression of viral polyprotein cleavage. The model drug, indinavir sulfate, an inhibitor of HIV infection, is the Food and Drug Administration (FDA) affirmed drug for the treatment of AIDS. It is ordinarily orally administered as a capsule and an oral solution[21]. Subsequently, the motivation behind the present examination is to utilize the oil-in-oil (o/o) emulsion solvent evaporation technique to plan microspheres by utilizing ethyl cellulose as wall creator. Research the impact of concentrations of surfactant and the volume of paraffin liquid (light) on the attributes of the microspheres to prepare a sustained-release, stable and effective formulation of indinavir sulfate with high encapsulation productivity and yield for improved treatment of AIDS[22]. The plasma half-life is about 1.8 h due to the first-pass metabolism of hepatic via CYP3A4. Hence, microsphere is a suitable formulation to formulate an oral sustained release dosage form for 12 h duration of activity[6].
Materials and Methods
Indinavir sulfate was achieved as a gift sample from Cipla, Ltd, Mumbai, India. Ethylcellulose and Span 80 were gained from CDH Pvt. Ltd., New Delhi, India and paraffin fluid light was transported from SD fine Chem. Ltd., Mumbai, India. Acetone, methanol and cyclohexane were procured from E. Merck and Co., Ltd., Mumbai, India. All other obtained chemicals and reagents were used to achieve an analytical level[22,23].
Experimental design:
The 32 factorial designs is one of the procedures to examine the impact of factors on the quality determinant parameters of any formulation. Given the guidelines of a plan of examinations, this structure was utilized to explore autonomous factors impact. Experimental design is utilized in the present inspection to optimize the surfactant concentration, such as Span 80, specified as factor X1 and ethylcellulose, named X2, learned at three levels each. The number of experiments needed for this research is determined by how many independent variables are chosen. Each trial's response (Y) is measured as dependent variables; the percentage of entrapment efficiency (Y1) and percent drug release at 3 h of indinavir sulfate (Y2) were used. The list of variables is shown in Table 1. The primary effects (X1 and X2) represent the average consequence of varying one element from a low value to a high value one at a time. The phrase "X1X2" describes how the reaction varies when both elements change at the same time. Table 2 lists the nine formulations investigated, factors and the coded levels assigned to the experimental units used in the study[24,25].
| Coded factors and units | Coded levels | ||||||
|---|---|---|---|---|---|---|---|
| Low level | Middle level | High level | |||||
| -1 | 0 | 1 | |||||
| Ethylcellulose | 500 | 1000 | 1500 | ||||
| Span 80 (%) V/V | 1 | 2 | 3 | ||||
| Formulation code | Independent variables | Dependent variables | |||||
| Coded factors and their levels | Coded factors and their actual values (%) v/v | Entrapment efficiency (%) | % Drug release at 3 h | ||||
| X1 | X2 | X1 | X2 | Y1 | Y2 | ||
| F1 | -1 | -1 | 1 | 500 | 75.42 | 73.08 | |
| F2 | 0 | -1 | 2 | 500 | 72.13 | 84.39 | |
| F3 | 1 | -1 | 3 | 500 | 71.23 | 95.93 | |
| F4 | -1 | 0 | 1 | 1000 | 86.66 | 60.24 | |
| F5 | 0 | 0 | 2 | 1000 | 83.32 | 80 | |
| F6 | 1 | 0 | 3 | 1000 | 80.34 | 89.1 | |
| F7 | -1 | 1 | 1 | 1500 | 96.36 | 54.94 | |
| F8 | 0 | 1 | 2 | 1500 | 90.49 | 68.7 | |
| F9 | 1 | 1 | 3 | 1500 | 88.52 | 70.48 | |
Table 1: Formulation Characteristics of Factorial Design Layouts
Preparation of microcapsules:
The microspheres were manufactured by the oilin- oil emulsion solvent vaporization technique, utilizing the formulation as appeared in Table 2. In this method, indinavir sulfate and ethylcellulose in a (1:1, 1:2 and 1:3) ratio were dissolved in an acetone:methanol (10:1) mixture and stirred for about 5 min at 500 rpm in a mechanical stirrer (lab stirrer, Remi motors, India), then emulsified into a light liquid paraffin solution (100 ml) containing varying concentrations of dispersing agents (1 % v/v, 2 % v/v, and 3 % v/v). The whole scheme was then agitated for approximately 5-6 h at 750 rpm. Once the stirring process was completed, the liquid paraffin (light) was poured out and the formed microcapsules were collected and washed 4 to 5 times properly with cyclohexane to remove the oil, dried for 12 h at 40° in the air drier (NSW, India) and compiled and packed to be stored in a desiccator at ambient temperature for further studies[6,26,27].
| Formulations | Drug (mg) | Ethylcellulose N-50 (mg) | Span 80 (%) v/v | Acetone+methanol (ml) | Liquid paraffin (ml) |
|---|---|---|---|---|---|
| F1 | 500 | 500 | 1 | 10+1 | 100 |
| F2 | 500 | 500 | 2 | 10+1 | 100 |
| F3 | 500 | 500 | 3 | 10+1 | 100 |
| F4 | 500 | 1000 | 1 | 10+1 | 100 |
| F5 | 500 | 1000 | 2 | 10+1 | 100 |
| F6 | 500 | 1000 | 3 | 10+1 | 100 |
| F7 | 500 | 1500 | 1 | 10+1 | 100 |
| F8 | 500 | 1500 | 2 | 10+1 | 100 |
| F9 | 500 | 1500 | 3 | 10+1 | 100 |
Table 2: Formulation of Indinavir Sulfate Microspheres
Particle size determination:
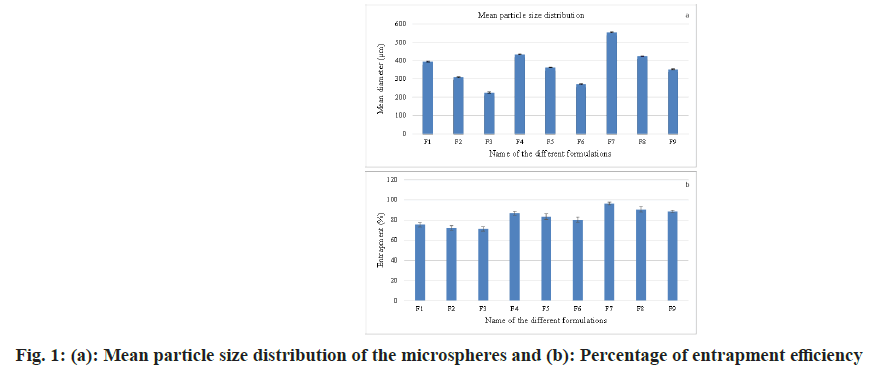
The microspheres were subjected to granulometric study using a standard American Society for Testing and Materials (ASTM) sieve set comprising of a nest of sieves ranging from # 16 to # 80 mesh ASTM (having apertures of 1000 μm, 710 μm, 500 μm, 355 μm, 250 μm and 180 μm). For around 10 min, the microspheres were sieved by a mechanical sieve shaker (Cuprit Electrical Co. India). Then, on each sieve, the particles retained were weighed and on each sieve, the percentage retained was calculated. The percentage weight retained vs. particle histogram was plotted (fig. 1a)[22,28,29].
Effect of polymer ratio:
At the point when the ratio of drug to polymer was 1:1 (F1-F3), there was the creation of tiny-sized microspheres and as the concentration of polymer expanded from ratio 1:1 to 1:3, the particle size expanded and the mean particle size also increased (fig. 1a)[27,30-33].
Drug entrapment efficiency:
By extracting, in triple-distilled water, the quantity of indinavir sulfate existing in the microspheres was determined. 50 mg of the crushed and powdered microspheres was taken and dissolved in 2 ml of acetone and again extracted with 50 ml of triple distilled water and retained on a mechanical shaker for 24 h. The solution was separated through "Whatman No.1" filter paper and after suitable dilutions by using triple-distilled water, the content of indinavir sulfate was determined in Ultraviolet- Visible (UV-Vis) spectrophotometrically at 259 nm (Elico, SL159). The drug content and entrapment efficiency were calculated from the observed optical density data (fig. 1b)[34,35].
Drug entrapment efficiency=Experimental drug content/Theoretical drug content×100 (1)
Fourier Transform Infrared (FTIR) spectrometry
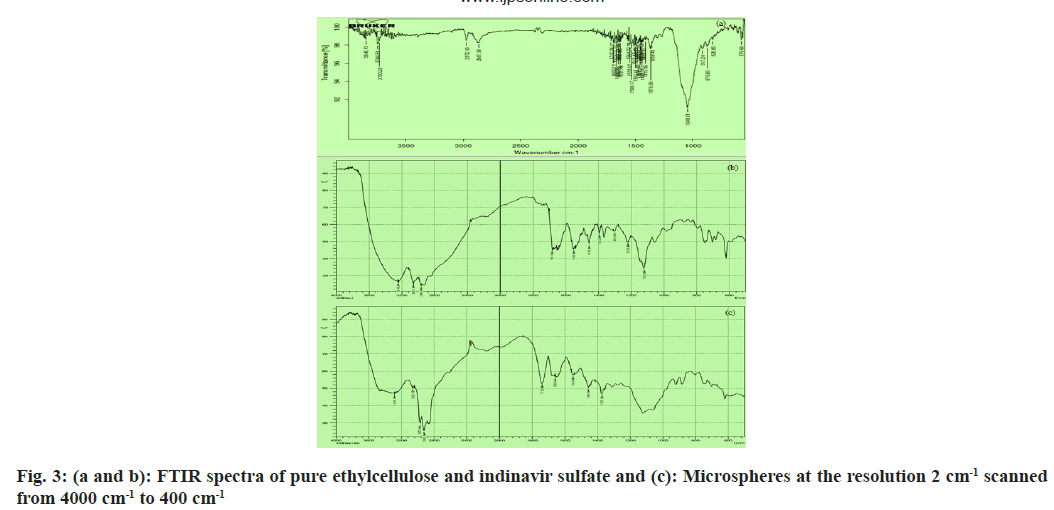
FTIR spectroscopy is used to specify interactions between drugs and polymers. The spectra of complete drug and drug-loaded microspheres were recorded using FTIR JASIO (Model No.410). Potassium bromide (KBr) discs were used to hold open the prepared samples (2 mg sample in 200 mg KBr). The FTIR spectroscopy scanning range was 400-4000 cm-1 and the resolution was 2 cm-1[30-32].
Scanning Electron Microscopy (SEM) analysis:
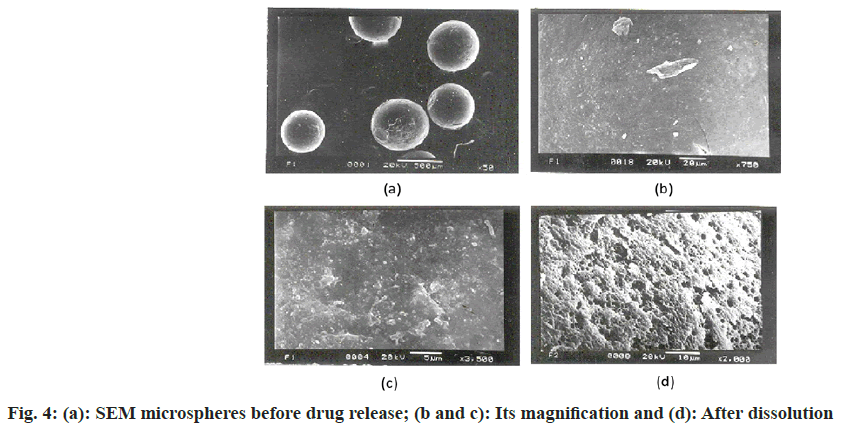
Joel JSM-5200, SEM was utilized to describe the surface geography of formulating microspheres. Along with the metallic support, the microspheres were positioned with a thin, sticky tape and under vacuum, the microspheres were covered with gold (Fine coat, ion sputter JFC-1110) to make them electron conductive. The surface was analyzed and photomicrographs were captured at a 20 kV accelerating voltage for the drug-loaded microspheres. The drug-loaded microsphere photomicrographs before and after dissolution were taken[22,27,33].
X-ray powder diffractometry:
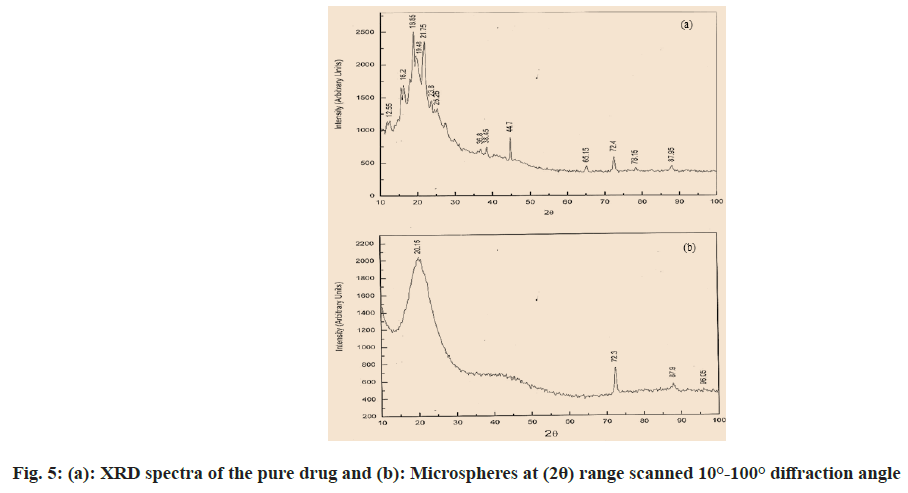
An X-Ray Diffraction (XRD) analysis was completed to look at the impact of the microencapsulation procedure on the crystallinity of the active ingredient. Powder XRD patterns were recorded on Rigaku, Japan (Model-Meniflex) using K-β filter CuK radiation, a voltage of 30 Kv and a current of 25 mA. The scanning rate employed was 2°/min, over the 100- 1000 diffraction angle (2θ) range. The XRD patterns of drug powder and drug-loaded microspheres were recorded. Drug-loaded microspheres and pure drug were triturated to get a fine powder. Approximately 500 mg of powder samples were collected for the XRD study[26,36].
In vitro drug release study:
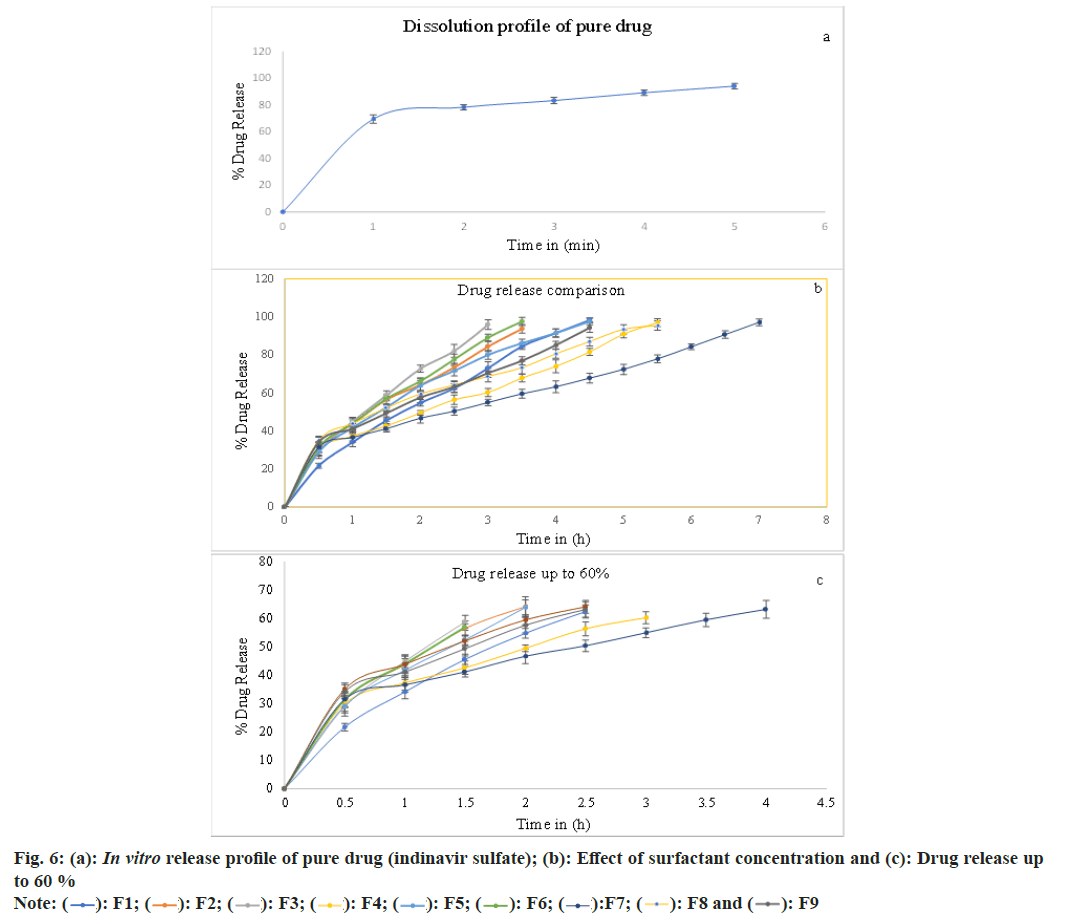
The in vitro release study of the microsphere was carried out using the United States Pharmacopeia (USP)-XX 8-basket dissolution apparatus (Lab India, Model No. DISSO 2000) at 100 rpm at 37°±0.5°. A dissolution study was performed in the triple distilled water, taking 500 ml for each study. At 0.5 h time interims, 5 ml samples were pulled back and supplanted by an equivalent volume of fresh dissolution medium, keeping up sink condition all through the test. At a predetermined time, interval (i.e., 0.5 h), 5 ml samples were withdrawn from the basket containing 100 mg of the microsphere and the process was continued up to the complete drug release and indinavir sulfate content was determined by UV-Vis spectrophotometer at 259 nm[22,26,33].
Release kinetics:
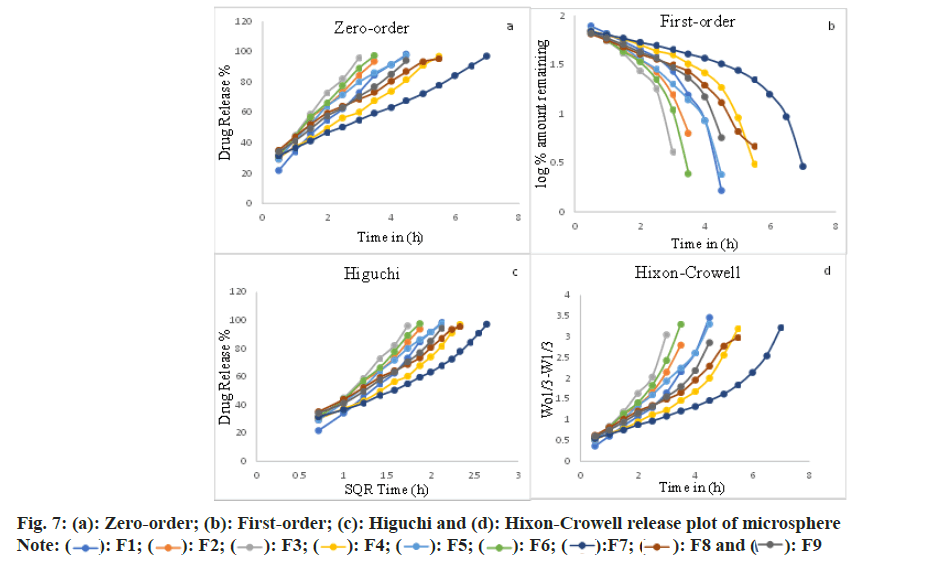
Procured data were fed into various kinetic equations from in vitro release reports to determine the mechanism of drug release in ethylcellulose microspheres models was utilized
Zero-order Qt=Q0+k0 t (2)
First-order ln Q=ln Q0-K1.t/2.303 (3)
Higuchi equation Q=KH t1⁄2 (4)
Hixson-Crowell W0 1⁄2-Wt 1⁄3=kHC t (5)
Where, the quantity of drug released in time t is Q, the preliminary quantity of medicament in the microsphere is Q0, the surface area of the microsphere is S and the rate constant of zero-order, first-order and Higuchi rate equations is k0, k1 and kH, respectively. In addition to these basic release models, there are several other models as well. One of them is Korsmeyer Peppa’s equation (power-law) [33].
Korsmeyer Peppa’s equation Mt⁄M∞=K tn (6)
Where, the quantity of drug released at time t is Mt and the amount released at a time is M∞ where t=∞, thus Mt/M∞ is the at-a-time ‘t’ fraction of drug released, the kinetic constant is known as ‘k’, and the diffusion exponent is ‘n’, for both the solvent penetration and drug release mechanism, characterized by the above equation. The correlation coefficient (r2) was set up by executing the obtained data into various kinetic models. From the slope, the rate constants of the respective models were calculated[6,27]. The ‘n’ esteem is utilized to portray different releases for spherical-shaped substances and it is depicted in Table 3. On the occasion of spherical microspheres, Fickian diffusion occurs when n≤0.43 and non- Fickian transport occurs when 0.43<n<0.85. Case II (relaxational) transport occurs when n=0.85 and super-case II transport occurs when n>0.85[37,38].
| Formulations | Zero-order | First-order | Higuchi | Hixon Crowell | Korsmeyer's equation | Release exponent (n) |
|---|---|---|---|---|---|---|
| r2 | ||||||
| F1 | 0.9974 | -0.9118 | 0.9953 | 0.971 | 0.9991 | 0.6711 |
| F2 | 0.9976 | -0.9527 | 0.9958 | 0.9818 | 0.9976 | 0.5341 |
| F3 | 0.9975 | -0.933 | 0.9972 | 0.975 | 0.9994 | 0.6433 |
| F4 | 0.998 | -0.9009 | 0.9817 | 0.9541 | 0.9817 | 0.3955 |
| F5 | 0.9891 | -0.9492 | 0.9992 | 0.989 | 0.9993 | 0.5318 |
| F6 | 0.9985 | -0.9244 | 0.9957 | 0.9728 | 0.9974 | 0.5357 |
| F7 | 0.9972 | -0.8867 | 0.9784 | 0.947 | 0.9744 | 0.328 |
| F8 | 0.995 | -0.9553 | 0.9952 | 0.9827 | 0.9942 | 0.3785 |
| F9 | 0.9989 | -0.9313 | 0.9884 | 0.9693 | 0.9864 | 0.371 |
Table 3: Kinetic Table for Indinavir Sulfate Microspheres
Results and Discussion
The two factors, three levels of the factorial design implemented for improvement. The Span 80 concentration and ethylcellulose quantity varied as stated in the strategy in Table 1. The other processing variables are maintained throughout the experiments, but the acetone, methanol and light liquid paraffin are fixed. Trial preliminaries were conducted for all nine potential combinations. As shown in fig. 1a, the mean particle size of the formulations was found to be between 224 μm and 553 μm. The mean molecule size dissemination was observed to be influenced by factors (concentrations of surfactants and drug-polymer ratio)[5-7]. The entrapment percentage was found in ascending order when the percentage of surfactant was enhanced from 1 % to 3 % (fig. 1b)[5,7]. As the ratio of the drug and polymer enhanced from 1:1 to 1:3 or the concentration of polymer expanded, the mean particle size grew; this is due to the fact that as the concentration of polymer increased, solution viscosity additionally expanded, resulting in larger particles and the extended-release observed (fig. 1a).
As the particle size expanded from the formulation having the same surfactant concentration, the entrapment efficiency enhanced (fig. 1b), and the drug release rate became slow due to the enhanced particle diameter. The enhanced diameter results in the drug passing through a long diffusion path length, so drug release becomes slow and extended.
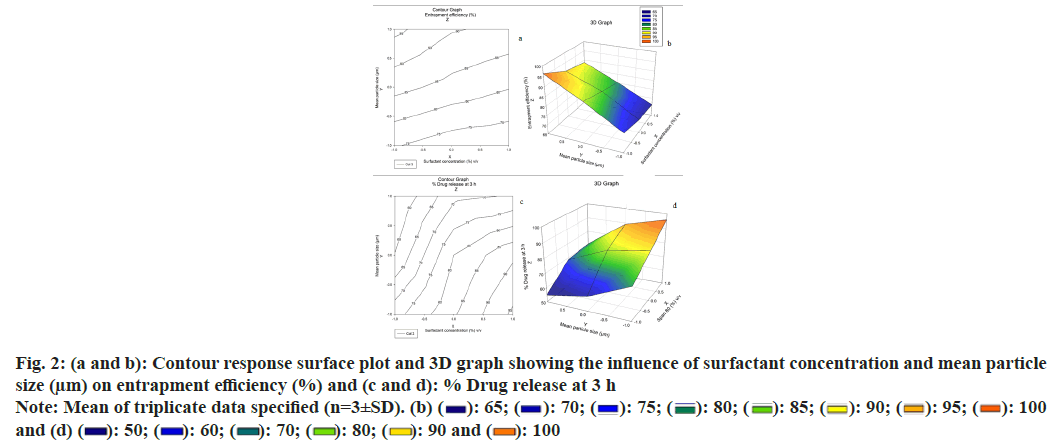
Concentrations of surfactants utilized have an impact on the molecule size distribution of the microspheres. The surfactant Span 80 (1 %) v/v (Span, Hydrophilic- Lipophilic Balance (HLB)-4.3, hydrophobic) makes greater molecular size microspheres compared to Span 80 (3 %) v/v. The oil-soluble surfactant Span 80 produces a stable emulsion when oil is the dispersion medium and this may clarify why smaller particle sizes are acquired with Span 80 (3 %) v/v. The dispersing agent/surfactant concentration influences the particle size. That means that as the surfactant concentration builds up, the particle size decreases as well. This is because of the addition of surfactant concentration, the internal droplets become more stable, which prevents coalescence. Likewise, when a greater quantity of surfactants is included, there is a speeded-up dispersion of microcapsules in the microencapsulation system[6,7,23]. From the Three Dimensional (3D) graph, it was concluded that as the concentration of surfactant expands from 1 % to 3 % the mean particle size diminished, and due to the creation of small particles, the entrapment efficiency also diminished. Fig. 2a and fig. 2b show the contour plot and response surface plot for the percentage of entrapment efficiency, revealing that an increase in the percentage of entrapment efficiency was found with increasing mean particle size and decreasing surfactant concentration.
Furthermore, the findings revealed that the influence of mean particle size was significant. According to the regression, X1 and X2 were significant model terms that affected the microspheres entrapment efficiency percent. The contour plot and response surface plot for percent drug release at 3 h were shown in fig. 2c and fig. 2d, respectively and demonstrated that an increase in mean particle size and a drop in surfactant concentration resulted in a commensurate decrease in the percent drug release rate of microspheres. There was no evidence of interaction or nonlinearity.
Through FTIR (fig. 3a), all noticeable peak data showed at 3246.31cm-1, 3061.13cm-1, 2964.69cm-1, 2874 cm-1, 1681.98cm-1 and 1220.98cm-1 corresponding to the OH stretching, NH stretching of a secondary amine, C-H stretching (-C≡CH), C-H stretching (CH3), C-H stretching (asymmetric), C-H stretching (symmetric) and C=O stretching of surfactant didn’t shift or deviate in the spectra of the drugs when manufactured into microspheres[23,26]. The microspheres possess an even and plain surface that was followed by SEM of drug-loaded ethylcellulose microspheres (fig. 4). Some crystals are deposited on the surface, which is probably contracted from the initial burst release of the drug. The SEM micrograph shows porosity developing on the surface after 7 h of drug release (fig. 5a). In ethylcellulose manufactured microspheres, the surface porosity is vital for medicament release. From microspheres through the pores, the drug release happens by dissolution and diffusion mechanism regardless of whether the polymer is biodegradable or not. The water permitted by ethylcellulose saturates its surface without itself dissolving in it. The micrographs show that porosity developed, but the construction was retained for a 7 h drug release study[5,22]. Be that as it may, drugloaded microspheres in XRD showed a distinctive diffraction pattern, which was less intense when contrasted with the pure medicament (fig. 4). The loss of sharpness in the microspheres demonstrated in the polymer matrix lessened the crystallinity of the medicament[26,36].
The in vitro release studies reveal that (fig. 6), as the quantity of the surfactant increased at a constant polymer to drug ratio, the rate and amount of drug release also increased. This is attributed to the decrease in particle size, increases in wettability and better solvent penetration as the surfactant concentration increased. In vitro release studies in triple-distilled water show that the rate of drug release was faster in the case of surfactant Span 80 (3 %) v/v. This is attributed to the small molecule size and an increase in the surface area of the microsphere. Desired size microspheres were formed at a concentration of Span 80 (2 %) v/v. This conforms to the theory of surface-active agents and then the increase in surfactant concentration leads to reduced particle size, increased surface area and increased drug release[6,37].
The release of indinavir sulfate from the microspheres exhibits diffusional qualities and intently pursues the zero-order (F1-F4, F6, F7 and F9) and is exceedingly associated with the Higuchi release model (F5 and F8). It was presented from experiment results that; the quantity of surfactants has vital effects on the functioning of the microspheres when the microspheres are made by the solvent evaporation method. Good spherical microspheres were produced by using Span 80. The drug release rate from microspheres was observed to be slower using Span 80 (1 %) v/v and faster using Span 80 (3 %) v/v. The pace of drug release can be traced by the zero-order equation and is also closely related to the Higuchi equation (fig. 7)[38]. The ‘n’ data of the formulations F4 and F7-F9 were obtained below 0.43 (for a sphere), which specifies Fickian transport. Non- Fickian transport is specified by the formulations F1-F3, F5 and F6 'n' values found between 0.43 and 0.85[39-41].
Acknowledgements:
The authors wish to give thanks to the University Department of Pharmaceutical Sciences, Utkal University, Bhubaneswar, Orissa, India, authorities for providing a suitable research laboratory to carry out this project work and my deep gratitude to Cipla, Ltd., Mumbai, India, for providing indinavir sulfate drug and thanks to the Indian Institute of Technology, Kharagpur for XRD and SEM studies, and Utkal University for FTIR studies, for those who helped us in carrying out this project.
Conflict of interests:
The authors declared no conflict of interests.
References
- Aarnoutse RE, Schapiro JM, Boucher CA, Hekster YA, Burger DM. Therapeutic drug monitoring-An aid to optimizing response to antiretroviral drugs? Drugs 2003;63(8):741-53.
[Crossref] [Google Scholar] [PubMed]
- Li SP, Kowarski CR, Feld KM, Grim WM. Recent advances in microencapsulation technology and equipment. Drug Dev Ind Pharm 1988;14(2-3):353-76.
- Lu Y, Park K. Microencapsulation: Methods and pharmaceutical applications. Encyclopedia of Pharmaceutical Science and Technology. 4th ed. In Forma Healthcare USA, New York, USA; 2012. p. 1-3.
- Chong-Kook K, Mi-Jung K, Kyoung-Hee O. Preparation and evaluation of sustained release microspheres of terbutaline sulfate. Int J Pharm 1994;106(3):213-9.
- Rama K, Senapati P, Das MK. Formulation and in vitro evaluation of ethyl cellulose microspheres containing zidovudine. J Microencapsul 2005;22(8):863-76.
[Crossref] [Google Scholar] [PubMed]
- Lalduhsanga P, Sushanta S, Bhaskar M. The study of the effects of surfactants on ethyl cellulose microspheres containing salbutamol sulphate. Der Pharm Lett 2009;1:65-74.
- Yadav VK, Rai AK, Ghosh AK. A study on the effects of different surfactants on morphology and drug release of repaglinide microspheres. Int J Res Dev Pharm Life Sci 2017;6(5):2786-92.
- Lambert O, Nagele O, Loux V, Bonny JD, Marchal-Heussler L. Poly (ethylene carbonate) microspheres: Manufacturing process and internal structure characterization. J Control Release 2000;67(1):89-99.
[Crossref] [Google Scholar] [PubMed]
- Arshady R. Microspheres and microcapsules, a survey of manufacturing techniques: Part III: Solvent evaporation. Polymer Eng Sci 1990;30(15):915-24.
- Bezemer JM, Radersma R, Grijpma DW, Dijkstra PJ, van Blitterswijk CA, Feijen J. Microspheres for protein delivery prepared from amphiphilic multiblock copolymers: Influence of preparation techniques on particle characteristics and protein delivery. J Control Release 2000;67(2-3):233-48.
[Crossref] [Google Scholar] [PubMed]
- Blanco D, Alonso MJ. Protein encapsulation and release from poly (lactide-co-glycolide) microspheres: Effect of the protein and polymer properties and of the co-encapsulation of surfactants. Eur J Pharm Biopharm 1998;45(3):285-94.
- Jalil R, Nixon JR. Microencapsulation using poly (L-lactic acid) II: Preparative variables affecting microcapsule properties. J Microencapsul 1990;7(1):25-39.
[Crossref] [Google Scholar] [PubMed]
- Pradhan RS, Vasavada RC. Formulation and in vitro release study on poly (DL-lactide) microspheres containing hydrophilic compounds: Glycine homopeptides. J Controlled Release 1994;30(2):143-54.
- Diaz RV, Soriano I, Delgado A, Llabrés M, Evora C. Effect of surfactant agents on the release of 125I-bovine calcitonin from PLGA microspheres: In vitro-in vivo study. J Controlled Release 1997;43(1):59-64.
- Garud N, Garud A. Preparation and in vitro evaluation of metformin microspheres using non-aqueous solvent evaporation technique. Trop J Pharm Res 2012;11(4):577-83.
- Lewis L, Boni R, Adeyeye CM. Effect of emulsifier blend on the characteristics of sustained release diclofenac microspheres. J Microencapsul 1998;15(3):283-98.
[Crossref] [Google Scholar] [PubMed]
- Jelvehgari M, Nokhodchi A, Rezapour M, Valizadeh H. Effect of formulation and processing variables on the characteristics of tolmetin microspheres prepared by double emulsion solvent diffusion method. Indian J Pharm Sci 2010;72(1):72.
[Crossref] [Google Scholar] [PubMed]
- Moussa D, Kassab R, Yammine P. Study of different processing parameters for polylactic acid microspheres formulations. Int J Pharm Sci Res 2014;5(10):4176.
- Rao CG, Vijayanarayana K, Kumar MM, Radigues SR, Stayanarayana D, Subrahmanyam ES. Nimesulide incorporated liquid micropheres: An approach to targeting and controlled release. Indian J Pharm Sci 2005;67(3):292.
- Indinavir, MK1. Protein Data Bank.
- Kathleen P. Martindale: The complete drug reference. 32rd ed. Pharmaceutical Press: London; 1999. p. 614-5.
- Sahoo SK, Behera AL, Patil SV, Barik BB, Safhi MM. Consequences of formulation variables on physicochemical properties of indinavir sulfate microspheres. Jordan J Pharm Sci 2011;4(3):251-60.
- Sethi RK, Sahoo SK, Das PK, Barik BB. Effect of dispersing agent on the characteristics of eudragit microspheres. Res J Pharm Dosage Forms Technol 2010;2(1):67-71.
- Panwar MM. Factorial design approach for optimization of floating microspheres of diltiazem hydrochloride. Asian J Pharm 2015;9(3):206-12.
- Soni G, Yadav KS, Gupta MK. Design of experiments (DoE) approach to optimize the sustained release micro particles of gefitinib. Curr Drug Deliv 2019;16(4):364-74.
[Crossref] [Google Scholar] [PubMed]
- Sahoo SK, Mallick AA, Barik BB, Senapati PC. Formulation and in vitro evaluation of Eudragit® microspheres of stavudine. Trop J Pharm Res 2005;4(1):369-75.
- Yuce M, Canefe K. Indomethacin-loaded microspheres: Preparation, characterization and in vitro evaluation regarding ethylcellulose matrix material. Turk J Pharm Sci 2008;5(3):129-42.
- Martin A. Micromeritic, Physical Pharmacy. 4th ed. Lea Febiger. Philadelphia; 1993. p. 431-8.
- Subramanyam CVS. The text book of physical pharmaceutics. 2nd ed. Vallabh Prakashan: Delhi; 2003. p. 195-228.
- Arul B, Kothai R, Sangameswaran B, Jayakar B. Formulation and evaluation of chitosan microspheres containing isoniazid. Indian J Pharm Sci 2003;65(6):640-2.
- Saha N, Hasan I, Nazmi M, Reza MS. Design and development of sustained release microspheres of ibuprofen by emulsification solvent evaporation method using polymeric blend. Bangladesh Pharm J 2013;16(1):39-44.
- Thejaswi N, Srinivas P, Mamidi SA, Shah S. Preparation and characterization of goserelin acetate loaded microspheres. Int J Pharm Pharm Sci 2013;5(1):184-9.
- Das MK, Rao KR. Evaluation of zidovudine encapsulated ethylcellulose microspheres prepared by water-in-oil-in-oil (w/o/o) double emulsion solvent diffusion technique. Acta Pol Pharm Drug Res 2006;63(2):141-8.
[Google Scholar] [PubMed]
- Chatterjee A, Kumar L, Bhowmik BB, Gupta A. Microparticulated anti-HIV vaginal gel: In vitro-in vivo drug release and vaginal irritation study. Pharm Dev Technol 2011;16(5):466-73.
[Crossref] [Google Scholar] [PubMed]
- Fernandes AV, Pydi CR, Verma R, Jose J, Kumar L. Design, preparation and in vitro characterizations of fluconazole loaded nanostructured lipid carriers. Braz J Pharm Sci 2020;56.
- Nath B, Nath LK, Mazumder B, Kumar P, Sharma N, Sahu BP. Preparation and characterization of salbutamol sulphate loaded ethyl cellulose microspheres using water-in-oil-oil emulsion technique. Iranian J Pharm Res 2010;9(2):97-105.
[Google Scholar] [PubMed]
- Peppas NA, Sahlin JJ. A simple equation for the description of solute release III. Coupling of diffusion and relaxation. Int J Pharm 1989;57(2):169-72.
- Siepmann J, Siepmann F. Mathematical modeling of drug delivery. Int J Pharm 2008;364(2):328-43.
[Crossref] [Google Scholar] [PubMed]
- Ritger PL, Peppas NA. A simple equation for description of solute release II. Fickian and anomalous release from swellable devices. J Control Release 1987;5(1):37-42.
- Siepmann J, Peppas NA. Modeling of drug release from delivery systems based on hydroxypropyl methylcellulose (HPMC). Adv Drug Deliv Rev 2012;64:163-74.
[Crossref] [Google Scholar] [PubMed]
- Chowdary KR, Rao NK, Malathi K. Ethyl cellulose microspheres of glipizide: Characterization, in vitro and in vivo evaluation. Indian J Pharm Sci 2004;66(4):412.
