- *Corresponding Author:
- K. Nagappan
Department of Pharmaceutical Analysis, JSS College of Pharmacy, JSS Academy of Higher Education and Research, Nilgiris, Tamil Nadu 643001, India
E-mail: krisath@jssuni.edu.in
| Date of Received | 28 March 2023 |
| Date of Revision | 13 July 2023 |
| Date of Acceptance | 08 March 2024 |
| Indian J Pharm Sci 2024;86(2):642-653 |
This is an open access article distributed under the terms of the Creative Commons Attribution-NonCommercial-ShareAlike 3.0 License, which allows others to remix, tweak, and build upon the work non-commercially, as long as the author is credited and the new creations are licensed under the identical terms
Abstract
A simple, specific, accurate, precise and robust ultra-performance liquid chromatography-photodiode array detection method for quantifying lunasin peptide in pure form or in plant based vegan supplements was developed and validated. Chromatographic separation was achieved on Accucore C18 column (50 mm×4.6 mm, 2.6 µm) with 0.1 % formic acid in water (A) and 0.1 % formic acid in acetonitrile (B) delivered isocratically (50:50 v/v) at a flow rate of 0.4 ml/min for 10 min and the detection was monitored at 216 nm. Lunasin was eluted at a retention time of 4.94 min with a total runtime of less than 6 min. The chromatographic parameters were optimized using the Box-Behnken design with a sample set of 30 experimental runs. The developed ultraperformance liquid chromatography-photodiode array detection method was validated in accordance with the International Council for Harmonisation Q2(R1) guideline and evaluated the parameters such as system suitability, linearity, sensitivity, accuracy, precision, specificity and robustness. The method was found to be linear within the concentration range of 0.50-10.0 µg/ml. The developed method could be a viable candidate for routine quantification of lunasin peptide in nutraceutical formulations.
Keywords
Lunasin protein, experimental design, reversed phase liquid chromatography, analytical chemistry method, validation studies, quantitative evaluation, dietary supplements
Lunasin is a soybean peptide[1], that can bind to chromatin, disrupting kinetochore formation and inhibiting mitosis[2]. The nontoxic chemopreventive potential of lunasin can be attributed to the 43 amino acid sequence's uniqueness, specifically the presence of a polyaspartyl end at the C-terminus[1], a highly negatively charged domain with eight aspartic acid residues that appears to bind to deacetylated histones and inhibits mitosis[3,4]. Several studies have reported evidence of lunasin's in vitro and in vivo chemopreventive activity[5-17]. In the early 2000s, lunasin was purified, identified and quantified from different matrices using ion- exchange column chromatography[18-20], sodium dodecyl-sulfate polyacrylamide gel electrophoresis and western blot[18-22]. Jeong et al.[19], was the first to describe the use of Mass Spectrometric (MS) methods to characterize lunasin. They used matrix-assisted laser desorption/ionization peptide mass mapping to determine the conformation of identity of lunasin isolated from soybeans. In 2004, de Mejia et al.[21], developed an Enzyme Linked Immunosorbent Assay (ELISA) technique for quantifying lunasin from soybeans and related products. Since then, ELISA has been the most used technique for quantifying lunasin in many studies[23]. MS which was regarded as one of the most robust and specific techniques for qualitative and quantitative analysis of analytes was used to identify lunasin from matrices other than soybeans, such as wheat[24] and amaranth[25]. MS techniques combined with gel-based separation yield useful information about peptide/protein compositions. Jeong et al.[24], used Liquid Chromatography coupled to Mass Spectrometry (LC-MS) with an Electrospray Ionization interface (LC-ESI-MS) for the first time to identify lunasin. In subsequent studies, the use of liquid chromatographic separation was restricted to preparative to purify lunasin from wheat[24], Solanum nigrum L.[26] rye[27], millets[28] and barley[29] extracts rather than quantification. Because of the complexities of the samples, many studies have used chromatographic techniques to separate peptides. Choosing an analysis method is also influenced by the chemical composition and stability of the analyte to be measured.
The last decade witnessed growing interest towards the development of the Liquid Chromatography coupled with tandem Mass Spectrometric (LC-MS/ MS) technique for the characterization[30-33] and quantification[34-38], of lunasin. However, the MS technique for analyte quantification has a higher operational cost, a more limited sample throughput and less favorable concentration sensitivity. The availability of MS instruments is also an important factor in the application of the LC-MS technique to analyte analysis. High-Performance Liquid Chromatographic (HPLC) technique is widely used for qualitative and quantitative analysis and it can analyze a wide range of biomolecules, organic molecules, polymers and ions in various matrices[39]. When compared to LC-MS, HPLC analysis is considered simple and has lower acquisition and operational costs[40]. HPLC has been used for decades to analyze a wide range of analytes and is affordable to many research facilities that cannot afford hyphenated and expensive instruments such as LC-MS[40]. When compared to the conventional Reverse Phase-HPLC technique, the RP-Ultra Performance Liquid Chromatographic (RP-UPLC) technique operates at high pressures (15 000 psi) and allows for smaller particle size columns (≤2.6 µm), which allows for improved peptide resolution and sensitivity, lower solvent consumption and shorter run times[41]. Owing to these advantages, the use of UPLC and HPLC techniques for the separation and quantification of proteins and peptides is relatively rare. In the case of lunasin, a recent study[42], reported an HPLC technique for its quantification.
The separation characteristics of analytes are influenced by a variety of factors that influence Liquid Chromatographic (LC) separation of analytes. Proteins and peptides exhibit different chromatographic behavior than small molecules due to their large size. Peptide retention during LC separation is influenced by factors such as mass loading, elution gradient and flow rate of mobile phase delivery, column hydrophobicity, particle size, length, temperature and ion pairing of the peptides[43]. Optimization of LC parameters during analyte method development using Response Surface Methodology (RSM), a component of the Design of Experiment (DoE) approach in Analytical Quality-by-Design (AQbD) paradigm has recently been used in many studies due to its advantage in optimizing UPLC methods with the least number of runs and the greatest efficiency[44]. Box-Behnken Design (BBD) is a RSM that is used in experimental design to investigate the interaction between many variables and their effect on a response[45]. It is a statistical strategy that can aid in determining the ideal values of variables that will result in the intended outcome. The BBD incorporates three levels of each variable and employs a set of equidistant design points. This results in a design matrix that is reasonably simple to analyze and efficient in terms of the number of tests required getting findings. BBD is often considered to provide efficient, simple, adaptable and robust experimental output[45]. Overall, BBD is a highly successful and efficient experimental design method that can provide useful insights into the interaction between many variables and their effect on a response.
Currently, no LC methods have been reported that have used the DoE approach for method optimization and no assays have been reported for quantifying lunasin in commercially available supplements, based on a review of 256 articles covered by Web of Science. The present study will focus on the use of BBD methodology to optimize selected UPLC-Photodiode Array Detection (UPLC-PDA) method parameters to improve the separation of lunasin peptide and the application to assay commercially available lunasin supplements.
Materials and Methods
Chemicals, reagents, and samples:
Synthetic lunasin peptide (≥98 %) was purchased from LifeTein LLC., (Somerset, NJ, USA). Acetonitrile and methanol of LC-MS grade were purchased from Honeywell International Inc., (Muskegon, MI, USA). Formic acid (≥95 %) and glacial acetic acid (≥99.5 %) of Laboratory Reagent (LR) grade were purchased from Sigma-Aldrich, India. Ultrapure water with resistivity >3 MΩcm- 1 at 25° and Total Organic Carbon (TOC)<5 ppb was obtained from the Milli-Q UF-Plus system (Millipore, USA).
Plant-based vegan capsules (CAREFAST®, USA) containing a plant-based bioactive peptide complex from soy and pea extract (lunasin; 210 mg per capsule) and other ingredients such as calcium phosphate and hypromellose were used to quantify the lunasin peptide.
Instrumentation:
Chromatographic analyses were carried out using a Waters ACQUITY® UPLC-PDA H-Class (Milford, MA, USA) system equipped with a binary solvent manager, autosampler, thermostatted sample manager and column holder, and a PDA. The chromatographic data was acquired and processed using MassLynx® version 4.1 (Milford, MA, USA). Standard and sample weighing were carried out using a Mettler-Toledo XP6/52 precision weighing balance (GmbH, Im Langacher 44, 8606 Greifensee, Switzerland). Solvent handling and dilutions were performed using Transferpette® S single channel micropipettes (BrandTech Scientific Inc., Wertheim, Germany).
BBD:
Design-Expert software (Stat-Ease, Inc., Minneapolis, MN, USA) was used to develop, fit, and interpret a BBD using analytical and graphical techniques. Four independent variables were evaluated for their influence on analyte peak separation characteristics such as T, Retention time (Rt), peak area and N These variables were acetonitrile content in the mobile phase (%), column oven temperature (°), flow rate (ml/min) and injection volume (µl). Each independent variable was assessed at three coded levels (-1, 0, +1) and the BBD had six center points, yielding a sample set of 30 experimental runs which is quadratically processed using a polynomial model. Each response was assessed for model fitness (linear, 2 Formulation Index (FI), quadratic, and cubic) and Analysis of Variance (ANOVA), the later determines the significance of interactions between variables and a specific response. Diagnostic plots such as the normal plot, the box- cox plot, the residual vs. prediction plot, and the cook's distance are used to identify any outlying interactions that may affect the model's fitness. Contour plots and three-dimensional surface plots aid in visualizing the interaction effects of two variables on a response in each experimental run. The numerical and graphical optimization allow for further optimization of the BBD using desired variable and response ranges to achieve a robust Method Operable Design Region (MODR). The predicted runs with optimal values for each variable and a high desirability value are confirmed by calculating the difference between the mean responses obtained after replicate (n=5) analyses and the predicted response value (95 % confidence interval).
UPLC parameters:
Chromatographic separation of lunasin peptide was achieved on AccucoreTM C18 column (50 mm×4.6 mm, 2.6 µm) with 0.1 % formic acid in water (A) and 0.1 % formic acid in acetonitrile (B) delivered isocratically (50:50 v/v) at a flow rate of 0.40 ml/min for 10 min. Detection was monitored in the wavelength range of 198-780 nm. The sample injection volumes were 5 µl. Mobile phase components were filtered using 0.45 µm WhatmanTM membrane filters (Maidstone, Kent, England) and sonicated for 30 min. The chromatograms were automatically integrated for the analyte peak area, Rt (min), T and N using MassLynx version 4.1 software.
Standard solutions:
A primary stock solution of synthetic lunasin peptide was prepared using a solvent mixture of 0.1 % formic acid in water and acetonitrile (90:10 v/v) to achieve a final concentration of 1 mg/ml. Working standard solution of 100 µg/ml was prepared using the same solvent mixture on weekly basis. Subsequent dilutions were prepared using mobile phase freshly prior to the analysis. All solutions were stored under refrigeration at -20°.
Calibration curve:
Standard solutions for calibrations are prepared from working standard solutions by measuring and appropriate aliquots into 10 ml volumetric flasks and then made up to the volume using mobile phase to achieve six concentrations in the range of 0.5- 10 µg/ml. Each concentration level was analyzed in replicates (n=5), and the peak analyte areas were recorded, calculated for mean peak area, and plotted against the respective concentration to perform linear regression analysis and obtain regression equation.
Assay of lunasin in Standard Reference Material (SRM) 3232 kelp powder (Thallus laminariae):
Synthetic lunasin standard was added to the extracts of the SRM 3232 kelp powder (NIST, Gaithersburg, MD, USA) at three levels within the calibration range. Prior to this, a weight of SRM 3232 kelp powder equivalent to the content of each lunasin supplement capsule was weighed and ultrasonically extracted with 0.1 % aqueous formic acid (1:5 w/v) for 25 min. The extract was collected and centrifuged at 10 000 rpm at -4° for 20 min before aliquoting the clear supernatant. Appropriate aliquots of working standard solution were added to the extract supernatants and diluted with mobile phase to achieve final concentrations 5 times, 35 times, and 75 times higher than the lowest calibration concentration.
Assay of lunasin in plant-based vegan capsules:
The contents of each capsule were separated to remove the capsule shell, weighed and ultrasonically extracted for 25 min with 0.1 % aqueous formic acid (1:5 w/v). The extracts were centrifuged at 10 000 rpm at -4° for 20 min before aliquoting the clear supernatant. The extraction was repeated twice, with the supernatants pooled and the solvent evaporated under vacuum. The dried residue was reconstituted and made up to the volume with mobile phase and filtered through 0.45 µm MF-MilliporeTM membrane filters (Burlington, MA, USA) prior to the UPLC-PDA analysis.
Validation:
The developed UPLC-PDA method for measuring lunasin in plant-based vegan capsules was validated using the International Conference on Harmonization (ICH) guideline Q2(R1)[46]. System suitability, linearity, accuracy, sensitivity, precision, specificity and robustness were all evaluated as validation parameters.
System suitability: The chromatographic system's suitability test was performed as the first step in the validation run. Six replicates (n=6) of standard lunasin solution (10 µg/ml) were injected, and the Rt; (min) and percentage Relative Standard Deviation (% RSD) of the peak areas were calculated. To be considered acceptable, the Rt (min) and % RSD of the peak areas should not exceed ±0.02 and 2.00 %, respectively.
Linearity: A six-point calibration curve was constructed with concentrations ranging from 0.5-10 µg/ml (0.5, 2.0, 4.0, 6.0, 8.8, 10 µg/ml). Each calibration concentration was analyzed in replicates (n=5) to record the mean peak areas, and a mean response vs. lunasin concentration was plotted using a linear regression mode of analysis to obtain the regression equation (y=mx+c).
Accuracy: The UPLC-PDA method's accuracy was determined by calculating lunasin recovery using the standard addition method. A known amount of lunasin standard solution was added to a pre- quantified lunasin sample solution at 80 %, 100 %, and 120 % levels. Three samples were prepared for each recovery level, and the solutions were then analysed to obtain percentage Recovery (% R) at each level.
Sensitivity: The Limit of Detection (LOD) and Limit of Quantification (LOQ) values of lunasin were calculated using the Standard Deviation (SD) of the mean peak area and the slope (M) of the calibration curve. As a result, signal-to-noise ratios of 3.3 and 10 are considered minimum for establishing LOD and LOQ.
Precision: To assess the precision of the analytical procedure, three quality control samples representing the low (1.0 µg/ml), medium (5.0 µg/ml), and high (10 µg/ml) levels within the linear range of concentrations were prepared. The precision was determined by evaluating the system precision, method precision (repeatability), and intermediate precision (reproducibility).
Specificity: The specificity of the method was determined by comparing the chromatograms of the standard lunasin and test sample. To confirm the analyte peak, the Rt (min) of the peak and the absorbance (nm) are compared.
Robustness: The method robustness was determined by assaying the test sample at various regions of the MODR. The chromatographic variables were altered to determine the deviation of the analyte response from the desired value.
Statistical analysis:
All data concerning the BBD were subjected to ANOVA using Design-Expert 12 (Stat-Ease, Inc., Minneapolis, MN, USA). Remaining calculation are performed using Microsoft Excel 2019 (Microsoft Corp., Redmond, Washington, United States of America).
Results and Discussion
Preliminary LC trails were carried out to optimize the stationary phase type (C8 or C18), organic solvent type (methanol or acetonitrile), and ion pairing agents (formic acid or acetic acid) on the retention and peak symmetry of the lunasin using UPCL-PDA. ACQUITY UPLCTM C8 (100 mm×2.1 mm, 1.7 µm), ACQUITY UPLCTM C18 (100 mm×2.1 mm, 1.7 µm; 50 mm×2.1 mm, 1.7 µm; 50 mm×1 mm, 1.7 µm) and AccucoreTM C18 (150 mm×2.1 mm, 2.6 µm; 100 mm×2.1 mm, 2.6 µm; 50 mm×4.6 mm, 2.6 µm) were tested and observed that AccucoreTM C18 (50 mm×4.6 mm, 2.6 µm) gave optimal analyte retention and peak symmetry. Previous LC methods[34–38,42] used C18 columns to separate lunasin, and our findings supported this. When compared to methanol, acetonitrile was found to be significant for the LC separation of lunasin because it resulted in higher peak intensity and lower baseline noise in the chromatograms. This finding was consistent with previous research[34–38,42] and could explain why methanol was not used as an organic phase in any of the studies. To facilitate better peak symmetry, ion pairing agents such as formic acid[34,35,37,42] and acetic acid[36], are frequently added to the mobile phase components, resulting in sensitive quantification of lunasin peptide in complex samples. As a result, we investigated the effect of adding various concentrations (0.5 %-0.3 %) of formic acid and acetic acid to both aqueous and organic phases and discovered that formic acid at a concentration of 0.1 % in both water and acetonitrile produced intense and symmetrical peaks. All preliminary experiments were performed with the column oven temperature held constant at 30°, an injection volume of 5.0 µl, and a mobile phase flow rate of 0.5 ml/min. Peaks were detected at 216 nm. The present study was carried out to improve the chromatographic separation of lunasin peptide (responses) and optimise the chromatographic parameters (independent factors) (Table 1). The experimentally determined responses correspond to analyte retention and peak symmetry for the 30 statistically calculated combinations (inputs) suggested by the BBD of experiments for the four variables (Table 2). The experimentally obtained responses was analysed using Design Expert software (StatEase Inc., Minneapolis, MN, USA), and the coefficients of the parameters in the second order polynomial were calculated and given by the regression equation (which gives the predicted responses) shown below, regardless of their significance:
| Factor | Name | Units | Minimum | Maximum | Coded Low | Coded High | Mean |
|---|---|---|---|---|---|---|---|
| A | Acetonitrile | % | 35 | 70 | -1↔35.0 | +1↔70.0 | 52.5 |
| B | Column oven temp. | ° | 20 | 40 | -1↔20.0 | +1↔40.0 | 30.0 |
| C | Flow rate | ml/min | 0.3 | 0.6 | -1↔0.30 | +1↔0.60 | 0.45 |
| D | Injection volume | µl | 3 | 7.5 | -1↔3.00 | +1↔7.50 | 5.25 |
Table 1: Coded Numeric Factors
| Run | Factor 1 | Factor 2 | Factor 3 | Factor 4 | Response 1 | Response 2 | Response 3 | Response 4 |
|---|---|---|---|---|---|---|---|---|
| A | B | C | D | T | Rt | Peak area | R4 | |
| 1 | 52.5 | 30.0 | 0.45 | 5.25 | 1.65 | 5.03 | 55213 | 6355 |
| 2 | 70.0 | 30.0 | 0.60 | 5.25 | 0.95 | 1.25 | 43182 | 1725 |
| 3 | 52.5 | 30.0 | 0.45 | 5.25 | 1.70 | 5.08 | 53764 | 5821 |
| 4 | 52.5 | 30.0 | 0.45 | 5.25 | 1.68 | 5.05 | 54299 | 6224 |
| 5 | 70.0 | 40.0 | 0.45 | 5.25 | 1.12 | 1.75 | 41550 | 1973 |
| 6 | 52.5 | 20.0 | 0.45 | 7.50 | 1.34 | 5.06 | 62357 | 7528 |
| 7 | 52.5 | 40.0 | 0.45 | 3.00 | 1.05 | 5.07 | 50565 | 6825 |
| 8 | 52.5 | 30.0 | 0.30 | 3.00 | 1.95 | 6.22 | 52473 | 7337 |
| 9 | 52.5 | 40.0 | 0.30 | 5.25 | 1.78 | 6.31 | 56632 | 7735 |
| 10 | 35.0 | 30.0 | 0.45 | 3.00 | 2.35 | 8.85 | 61925 | 11053 |
| 11 | 35.0 | 40.0 | 0.45 | 5.25 | 2.33 | 8.78 | 67755 | 11856 |
| 12 | 70.0 | 20.0 | 0.45 | 5.25 | 1.22 | 1.83 | 43492 | 1889 |
| 13 | 70.0 | 30.0 | 0.30 | 5.25 | 1.79 | 2.35 | 46115 | 2727 |
| 14 | 52.5 | 20.0 | 0.30 | 5.25 | 1.85 | 6.22 | 57269 | 7485 |
| 15 | 35.0 | 30.0 | 0.30 | 5.25 | 2.45 | 9.11 | 69665 | 11933 |
| 16 | 35.0 | 20.0 | 0.45 | 5.25 | 2.40 | 8.81 | 68144 | 11905 |
| 17 | 70.0 | 30.0 | 0.45 | 7.50 | 1.17 | 1.80 | 51064 | 1785 |
| 18 | 35.0 | 30.0 | 0.60 | 5.25 | 2.24 | 7.65 | 65102 | 9539 |
| 19 | 52.5 | 20.0 | 0.45 | 3.00 | 1.70 | 5.11 | 52067 | 7077 |
| 20 | 52.5 | 20.0 | 0.60 | 5.25 | 1.50 | 3.89 | 52712 | 5311 |
| 21 | 52.5 | 30.0 | 0.45 | 5.25 | 1.70 | 4.95 | 54355 | 5916 |
| 22 | 52.5 | 30.0 | 0.30 | 7.50 | 1.80 | 6.30 | 68281 | 7545 |
| 23 | 52.5 | 30.0 | 0.45 | 5.25 | 1.70 | 5.02 | 55022 | 6019 |
| 24 | 35.0 | 30.0 | 0.45 | 7.50 | 2.50 | 8.75 | 74578 | 12088 |
| 25 | 52.5 | 30.0 | 0.45 | 5.25 | 1.73 | 5.05 | 54812 | 6025 |
| 26 | 52.5 | 40.0 | 0.60 | 5.25 | 1.40 | 3.65 | 51594 | 5164 |
| 27 | 70.0 | 30.0 | 0.45 | 3.00 | 1.07 | 1.75 | 36657 | 1595 |
| 28 | 52.5 | 40.0 | 0.45 | 7.50 | 1.25 | 4.95 | 61211 | 7265 |
| 29 | 52.5 | 30.0 | 0.60 | 7.50 | 1.45 | 4.01 | 59855 | 5409 |
| 30 | 52.5 | 30.0 | 0.60 | 3.00 | 1.47 | 3.95 | 51358 | 5331 |
Table 2: BBD Experimental Runs
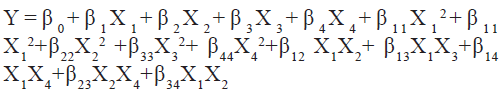
where, β0 is a constant; β1, β2, β3, β4 are linear coefficients; β12, β13, β14, β23, β24, β34 are cross product coefficients; β11, β22, β33, β44 are quadratic coefficients; and X1=(A-x0)/∆X, X1=coded value of the variable A, X0=value of A at the centre point, ∆X=step change; X2= (B-X0) ∆X and so on where A, B etc., are the input variables.
The models suggested by the software (Table 3) were well fitted with the experimental data. The fitness of the mathematical models in terms of responses can be explained by the model's desirable p-values (<0.05) and lack of fit (Table 3), as well as the difference between adjusted and projected R2 values being less than 0.2 (Table 3). Several comparative measures for model selection are provided by model summary statistics. Ignoring the aliased models such as cubic and two factor interactions, the quadratic model and linear model performed best in terms of R2 statistics (Table 3). ANOVA for the proposed quadratic model related to the R1 revealed that factors A, B, and C substantially influenced the response with p-values of <0.00, 0.02, and <0.00, respectively. Furthermore, their interactions, AC and BD, were found to be significant with p-values of 0.02 and 0.03, respectively. From the response surface graphs (fig. 1) it can be concluded that higher flow rate and acetonitrile content improved peak symmetry (fig. 1a) with a value below the desired limit (R1=2).
| S no | Response | Model | Sequential p-value | Lack of Fit p-value | Adjusted R2 | Predicted R2 |
|---|---|---|---|---|---|---|
| 1 | Tailing factor | Quadratic | 0.0004 | 0.0007 | 0.9234 | 0.7744 |
| 2 | Retention time | Linear | <0.0001 | 0.0004 | 0.9895 | 0.9861 |
| 3 | Peak area | Quadratic | 0.0032 | 0.0336 | 0.9849 | 0.9578 |
| 4 | Theoretical plate count | Quadratic | 0.0063 | 0.0391 | 0.9847 | 0.9573 |
Table 3: Model Fit Summary

Fig. 1: Response surface graphs representing the influence of the interactions of factors (a) A and C and (b) B and D on the tailing factor
On the other hand, interactions between column oven temperature and injection volume (fig. 1b) were unable to predict peak symmetry beyond or close to the desired limit. ANOVA for the proposed linear model related to the Rt (R2) demonstrated that factors A and C significantly influenced the response (fig. 2) with p-values less than 0.00. In contrast to R1, there were no significant interactions detected that affected R2. As peptides are hydrophilic and higher concentrations of organic solvents reduce analyte retention on hydrophobic stationary phases such as C18, it was observed in this study that increasing the acetonitrile content in the mobile phase and flow rate significantly reduces the retention of lunasin on C18 column. Peak area (R3) was observed to be significantly (p-value <0.05) influenced by the factors A, C, and D, as well as the interaction of C and D (fig. 3). Due to the poor analyte retention, increased acetonitrile resulted in a smaller peak area. A similar trend was observed in the case of higher flow rate. The peak area has increased as the injection volume has increased, possibly due to increased analyte loading on the column with increased injection volume. The quadratic interaction of factors had no significant effect (p-value>0.05) on lunasin retention. The acetonitrile content in the mobile phase and flow rate, on the other hand, showed a negative relationship (p-value<0.05) with the theoretical plate count (R4), which could be attributed to the quick elution of the lunasin due to increase in A and C (fig. 4). The models used to evaluate interaction among coded factors and determine the influence of factors on responses were precise, with the difference between adjusted R2 and predicted R2 being less than 0.2 (Table 3), indicating that the models can be used to navigate the design space.

Fig. 2: Response surface graph representing the influence of the factors A and C on the Rt of eluted lunasin peptide

Fig. 3: Response surface graphs representing the influence of the interactions of factors (a) B and C, and (b) B and D on the peak area of the eluted lunasin peptide peak

Fig. 4: Response surface graphs representing the influence of the interactions of factors (a) A and B, (b) B and D, and (c) C and D on the theoretical plate count of the eluted lunasin peptide peak
Following examination of the response surface graphs, the desired levels of independent factors (A, B, C, D) and the desired response (R1, R2, R3, R4) values were considered for further design space optimization. As part of the numerical optimization, the values of independent variables and responses were as follows: A=50 %; B=30°; C=0.5 ml/min; D=5.0 µl; R1=minimize; R2=5.0 min; R3=maximize. Based on these inputs, the software has suggested eight experimental runs along with the predicted responses. The experiment was carried out with the following independent variables: A=50 %; B=30°; C=0.5 ml/min; D=5.0 µl, with predicted values for the responses: R1=1.7; R2=5.3 min; R3=55 083; R4=6359, indicated a high desirability value (0.92). The predicted values were confirmed by repeating the experiment (n=5) using the previously indicated independent variable values and found that the observed mean values of the responses were well within the 95 % confidence interval of the predicted values.
According to ICH Q2(R1), system suitability is an essential component of many analytical procedures. System suitability testing is used to ensure that the UPLC-PDA system's resolution and reproducibility are adequate for the analysis. Table 4 displays parameters such as T, capacity factor (K'), and N. Using the developed UPLC-PDA method, the Rt of lunasin was reduced to 4.91 min, which was nearly half of what had previously been reported[34].
| Parameter | Value |
|---|---|
| System suitability | |
| Retention time | 4.91±0.05 min |
| Tailing factor | 1.79±0.08 |
| Capacity factor (K') | 5.48±0.04 |
| R2 | 6319±108 |
| Sensitivity | |
| LOD | 0.22 µg/ml |
| LOQ | 0.50 µg/ml |
| Recovery | |
| Spike level 1 | 98.2 %±1.65 % |
| Spike level 2 | 100 %±0.78 % |
| Spike level 3 | 99.5 %±0.47 % |
| Assay | |
| Amount found | 209±1.53 mg/capsule |
| Recovery | 98.8 %±1.15 % |
Table 4: Validation
For the given UPLC-PDA parameters, the concentration range of 0.50-10 µg/ml was found to be linear, with a coefficient of linear regression (r2) value of 0.9994 (y=6047.8x-1661.5). The LOD and LOQ values were shown in Table 4. The current method was not as sensitive as the previously reported HPLC-MS[36] and UPLC-MS/ MS[35] methods, but it could be used to quantify lunasin among supplements that typically contain higher levels of lunasin with acceptable accuracy and precision.
The RSD of six repeated assays of samples at the same concentration was used to calculate intra-day precision. The precision between days was determined by analysing another set of samples on a different day. The RSD values for intra-day and inter-day precision evaluations were 1.34 % and 1.61 %, respectively.
Recovery studies using the standard addition method were performed to test the developed UPLC-PDA method's accuracy. The lunasin standard spiked percent recovery in the assay samples was calculated and reported in Table 4. The mean percent recoveries obtained indicate that the method is accurate.
The developed UPLC-PDA method was applied to the assay of a commercial formulation. The retention of lunasin in the sample was comparable to that of standard. There were no interfering peaks from any of the inactive ingredients (fig. 5).

Fig. 5: UPLC-PDA chromatograms (a) sample and (b) blank representing method specificity for quantifying lunasin peptide
The quantified amount of lunasin (mg/capsule) and the percentage recovery was shown in Table 4. These results suggest that the developed UPLC-PDA method is applicable for accurate and precise assay of lunasin in the commercial formulations. The obtained MODR demonstrated the method's robustness. The DesignExpert software evaluated and predicted the MODR demonstrating the variations of the independent factors considering the interaction of any two factors. The MODR was within the following ranges of independent factors; A=41 %-68 %; B=20°-40°; C=0.3-0.6 ml/min; D=3-7.5 µl. After experimenting with 8 random points within the MODR, the responses did not differ from the predicted and desired values. Based on these findings, the developed UPLC-PDA method with BBD methodology can be considered robust for the quantification of lunasin.
Conclusion
In conclusion, a simple, specific, accurate, precise, and robust UPLC-PDA method for quantifying lunasin peptide in pure form or in plant-based vegan supplements was developed and validated. When compared to previous methods, the proposed method had a distinct advantage in terms of run time of less than 6 min, which can save time and solvent consumption. The influence of various chromatographic separation parameters on analyte response was efficiently evaluated using response surface methodology BBD, a novel approach in lunasin peptide method development that had not previously been performed. For the first time, lunasin concentrations in commercial nutraceuticals products were quantified. Since UPLC instruments are more widely available and less expensive than LC-MS instruments, the developed and validated UPLC-PDA could find a regular application in the assay of various formulations.
Acknowledgement:
The financial assistance from the Indian Council of Medical Research, New Delhi is gratefully acknowledged.
Conflict of interest:
The authors declare that there are no conflicts of interest.
References
- Odani S, Koide T, Ono T. Amino acid sequence of a soybean (glycine max) seed polypeptide having a poly (L-aspartic acid) structure. J Biol Chem 1987;262(22):10502-5.
[Crossref] [Google Scholar] [PubMed]
- Galvez AF, De Lumen BO. A soybean cDNA encoding a chromatin-binding peptide inhibits mitosis of mammalian cells. Nat Biotechnol 1999;17(5):495-500.
[Crossref] [Google Scholar] [PubMed]
- Hellerstein M, Calloway DH. Antimitotic peptide characterized from soybean: Role in protection from cancer? Nutr Rev 1999;57(11):359.
[Crossref] [Google Scholar] [PubMed]
- Galvez AF, Chen N, Macasieb J, de Lumen BO. Chemopreventive property of a soybean peptide (lunasin) that binds to deacetylated histones and inhibits acetylation. Cancer Res 2001;61(20):7473-8.
[Google Scholar] [PubMed]
- Galvez A, Lam Y, Chen N, Macasieb J, de Lumen B. In vitro and in vivo chemopreventive properties of a soy-bean peptide (lunasin) that binds to deacetylated histones and inhibits acetylation. J Nutr 2002;132(3):588S-9S.
- Park JH, Jeong JB, De Lumen BO, Jeong HJ. The anticancer properties of lunasin peptide from aged callus induced by the soybean tissue culture. Korean J Plant Res 2007;20(6):518-23.
- Hsieh CC, Hernández‐Ledesma B, De Lumen BO. Soybean peptide lunasin suppresses in vitro and in vivo 7, 12‐dimethylbenz [a] anthracene‐induced tumorigenesis. J Food Sci 2010;75(9):H311-6.
- Hsieh CC, Hernández-Ledesma B, de Lumen BO. Cell proliferation inhibitory and apoptosis-inducing properties of anacardic acid and lunasin in human breast cancer MDA-MB-231 cells. Food Chem 2011;125(2):630-6.
- Fernández-Tomé S, Ramos S, Cordero-Herrera I, Recio I, Goya L, Hernández-Ledesma B. In vitro chemo-protective effect of bioactive peptide lunasin against oxidative stress in human HepG2 cells. Food Res Int 2014;62:793-800.
- McConnell EJ, Devapatla B, Yaddanapudi K, Davis KR. The soybean-derived peptide lunasin inhibits non-small cell lung cancer cell proliferation by suppressing phosphorylation of the retinoblastoma protein. Oncotarget 2015;6(7):4649.
[Crossref] [Google Scholar] [PubMed]
- Hsieh CC, Wang CH, Huang YS. Lunasin attenuates obesity-associated metastasis of 4T1 breast cancer cell through anti-inflammatory property. Int J Mol Sci 2016;17(12):2109.
[Crossref] [Google Scholar] [PubMed]
- Fernández-Tomé S, Sanchón J, Recio I, Hernández-Ledesma B. Transepithelial transport of lunasin and derived peptides: Inhibitory effects on the gastrointestinal cancer cells viability. J Food Compos Anal 2018;68:101-10.
- Fan X, Qin P, Hao Y, Guo H, Blecker C, Everaert N, et al. Overexpression of soybean-derived lunasin in wheat and assessment of its anti-proliferative activity in colorectal cancer HT-29 cells. Int J Mol Sci 2020;21(24):9594.
[Crossref] [Google Scholar] [PubMed]
- Fernández-Tomé S, Xu F, Han Y, Hernández-Ledesma B, Xiao H. Inhibitory effects of peptide lunasin in colorectal cancer HCT-116 cells and their tumorsphere-derived subpopulation. Int J Mol Sci 2020;21(2):537.
[Crossref] [Google Scholar] [PubMed]
- Hsieh CC, Wu CH, Peng SH, Chang CH. Seed-derived peptide lunasin suppressed breast cancer cell growth by regulating inflammatory mediators, aromatase, and estrogen receptors. Food Nutr Res 2023;67.
[Crossref] [Google Scholar] [PubMed]
- Xie M, Sfakianakis E, Tan PH. Complex interaction of adipokines in breast cancer and anti-tumour immunity: A new paradigm for cancer treatment. J Can Res Cell Ther 2021;5(2):2640-1053.
- Hao Y, Guo H, Hong Y, Fan X, Su Y, Yang X, Ren G. Lunasin peptide promotes lysosome-mitochondrial mediated apoptosis and mitotic termination in MDA-MB-231 cells. Food Sci Hum Wellness 2022;11(6):1598-606.
- Park JH, Kim SY, Lumen BO, Lee KJ, Jeong HJ. Identification and bioavailability of a chromatin-binding peptide (lunasin) from Korean soybean. J Plant Biol 2002;45:96-101.
- Jeong HJ, Park JH, Lam Y, de Lumen BO. Characterization of lunasin isolated from soybean. J Agric Food Chem 2003;51(27):7901-6.
[Crossref] [Google Scholar] [PubMed]
- Park JH, Jeong HJ, Lumen BO. In vitro digestibility of the cancer-preventive soy peptides lunasin and BBI. J Agric Food Chem 2007;55(26):10703-6.
[Crossref] [Google Scholar] [PubMed]
- Gonzalez de Mejia E, Vásconez M, de Lumen BO, Nelson R. Lunasin concentration in different soybean genotypes, commercial soy protein, and isoflavone products. J Agric Food Chem 2004;52(19):5882-7.
[Crossref] [Google Scholar] [PubMed]
- Park JH, Jeong HJ, de Lumen BO. Contents and bioactivities of lunasin, bowman− birk inhibitor, and isoflavones in soybean seed. J Agric Food Chem 2005;53(20):7686-90.
[Crossref] [Google Scholar] [PubMed]
- Silva-Sanchez C, de Mejia E. Characterization of bioactive peptides in Amaranthus hypochondriacus seed storage proteins. Abstr Pap Am Chem S 2005;229:U43–U43.
- Jeong HJ, Jeong JB, Kim DS, Park JH, Lee JB, Kweon DH, et al. The cancer preventive peptide lunasin from wheat inhibits core histone acetylation. Cancer Lett 2007;255(1):42-8.
[Crossref] [Google Scholar] [PubMed]
- Silva-Sánchez C, De La Rosa AB, León-Galván MF, de Lumen BO, de León-Rodríguez A, De Mejía EG. Bioactive peptides in amaranth (Amaranthus hypochondriacus) seed. J Agric Food Chem 2008;56(4):1233-40.
[Crossref] [Google Scholar] [PubMed]
- Jeong JB, Jeong HJ, Park JH, Lee SH, Lee JR, Lee HK, et al. Cancer-preventive peptide lunasin from Solanum nigrum L. inhibits acetylation of core histones H3 and H4 and phosphorylation of Retinoblastoma protein (Rb). J Agric Food Chem 2007;55(26):10707-13.
[Crossref] [Google Scholar] [PubMed]
- Jeong HJ, Lee JR, Jeong JB, Park JH, Cheong YK, de Lumen BO. The cancer preventive seed peptide lunasin from rye is bioavailable and bioactive. Nutr Cancer 2009;61(5):680-6.
[Crossref] [Google Scholar] [PubMed]
- Park JH, Jeong JB, Lee JR, Lumen BO, Jeong HJ. Effect of lunasin extracted from millet (Panicum miliaceum) on the activity of histone acetyltransferases, yGCN5 and p/CAF. Korean J Plant Res 2009;22(3):203-8.
- Jeong HJ, Jeong JB, Hsieh CC, Hernández-Ledesma B, de Lumen BO. Lunasin is prevalent in barley and is bioavailable and bioactive in in vivo and in vitro studies. Nutr Cancer 2010;62(8):1113-9.
[Crossref] [Google Scholar] [PubMed]
- Cavazos A, Morales E, Dia VP, De Mejia EG. Analysis of lunasin in commercial and pilot plant produced soybean products and an improved method of lunasin purification. J Food Sci 2012;77(5):C539-45.
[Crossref] [Google Scholar] [PubMed]
- Seber LE, Barnett BW, McConnell EJ, Hume SD, Cai J, Boles K, et al. Scalable purification and characterization of the anticancer lunasin peptide from soybean. PloS one 2012;7(4):e35409.
[Crossref] [Google Scholar] [PubMed]
- Serra A, Gallart-Palau X, See-Toh RS, Hemu X, Tam JP, Sze SK. Commercial processed soy-based food product contains glycated and glycoxidated lunasin proteoforms. Sci Rep 2016;6(1):26106.
[Crossref] [Google Scholar] [PubMed]
- Alves de Souza SM, de Araújo TS, Ferretti GD, Kalume DE, Cordeiro Y, Almeida MD, et al. Novel Method for the Production, Purification, and Characterization of Recombinant Lunasin: Identification of Disulfide Cross-Linked Dimers. Int J Pept Res Ther 2022;28(6):159.
- Nakurte I, Klavins K, Kirhnere I, Namniece J, Adlere L, Matvejevs J, et al. Discovery of lunasin peptide in triticale (X Triticosecale Wittmack). J Cereal Sci 2012;56(2):510-4.
- Nakurte I, Kirhnere I, Namniece J, Saleniece K, Krigere L, Mekss P, et al. Detection of the lunasin peptide in oats (Avena sativa L). J Cereal Sci 2013;57(3):319-24.
- Guijarro-Díez M, García MC, Crego AL, Marina ML. Off-line two dimensional isoelectrofocusing-liquid chromatography/mass spectrometry (time of flight) for the determination of the bioactive peptide lunasin. J Chromatogr A 2014;1371:117-24.
[Crossref] [Google Scholar] [PubMed]
- Legzdina L, Nakurte I, Kirhnere I, Namniece J, Krigere L, Saleniece K, et al. Up to 92% increase of cancer-preventing lunasin in organic spring barley. Agron Sustain Dev 2014;34:783-91.
- Ren G, Zhu Y, Shi Z, Li J. Detection of lunasin in quinoa (chenopodium quinoa willd) and the in vitro evaluation of its antioxidant and anti‐inflammatory activities. J Sci Food Agric 2017;97(12):4110-6.
[Crossref] [Google Scholar] [PubMed]
- Lozano-Sánchez J, Borrás-Linares I, Sass-Kiss A, Segura-Carretero A. Chromatographic technique: High-performance liquid chromatography (HPLC). Mod Tech Food Authentic 2018;459-526.
- Muñoz-Olivas R. Screening analysis: An overview of methods applied to environmental, clinical and food analyses. Trends Analyt Chem 2004;23(3):203-16.
- Kumar A, Saini G, Nair A, Sharma R. UPLC: A preeminent technique in pharmaceutical analysis. Acta Pol Pharm 2012;69(3):371-80.
[Google Scholar] [PubMed]
- Nieto-Veloza A, Zhong Q, Kim WS, D'Souza D, Krishnan HB, Dia VP. Utilization of tofu processing wastewater as a source of the bioactive peptide lunasin. Food Chemi 2021;362:130220.
[Crossref] [Google Scholar] [PubMed]
- Howard JW, Kay RG, Pleasance S, Creaser CS. UHPLC for the separation of proteins and peptides. Bioanalysis 2012;4(24):2971-88.
[Crossref] [Google Scholar] [PubMed]
- Sahu PK, Ramisetti NR, Cecchi T, Swain S, Patro CS, Panda J. An overview of experimental designs in HPLC method development and validation. J Pharm Biomed Anal 2018;147:590-611.
[Crossref] [Google Scholar] [PubMed]
- Ferreira SC, Bruns RE, Ferreira HS, Matos GD, David JM, Brandão GC, et al. Box-Behnken design: An alternative for the optimization of analytical methods. Anal Chim Acta 2007;597(2):179-86.
- International conference on harmonization of technical requirements for registration of pharmaceuticals for human use. J Pharmacol Pharmacother 2015;6(3):185-7.