- *Corresponding Author:
- H. M. El-Nahas
Department of Pharmaceutics, Faculty of Pharmacy, Zagazig University, Zagazig-23514
E-mail hananelnahas@yahoo.com
| Date of Submission | 10 October 2010 |
| Date of Revision | 5 July 2011 |
| Date of Acceptance | 12 July 2011 |
| Indian J Pharm Sci 2011, 73 (4): 397-403 |
Abstract
The aim of present study involves preparation and characterization of floating microspheres using trimetazidin dihydrochloride as a model drug to increase the residence time in the stomach without contact with the mucosa, Floating microspheres were prepared by the capillary extrusion technique using chitosan as polymer and sodium lauryl sulphate as cross linking agent. The surface morphology of the prepared microspheres was characterized by the optical microscopic method. The effect of the stirring rate during preparation, polymer concentration and cross linking concentration on the percent yield, in vitro floating behavior, physical state of the incorporated drug, drug loading and in vitro drug release were studied. The prepared microspheres exhibited prolonged drug release (12 h) and remained buoyant for more than 11 h. The microspheres were found to be regular in shape and highly porous. The trimetazidin dihydrochloride release rate was higher in the case of microspheres prepared at a higher agitation speed and decreased with increasing the polymer and cross linking agent concentration. All formulations demonstrated favorable in vitro floating characteristics. The drug entrapment increased from 65.13 to 85.3% with increasing polymer to drug ratio. Diffusion was found to be the main release mechanism. Thus, the prepared floating microspheres may prove to be potential candidates for multiple-unit delivery devices adaptable to any intragastric conditions.
Keywords
Chitosan, capillary extrusion method, floating microspheres, trimetazidin dihydrochloride
Drugs that are easily absorbed from the gastrointestinal tract (GIT) and eliminated quickly from the blood circulation, require frequent dosing. To avoid this problem, the oral controlled release (CR) formulations have been developed in an attempt to release the drug slowly into the GIT and maintain a constant drug concentration in the serum for longer period of time. Therefore, prolonged gastric retention time GRT is important in achieving controlled release because this helps to retain the CR system in the stomach for a longer time in a predictable manner [1].
Chitosan is a biocompatible and biodegradable polysaccharide, which is soluble in aqueous media of low pH and shows extremely low toxicity. It forms gel beads with multivalent counter-ions such as tripolyphosphate (TPP) via ionotropic gelation, it gives microspheres by cross-linking with chemicals (e.g. glutaraldehyde, formaldehyde, and sulfuric acid).
It has been reported that irrespective of the molecular weight, spherical chitosan microspheres are formed if the concentration of the chitosan solution is at least 1% w/v [2−4].
Many process parameters affecting characteristics of chitosan microspheres have been identified, and the significance of the effect has been established. The object of the present experiment was to develop floating microspheres of chitosan by the addition of sodium lauryl sulphate (SLS) as across linking agent, which combines sustained release and prolonged gastric retention time of the hydrophilic model drug; trimetazidin dihydrochloride (TMZ), an effective drug in the treatment of angina pectoris and in ischemia neurosensorial tissues as in Meniere’s disease [5]. Developing oral controlled release formula for highly water-soluble drugs with constant release rate has always been a challenge to the pharmaceutical technologist. Most of these highly water-soluble drugs, if not formulated for controlled delivery of drugs properly, may readily release the drug at a faster rate and are likely to produce the toxic concentrations, for this TMZ was used as a model drug because of its high solubility and short biological half life of 1.6 h.
Materials and Methods
Chitosan MW 454,200, deacetylation degree: 90% was obtained from Sigma–Aldrich (UK). TMZ and SLS were purchased from Sigma Chemical Co. (St. Louis, USA). All other materials used in the dissolution studies were of analytical reagent grade.
Preparation of microspheres
Chitosan microspheres containing TMZ were prepared by a capillary extrusion procedure [3,6] Briefly, TMZ (200 mg) was dispersed in 20 ml 1% v/v acetic acid solution containing different concentration of chitosan and stirred continuously until a uniform dispersion was obtained. The microspheres were formed by dropping the bubblefree dispersion through a disposable syringe (with a nozzle of 0.5 mm inner diameter) into 20 ml of a gently agitated solution of the crosslinking agent (SLS). The dropping rate was 30 beads/ min. The falling distance was 5 cm. The gelled microspheres were separated, unless otherwise noted, after a reaction time of 2 h, washed with deionized water and then air dried for 48 h. All batches were prepared in triplicate. The effect of formulation variables such as chitosan and cross-linking agent concentrations and stirring rate varied in batches F1 to F7 as shown in (Table 1).
| Formulation | Factor combinations | ||
|---|---|---|---|
| code | Chitosan conc. (mg) | SLS | Stirring |
| (polymer:drug) | conc. (%) | rate r.p.m. | |
| F1 | 200 (1:1) | 2 | 200 |
| F2 | 400 (2:1) | 2 | 200 |
| F3 | 600 (3:1) | 2 | 200 |
| F4 | 400 (2:1) | 2 | 400 |
| F5 | 400 (2:1) | 2 | 600 |
| F6 | 400 (2:1) | 1 | 600 |
| F7 | 400 (2:1) | 3 | 600 |
Table 1: Various formulation parameters used In the preparation of microspheres
Fourier transform infrared (FTIR) spectral studies
Individual microparticles were crushed with pestle in a mortar. The crushed material was mixed with potassium bromide at 1:100 ratios and compressed to a 2 mm semitransparent disk under for 2 min. The FTIR spectra over the wavelength range of 4000– 400 cm−1 were recorded using an FTIR spectrometer (Perkin Elmer Spectrum One, Germany (Model 16 PC)
Differential scanning calorimetric study
Differential scanning calorimetry (DSC) is an important technique for the determination of possible interactions between the polymer and the encapsulated drug. A Shimadzu DSC 50 differential scanning calorimeter was used in the analysis. The scans were performed under nitrogen atmosphere (50 cm3 min−1 flow) with heating cycles of 0–400°. Samples (4–5 mg) were continuously heated at the rate of 10°/min under a constant flow of nitrogen gas.
Characterization of microspheres
The percentage yield values were calculated from the following equation: % yield=(A/B)×100…(1), Where: A=amount of filtered and dried microsphere and B=amount of total solid material in the dispersed phase.
The TMZ content in the microspheres was determined by pulverizing the TMZ-loaded microspheres (20 mg) in a glass mortar-pestle followed by immersing the powdered microspheres in 10 ml simulated gastric fluid (SGF, 0.1N HCl pH 1.2, without enzymes) with agitation at room temperature for 24 h. After filtration through a 0.45 μm membrane filter (Millipore), the drug concentration was determined spectrophotometrically at the wavelength of 231 nm (i.e Practical drug loading). The filtered solution from the empty microspheres (without TMZ) was taken as blank. All samples were analyzed in triplicate and the drug content (DC) and encapsulation efficiency (EE) was calculated according to the following equations:
DC (%)=WD/WT×100…(2), where, DC: Drug content; WD: The weight of the drug loaded in the microspheres, WT: The total weight of the microspheres.
EE (%)= [WA/WT]×100...(3), where, EE: Encapsulation efficiency WA: Actual drug content, WT: Theoretical drug content calculated assuming that the entire drug present in the chitosan solution used gets entrapped in microspheres and no loss occurs at any stage of preparation of microspheres.
In vitro Buoyancy test
The buoyancy of the microspheres was studied by using a water bath shaker with a shaking speed of 100 rpm at 37±0.5°, The fixed quantity (50 microspheres) was placed in 100 ml of enzyme-free SGF (HCl/NaCl solution containing 0.02% Tween 80; pH 1.2). Both the number of microspheres (F) (observed visually) and the floating duration (FT) (which is the time during which the microspheres remain buoyant on the test solution) were then determined at fixed time intervals during a 24 h period. All the data were the average of at least three determinations. The floating percent (F%) was calculated according to the following equation: F (%)=F/T×100…(4), Where F=Number of floating microspheres , T=Total number of microspheres.
Equilibrium swelling studies
A known weight (100 mg) of the prepared blank chitosan microspheres without drug was placed in 500 ml of different solutions; distilled water and enzyme-free SGF (HCl/NaCl solution; pH 1.2) and allowed to swell for the required period of time at 37±0.5° using the USP dissolution apparatus with the dissolution basket assembly (Model DT-06, Erweka, Germany) at 50 rpm. The microspheres were periodically removed, blotted with filter paper and their change in weight were measured during the swelling until equilibrium was attained. Finally, the weight of the swollen microspheres was recorded after a time period of 4 h and the swelling ratio (SR) was calculated from the formula: SR = (WE - WO)/WO ... (5), where WO is the initial weight of the dry microspheres and WE is the weight of the swollen microspheres at equilibrium swelling in the media. Each experiment was repeated three times and the average value±S.D. was taken as the SR value.
In vitro release studies
The release of TMZ from chitosan microspheres (equivalent to 50 mg of drug) was investigated using the USP dissolution paddle assembly (Model DT-06, Erweka, Germany) with an agitation speed of 50 rpm in 250 ml of enzyme-free SGF (HCl/NaCl solution containing 0.02% Tween 80, pH 1.2) at 37±0.5°. At appropriate time intervals, 5 ml samples were withdrawn and assayed spectrophotometrically at 231 nm. The UV-absorption of the microspheres without drug in dissolution test conditions was also measured. All dissolution runs were performed in triplicate. The data obtained for In vitro release was fitted into equations for the zero-order, first-order and Higuchi-release models. The interpretation of the data was based on the value of the resulting regression coefficients.
Results and Discussion
Chitosan, the cationic polyelectrolyte, forms gel with multivalent counter ions (e.g. SLS) through the formation of intermolecular or intramolecular linkages by ionic interaction [3,6]. In this study, the droplets of chitosan solutions instantaneously formed gelled spheres by ionotropic gelation of the polysaccharide with the oppositely charged ions SLS. SLS/chitosan water insoluble complexes are, thus, formed by the electrostatic combination of the amino group on the chitosan molecule and the sulfate group on the anion.
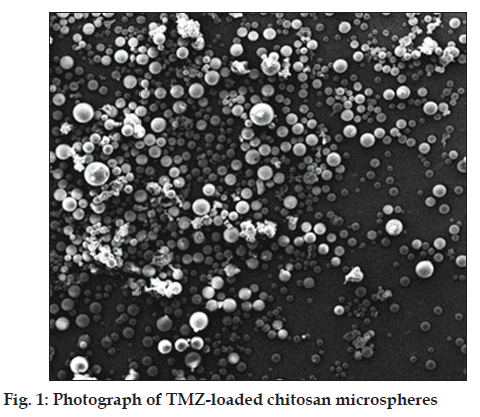
Fig. 1 represents the graphs of TMZ-loaded SLS/ chitosan microparticles. The micrographs show regular shaped microparticles having an apparently homogenous and smooth surface with few wrinkles and inward dents due to the collapse of the microcapsule wall during the in situ drying process.
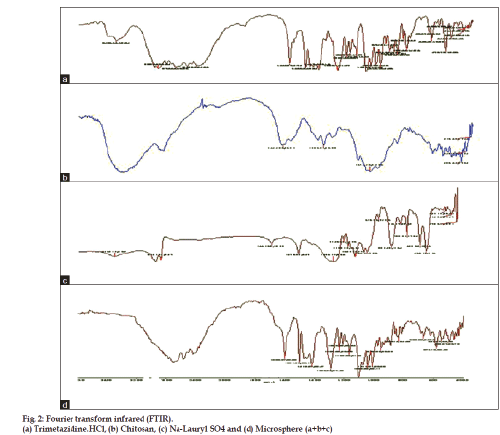
In general, the FTIR spectrum of blank chitosan-SLS particles showed a broad band around 3500-3100 cm−1, indicating enhanced hydrogen bonding compared to that of chitosan or sodium lauryl sulphate alone. On the other hand, as shown in fig. 2, the N-H bending vibration of 2-aminoglucose primary amines of chitosan (1650 cm−1) and –S-O stretching at 1407 cm−1 of sodium lauryl sulphate disappeared, indicating that the (-NH3+) of chitosan reacted with the (SO4−) of SLS. Absence of these bonds in the FTIR spectra of chitosan/SLS microparticles indicated the formation of an electrostatic bond between them (fig. 2).
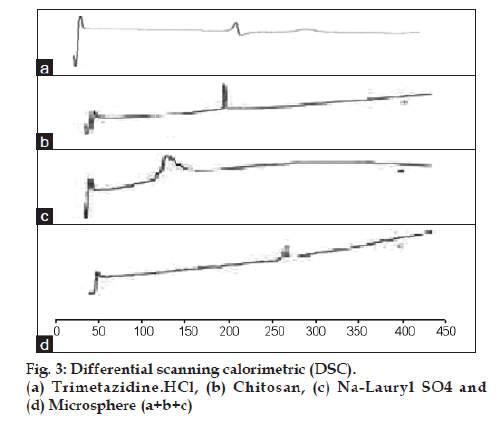
The DSC studies were also performed to investigate the chitosan-SLS electrostatic interaction. Fig. 3 shows the DSC thermogram for TMZ alone, chitosan, SLS and TMZ microsphere. The analysis of the DSC thermogram for cross linked chitosan-SLS showed disappearance of characteristic exothermic peak of chitosan at 230°, and disappearance of characteristic exothermic peak of SLS at 197°, and appearance of new exothermic peaks at 250°, this peak may be related to the breakdown of electrostatic bond of interactions between chitosan and SLS. Where the peak of drug has slightly disappeared.
Buoyancy tests were performed in pH. 1.2 buffers with 0.02% w/v of Tween 80 in order to simulate the surface tension of human gastric juice (35–50 mN/m2) [7,8]. The results showed a tendency that the higher the SLS concentration, the poor the elaborate on F (floating %) properties of microcapsules (Table 2). In contrast, the F capacity was not influenced by the stirring rate and chitosan added as nearly all of the hollow microcapsules remained buoyant after the buoyancy test period (18 h). The absence of the floatation lag time indicates that the original density of the microcapsules prior to matrix swelling in simulated biofluids was less than 1. In fact, the F process depends on the balance between the weight and the volume variations of the dosage forms. The volume increase causes the resultantweight increase and then the dosage form floatation [8].
| Formulation code | Yield (%) | DC (%) | EE (%) | F (%) | Duration of buoyancy | SR (%) h | |
|---|---|---|---|---|---|---|---|
| H2O | pH 1.2 | ||||||
| h | |||||||
| F1 | 68.1 ± 0.1 | 13.6 ± 0.21 | 65.13 ± 1.45 | 65.3 ± 0.32 | >11 | 0.12 ± 0.22 | 2 ± 0.21 |
| F2 | 77.1 ± 0.13 | 8.02 ± 0.43 | 71.6 ± 1.12 | 95 ± 0.43 | >18 | 0.7 ± 0.45 | 6.1 ± 0.44 |
| F3 | 80.3 ± 0.21 | 14.1 ± 0.1 | 85.3 ± 0.44 | 95.7 ± 0.91 | >18 | 1.13 ± 0.23 | 20 ± 0.56 |
| F4 | 84.3 ± 0.31 | 15.16 ± 0.52 | 93.1 ± 0.61 | 96 ± 0.58 | >18 | 0.23 ± 0.41 | 0.81 ± 0.81 |
| F5 | 85.1 ± 0.50 | 16.3 ± 0.26 | 95 ± 0.89 | 96 ± 0.88 | >18 | 1.1 ± 0.33 | 8 ± 0.51 |
| F6 | 83.2 ± 0.26 | 10.2 ± 0.61 | 83.72 ± 0.17 | 89.3 ± 0.62 | >17 | 0.6 ± 0.9 | 12 ± 0.23 |
| F7 | 84.7 ± 0.29 | 13.12 ± 0.19 | 78.23 ± 0.89 | 81.2 ± 0.74 | >14 | 0.2 ± 0.12 | 1.4 ± 18 |
Table 2: Percentage yield values; drug content; encapsulation efficiency; floating % and Swelling ratio of different formulations (mean±sd; n=3)
Microparticle swelling is influenced by the environmental pH, being generally greater at lower pH rather than water. The SR (equilibrium water uptake) of the cross-linked microspheres presented in (Table 2) indicate that, as the amount of SLS in the matrices increased from 1 to 3%, the equilibrium water uptake decreased significantly from 12% to 1.4%. Such a reduction in water uptake capacity is due to increase in the amount of SLS will increase the polymer density, resulting in reduction of the macromolecular chain mobility, and the formation of more stable and rigid spheres that show a lower tendency to swell. Hence, the crosslinking of microspheres has a great influence on the equilibrium water uptake as well as the release rates. Notice that formulations containing higher amounts of chitosan showed higher swelling rates than formulations containing lesser amount of chitosan. Thus, formulation F3 (3% w/w, chitosan) exhibited a higher swelling 20% than formulation F1 which showed only 2% (1%, w/w, chitosan); similarly, formulation F2 (2%, w/w, chitosan) exhibited a greater swelling than formulation F1, Under these conditions, chitosan is present in excess and there will be an excess of NH2 groups in the network. The protonation of any excess of the amino groups of the polysaccharide in stomach pH conditions accounts for this effect favoring the hydration and unfolding of the cross-linked polymeric structure and, therefore, its swelling [6].
The effects of various processes and formulation parameters on the drug entrapment efficiency of microspheres are shown in Table 2. The highest (85%) entrapment efficiency was achieved by increasing polymer-drug ratio from 1:1 to 3:1. (i.e increasing the chitosan concentration from 200 to 600 mg).The same result was also reported for indomethacin chitosan microspheres prepared by Orienti et al. [9]. They explained this effect by the increased viscosity of the microspheres preparative mixture which hinders drug migration towards the external preparative phase during microsphere preparation. The entrapment efficiency was also influenced by changing the stirring speed of the process. The highest entrapment efficiency was observed with the stirring speed of 400 rpm (95%). The change of stirring speed from 400 rpm to 200 and 600 rpm significantly decrease the entrapment efficiency due to the formation of larger and smaller emulsion droplets, respectively, ensuring drug diffusion out of the microspheres before they harden. The efficiency of drug incorporation was also influenced by the concentration of counter ions used; an increase in SLS concentration from 1 to 3% led to a marked decrease in drug loading efficiency from 95 to 78.23% [6,10].
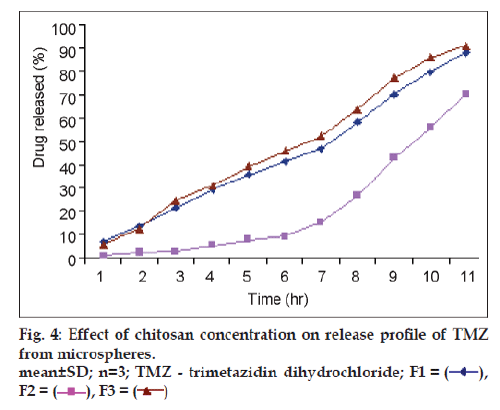
In vitro TMZ release studies were performed in 0.1N HCl for 12 h. The cumulative release of TMZ significantly decreased with increase in chitosan concentration (P<0.05) (fig. 4). The increased density of the polymer matrix at higher concentrations resulted in an increased diffusion path length. This may decrease the overall drug release from the polymer matrix. Furthermore, smaller microspheres were formed at a lower polymer concentration having a larger surface area exposed to the dissolution medium, giving rise to faster drug release. The % cumulative release was markedly prolonged from F1 to F3 when chitosan concentration was increased. In addition, only 70% of the drug loaded was released from formulation F3 in 12 h and the drug was not completely released from these microspheres during the test period (12 h). The chitosan matrices, thus, demonstrated to serve as barriers to the liberation of MTZ [11].
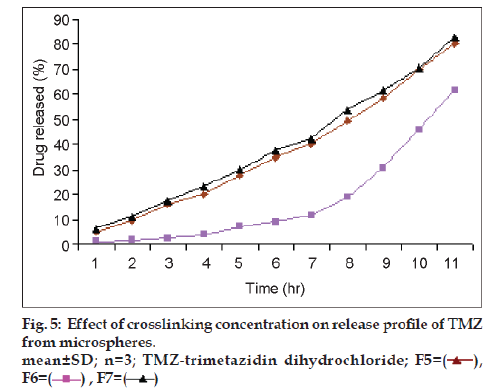
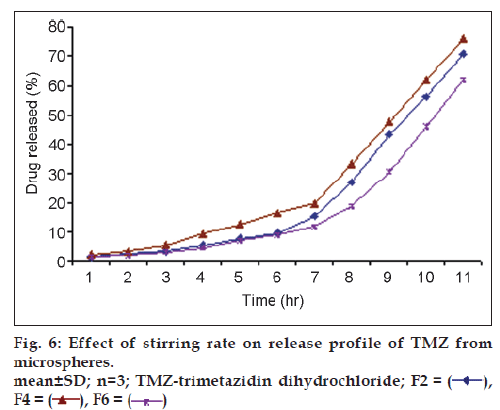
Results of % cumulative release versus time for drug loaded microspheres for formulations F5, F6 and F7 were compared in fig. 5 to investigate the extent of crosslinking on the In vitro release profiles. F6 showed a higher release rate than F5 and F7. This is attributed to an increase in the extent of cross-linking, leading to the formation of a denser network structure. The same result were observed by Kotadiya et al. and Ajit et al. [12,13]. TMZ release was higher in the case of microspheres prepared at a higher agitation speed but the difference in drug release was not statistically significant (fig. 6). The In vitro drug release showed the highest regression coefficient values for the Higuchi’s model, indicating diffusion to be the predominant mechanism of drug release (r2=0.98).
References
- Soppimath KS, Kulkarni AR, Aminabhavi TM. Development of hollow microspheres as floating controlled-release systems for cardiovascular drugs: Preparation and release characteristics. Drug Develop Ind Pharm 2001;27:507-15.
- Kawashima Y, Handa T, Kasai A, Takenaka H, Lin SY. Novel method for the preparation of controlled-release theophylline granules coated with a polyelectrolyte complex of sodium polyphosphate-chitosan. J Pharm Sci 1985;74:264-8.
- Shiraishi S, Imai T, Otagiri M. Controlled release of indomethacin by chitosan-polyelectrolyte complex: Optimization and in vivo/In vitro evaluation. J Control Release 1993;25:217-25.
- Shu XZ, Zhu KJ. A novel approach to prepare tripolyphosphate/chitosan complex beads for controlled release drug delivery. Int J Pharm 2000;201:51-8.
- Reynolds JE. Martindale?The Extra Pharmacopoeia. London: Pharmaceutical Press; 1990.
- El-Gibaly I. Development and In vitro evaluation of novel floating chitosan microcapsules for oral use: Comparison with non-floating chitosan microspheres. Int J Pharm 2002;249:7-21.
- Stithit S, Chen W, Price JC. Development and characterization of buoyant theophylline microspheres with near zero order release kinetics. J Microencapsul 1998;15:725-37.
- Timmermans J, Moës AJ. Measuring the resultant-weight of an immersed test material: II. examples of kinetic determinations applied to monolithic dosage forms. Acta Pharm Technol 1990;36:176-80.
- Orienti K, Aiedeh E, Gianasi V, Bertasi, Zecchi Y. Indomethacin-loaded chitosan microspheres, correlation between the erosion process and release kinetics. J Microencapsul 1996;13:463-72.
- Das MK, Rama Rao K. Microencapsulation of zidovudine by double emulsion solvent diffusion technique using ethylcellulose. Indian J Pharm Sci 2007;69:244-50.
- Srivatava AK, Ridhurkar DN, Saurabh W. Floating microspheres of cimetidine: Formulation, characterization and In vitro evaluation. Acta Pharm 2005;55:277-85
- Kotadiya R, Patel V, Patel H, Koradiya H. Effect of cross-linking on physicochemical properties of chitosan mucoadhesive microspheres: A factorial approach. Int J Green Pharm 2009;3:58-62.
- Rokhadea AP, Shelkea NB, Patil SA, Aminabhavi TM. Novel interpenetrating polymer network microspheres of chitosan and methylcellulose for controlled release of theophylline. Carbohydr Polym 2007;69:678-87.
