- *Corresponding Author:
- G. Mustafa
Department of Bioinformatics and Biotechnology, Government College University, Faisalabad-38000, Pakistan
E-mail: gmustafa_uaf@yahoo.com
| Date of Submission | 24 November 2016 |
| Date of Revision | 03 February 2017 |
| Date of Acceptance | 10 July 2017 |
| Indian J Pharm Sci 2017;79(5): 707-714 |
This is an open access article distributed under the terms of the Creative Commons Attribution-NonCommercial-ShareAlike 3.0 License, which allows others to remix, tweak, and build upon the work non-commercially, as long as the author is credited and the new creations are licensed under the identical terms
Abstract
Chromomycin A3 and mithramycin are tricyclic antitumor compounds of aureolic acid class of polyketides, which are structurally related. Both polyketides differ in their glycosylation profiles and substitutions of sugars in their functional groups. Genetic organizations for the biosynthetic gene clusters of both polyketides were studied through antibiotics and secondary metabolite analysis shell and compared the genes involved in their polyketide and post-polyketide biosynthesis steps. Mauve application was also used for further visualization. 3D models of KSα gene for both polyketides along with two structurally similar polyketides of two different classes were also predicted and analyzed. Superimpositions of each model with template showed very low root-mean-square deviation values of 0.399 Å for chromomycin and chlortetracycline, 0.191 Å for mithramycin and polyketomycin, and 0.395 Å for chromomycin and mithramycin, respectively. Very low root-mean-square deviation values proved that there are high similarities between each query and template. It was also found that mithramycin and polyketomycin (tetracyclic quinone) have better superimposition hence more structural similarities as compared to mithramycin and chromomycin A3 and these discrepancies strongly suggest the horizontal transfer of aromatic polyketide biosynthesis genes of aureolic acid class. The current study will surely help in better classification of different classes of bacterial type II polyketides in future using KSα domains.
Keywords
Aureolic acid, biosynthetic gene cluster, chromomycin A3, homology modelling, mithramycin, polyketides
Aureolic acids are a group of polyketides, defined as linearly-fused and tricyclic aromatic polyketides. It has been revealed that the biosynthesis of compounds of aureolic acid family go through an intermediate of tetracycline and naphthacene[1]. Chromomycin A3 and mithramycin are type II polyketides belonging to the class of aureolic acids with antitumor activities. These polyketides have properties of inhibiting growth and multiplication of many tumor cell lines[2]. Chromomycin A3 and mithramycin have been shown to have a stimulatory effect on K562 cell erythroid differentiation[3] and have also been found as neurological therapeutics[4] and in treatment of HIV-1[5].
Chromomycin A3 is the major constituent of a fermentation mixture synthesized by Streptomyces griseus while mithramycin is produced by different Streptomyces strains[2]. A same aglycon pattern is found in chromomycin A3 and mithramycin but the former differs in its glycosylation pattern. Mithramycin is the best studied example among aureolic acids[6]. It was first proposed that mithramycin was derived from a tetracenomycin-like scaffold, based on putative lastring cyclase heterologous expression from biosynthetic pathway of mithramycin in S. glaucescens Tu49[7]. A trisaccharide of d-olivose, d-oliose and d-mycarose, and a disaccharide of d-olivose have found in mithramycin while a trisaccharide of d-olivose (sugar C), d-olivose (sugar D), and 4-O-acetyl-l-chromose B (sugar E), and a disaccharide of 4-O-acetyl-d-oliose (sugar A) and 4-O methyl-d-oliose (sugar B) were attached at positions 2 and 6 of the aglycon, respectively were found in chromomycin A3 [8]. Although, chromomycin A3 and mithramycin both fall in aureolic acid class of polyketides yet they show more homology with other classes of polyketides for the sequences of their respective KSα genes involved in their biosynthesis. The current study was therefore, planned to point out the dissimilarities between genetic organizations of biosynthetic gene clusters of two aureolic acids i.e. chromomycin A3 and mithramycin. The gene sequence of KSα was used for preliminary classification of bacterial strains on the basis of their genetic abilities to produce different aromatic polyketides[9]. 3D models of KSα genes of both aureolic acids were also predicted along with two other closely related polyketides i.e. chlortetracycline and polyketomycin.
Materials and Methods
Sequence retrieval for genetic organizations
Chromomycin A3 and mithramycin were the only members of aureolic acid class of polyketides found in DoBISCUIT (Database Of BIoSynthesis clusters CUrated and InTegrated)[10]. The sequence files for gene clusters of chromomycin A3 from S. griseus and mithramycin from S. argillaceus were downloaded in GenBank format from NCBI database with accession numbers AJ578458 and X89899, respectively.
Genetic organization study
For gene clusters analysis, the web tool antiSMASH (antibiotics and secondary metabolite analysis shell)[11] was used and the editing of genetic organizations of both aureolic acids was done manually. Mauve application v 2.3.1 was used for further visualization[12].
Sequences retrieval for 3D structure predictions
Sequences of KSα subunits of type II PKSs were collected from DoBISCUIT and NCBI for selected polyketides i.e. chlortetracycline, chromomycin A3, mithramycin and polyketomycin and these sequences are found under accession numbers (GenBank: BAB12566, CAE17527, CAA61989 and ACN64834, respectively) in NCBI. Multiple sequence alignment of selected polyketides along with their template was performed through Geneious[13].
Models building by homology modelling
To predict 3D structures of chlortetracycline, chromomycin A3, mithramycin and polyketomycin homology modelling was used, which is the most suitable method for building protein models[14]. CPH model server was used to select template[15]. Modeller v9.11 was used for template and query alignments[16] using align2d command and output file in PIR format was used for building five modeels against each query. The analyses for model evaluation and quality for all four models were done by ProSA-web Z-score[17], Qmean plot[18] and PROCHECK Ramachandran plot[19]. Root mean squared deviation (RMSD) and superimposition of each query and template structure were performed using UCSF Chimera 1.10 workbench[20].
Results and Discussion
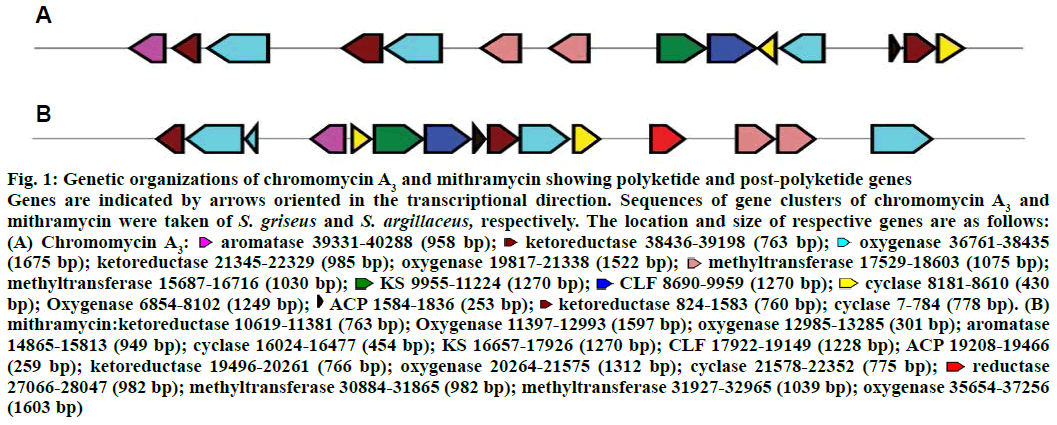
The biosynthetic gene cluster of chromomycin A3 was compared to that of mithramycin for genes involved only in polyketide biosynthesis and post-polyketide steps (Figure 1). A great difference in the genetic organizations of both polyketides was observed. Ketosynthase (KS), chain length factor (CLF) and acyl carrier protein (ACP) are involved in the biosynthesis of minimal PKS. In the gene cluster of mithramycin, all these three genes are located together in the central region of the cluster whereas KS and CLF genes are located together and ACP is located more than 8 kb distant downstream in the gene cluster of chromomycin A3. One more difference in polyketide biosynthesis of two polyketides is the location of bifunctional cyclase/aromatase gene. The gene is similar to various aromatases and involved in the biosynthesis of type II polyketides such as in mithramycin[21]. The location of aromatase in the gene cluster of chromomycin A3 is pretty unusual as it is present at one end of the cluster that is far from KS gene whereas it is located very close to KS in the gene cluster of mithramycin. Talking about post polyketide steps, three ketoreductase genes were found in the gene cluster of chromomycin A3 but two in that of mithramycin.
Figure 1: Genetic organizations of chromomycin A3 and mithramycin showing polyketide and post-polyketide genes
Genes are indicated by arrows oriented in the transcriptional direction. Sequences of gene clusters of chromomycin A3 and mithramycin were taken of S. griseus and S. argillaceus, respectively. The location and size of respective genes are as follows: (A) Chromomycin A3:  aromatase 39331-40288 (958 bp);
  ketoreductase 38436-39198 (763 bp);
  oxygenase 36761-38435 (1675 bp); ketoreductase 21345-22329 (985 bp); oxygenase 19817-21338 (1522 bp);
  methyltransferase 17529-18603 (1075 bp); methyltransferase 15687-16716 (1030 bp);
  KS 9955-11224 (1270 bp);
  CLF 8690-9959 (1270 bp);
  cyclase 8181-8610 (430 bp); Oxygenase 6854-8102 (1249 bp);
  ACP 1584-1836 (253 bp);
  ketoreductase 824-1583 (760 bp); cyclase 7-784 (778 bp). (B) mithramycin:ketoreductase 10619-11381 (763 bp); Oxygenase 11397-12993 (1597 bp); oxygenase 12985-13285 (301 bp); aromatase 14865-15813 (949 bp); cyclase 16024-16477 (454 bp); KS 16657-17926 (1270 bp); CLF 17922-19149 (1228 bp); ACP 19208-19466 (259 bp); ketoreductase 19496-20261 (766 bp); oxygenase 20264-21575 (1312 bp); cyclase 21578-22352 (775 bp);
  reductase 27066-28047 (982 bp); methyltransferase 30884-31865 (982 bp); methyltransferase 31927-32965 (1039 bp); oxygenase 35654-37256 (1603 bp)
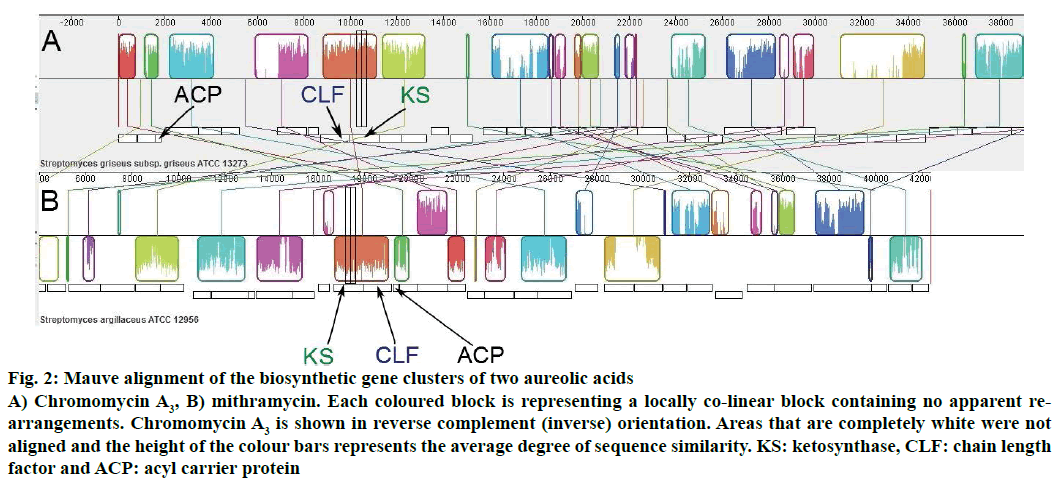
The organizations of genes involved in the biosynthesis of chromomycin A3 and mithramycin were also shown through Mauve alignment (Figure 2). Similarities and differences in both biosynthetic gene clusters could easily be visualized in Mauve alignment and it was in fully accordance with the gene cluster analysis performed through antiSMASH.
Figure 2: Mauve alignment of the biosynthetic gene clusters of two aureolic acids
A) Chromomycin A3, B) mithramycin. Each coloured block is representing a locally co-linear block containing no apparent rearrangements. Chromomycin A3 is shown in reverse complement (inverse) orientation. Areas that are completely white were not aligned and the height of the colour bars represents the average degree of sequence similarity. KS: ketosynthase, CLF: chain length factor and ACP: acyl carrier protein
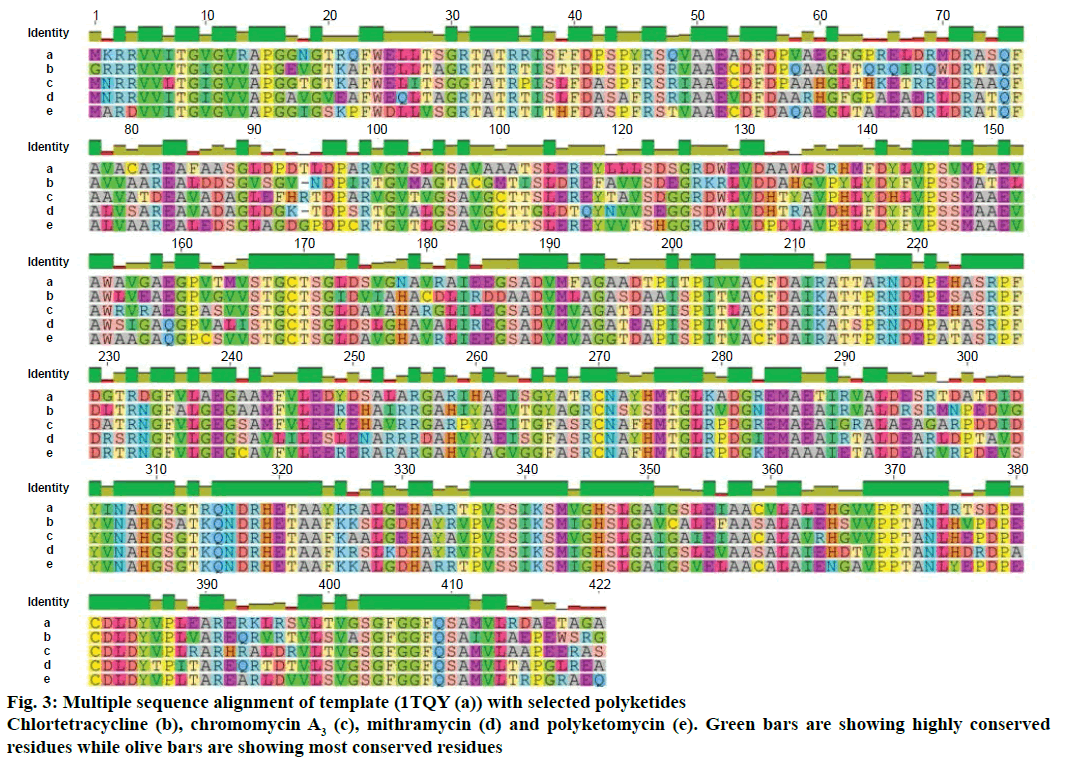
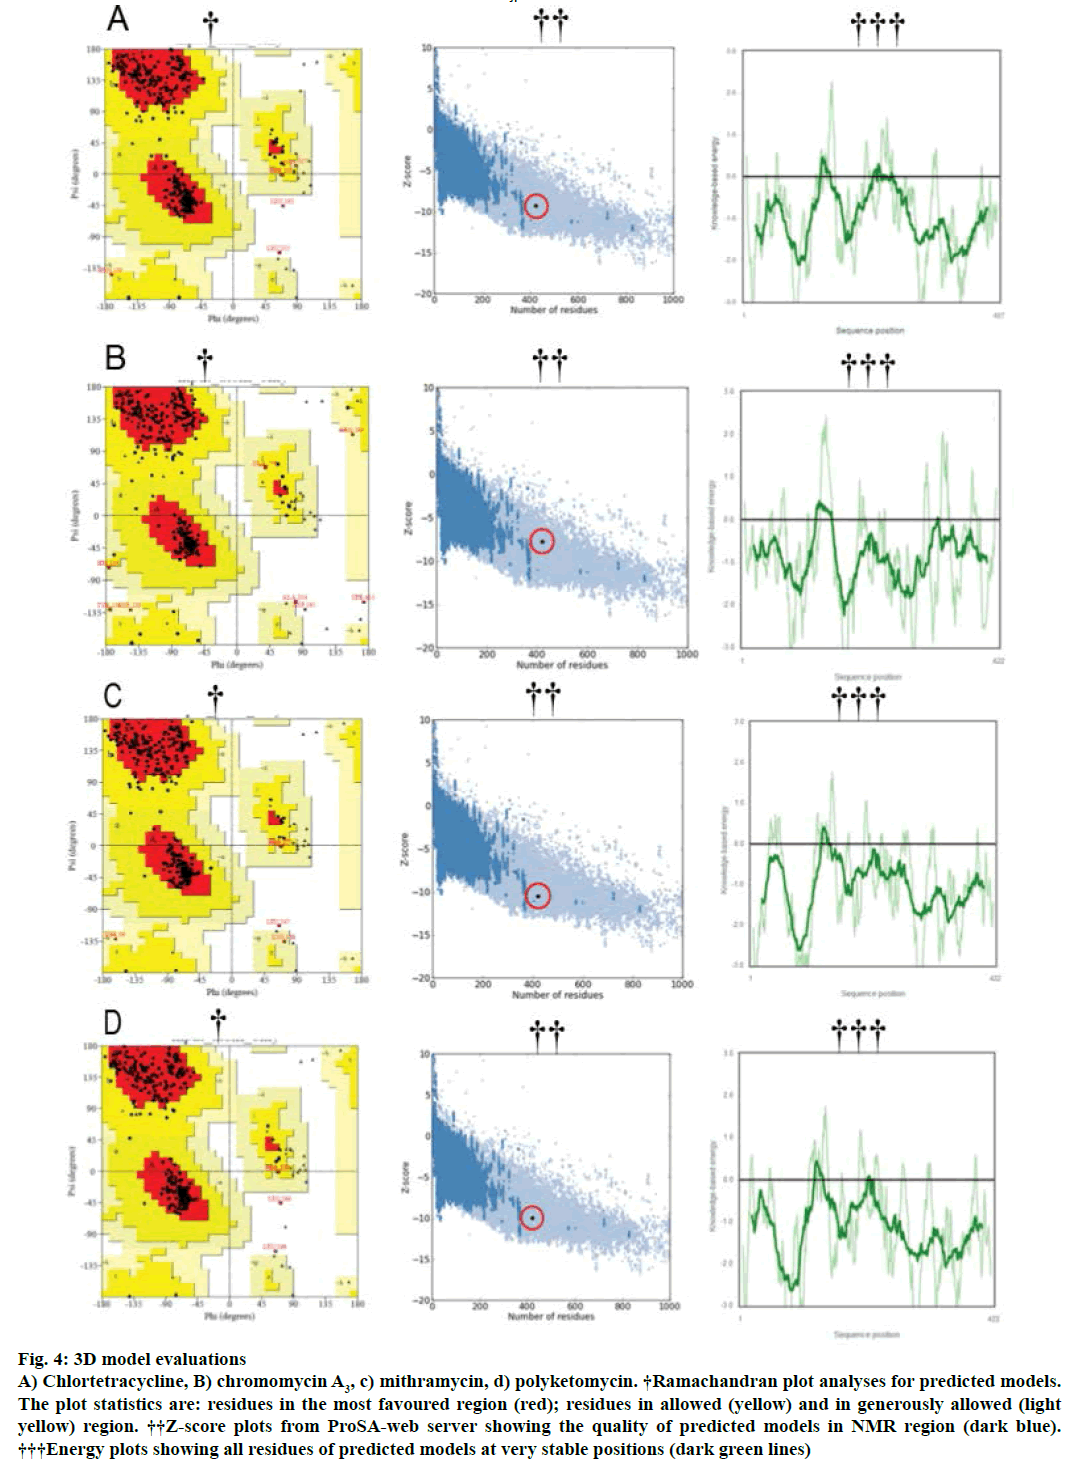
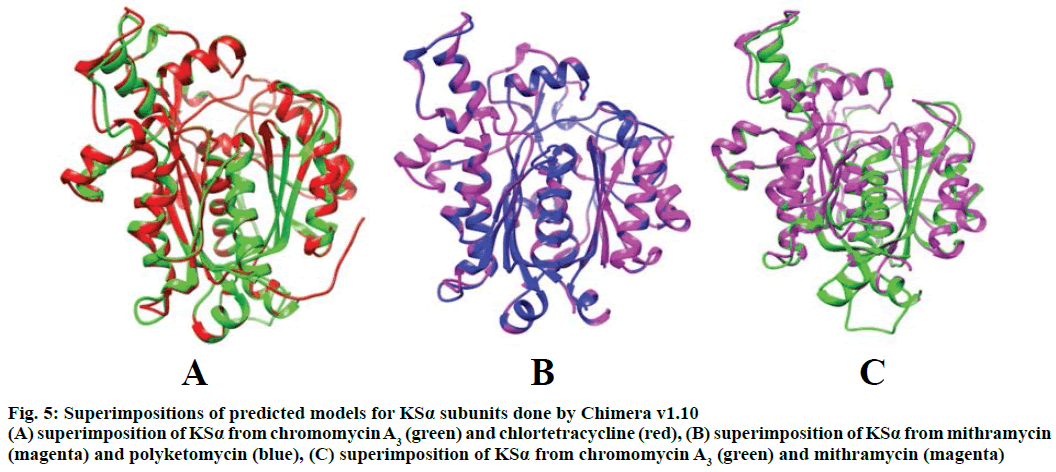
Modeller v9.11 was used for homology modelling and the template was selected (PDB:1TQY) on CPH server. Alignment of all four queries along with their template was shown in Figure 3. Five models for each query were developed using Modeller v9.11 and best model of each query was selected on the basis of their structural evaluations through ProSA-web Z-scores and PROCHECK Ramachandran plots. Z-score values of 7.75 for chromomycin, 9.3 for chlortetracycline, 10.52 for mithramycin and 9.99 for polyketomycin respectively, confirmed that both target proteins and template have similar folds. Ramachandran plots were obtained from PROCHECK server and they showed that 90.5% of residues for chlortetracycline, 86.7% for chromomycin, 91% for mithramycin and 92.6% for polyketomycin were in most favoured region (Figure 4). Superimpositions of each model with template (reference structure) using UCSF Chimera v1.10 program (Figure 5) showed very low RMSD values of 0.399 Å for chromomycin and chlortetracycline, 0.191 Å for mithramycin and polyketomycin, and 0.395 Å for chromomycin and mithramycin, respectively. Very low values of RMSD proved that there are high similarities between each query and template. The statistics of sequence alignments of template and queries were given in Table 1.
Figure 4: 3D model evaluations
A) Chlortetracycline, B) chromomycin A3, c) mithramycin, d) polyketomycin. †Ramachandran plot analyses for predicted models. The plot statistics are: residues in the most favoured region (red); residues in allowed (yellow) and in generously allowed (light yellow) region. ††Z-score plots from ProSA-web server showing the quality of predicted models in NMR region (dark blue). †††Energy plots showing all residues of predicted models at very stable positions (dark green lines)
Figure 5: Superimpositions of predicted models for KSα subunits done by Chimera v1.10
(A) superimposition of KSα from chromomycin A3 (green) and chlortetracycline (red), (B) superimposition of KSα from mithramycin (magenta) and polyketomycin (blue), (C) superimposition of KSα from chromomycin A3 (green) and mithramycin (magenta)
| Query | Template | Identical sites | Pairwise %identity | Molecular wt. (mean) (kDa) | Isoelectric point (mean) | Extinction coefficient (mean) | Standard deviation |
|---|---|---|---|---|---|---|---|
| Chlortetracycline | 1TQY | 262 | 62.1 | 44.911 | 4.89 | 35 848 | 0.5 |
| Chromomycin A3 | 289 | 68.5 | 44.676 | 5.36 | 32 290 | 0.0 | |
| Mithramycin | 271 | 64.2 | 44.590 | 4.92 | 32 228 | 0.5 | |
| Polyketomycin | 284 | 67.3 | 44.498 | 4.76 | 31 670 | 0.0 |
Table 1: Statistics of Sequence Alignments of Template and Queries
We compared the biosynthetic gene clusters of two aureolic acids to find out the dissimilarities between them. Genetic organizations of biosynthetic clusters in many cases are pretty similar for structurally related bacterial polyketides. However, this similarity was not reflected at biosynthetic genes level for chromomycin A3, a polyketide that is closely related in its chemical structure to mithramycin and a very different genetic organization was observed in both biosynthetic gene clusters. The genes involved in polyketide biosynthesis were grouped in the central part of the biosynthetic gene cluster of mithramycin while they scattered throughout the cluster in chromomycin A3. Form this observation, it was suggested that bacterial aromatic polyketide biosynthetic clusters among different Streptomyces species might have been transferred horizontally and therefore, quite similar polyketide biosynthetic gene clusters can be observed in distantly related bacterial species[22]. Evolution could be responsible if this transfer has occurred in case of chromomycin A3 and mithramycin that has probably rearranged the genes and caused differences in gene organizations of both clusters[2].
This is the first study in which 3D models of KSα genes of both aureolic acids were also prepared and superimposed with closely related polyketides of other families to study similarities between them. RMSD plays an important role to measure the similarity in 3D structures after optimal rigid body superimposition. A very large value of RMSD means the structures, which are superimposed are dissimilar and zero RMSD means structures are identical in their confirmation[23]. Because mithramycin and chromomycin A3 belong to the same group of polyketides i.e. aureolic acid, here an interesting observation was found that RMSD value of 0.191 Å for mithramycin and polyketomycin showed better superimposition hence more structural similarities as compared to mithramycin and chromomycin A3 superimposition with an RMSD value of 0.395 Å. The RMSD values for superimpositions of chromomycin A3 and chlortetracycline, and that of chromomycin A3 and mithramycin were almost identical i.e. 0.399 Å and 0.395 Å, respectively, which revealed that chromomycin A3 has nearly equal structural similarities for both polyketides. These observations were again justified by the alignment scores. Mithramycin and polyketomycin for 420 atom pairs gave better alignment score of 1757.6 whereas mithramycin and chromomycin for 360 atoms gave 851.1 alignment score. Similarly, chromomycin A3 with chlortetracycline and mithramycin gave nearly equal alignment score i.e. with chlortetracycline gave 794.8 alignment score between 374 atoms and with mithramycin 851.1 between 360 atoms. Similar results were also found by Feng et al.[24] who conducted phylogenetic studies for different classes of polyketides. They generated a phylogenetic tree for KSβ subunit of type II PKSs and found that chromomycin A3 showed more similarities towards tetracycline class of polyketides rather than for mithramycin i.e. aureolic acid. The current study has also justified the findings of Zhang et al.[25] that aureolic acids were more likely to be derived from a cyclization pathway of tetracyclinelike and in fact a number of highly homologous enzymes are shared by the biosynthetic pathways of mithramycin and oxytetracycline such as cyclases and tailoring enzymes. Later, it was identified that premithramycin B was transformed into an aureolic acid structure by oxygenase MtmOIV through fourth ring Baeyer-Villiger oxidative cleavage[26]. The enzyme homologue to cyclase MtmOIV was also identified in the biosynthetic gene cluster of chromomycin A3 [2] derived from prechromomycin B, which is a tetracylic intermediate[27].
KSs are the most conserved domains and found as essential part of each PKS gene cluster as they have been used to identify PKS genes from individual bacterial strains[28] and environmental DNA[29]. Each catalytic site is encoded on a distinct protein by type II PKSs, which also called iterative type of PKS. Two discrete KS domains are encoded by type II PKSs i.e. KSα and KSβ. The former domain performs condensation reaction while KSβ that also known as CLF defines the number of iterative condensation steps[30]. As the arrangement of genes of two pathways is totally different in the organizations of both aureolic acids but synthesis of similar intermediates is still accomplished in the most effective way therefore, it can be suggested that arrangement of genes does not influence the arrangement of protein at all[2]. The findings of this study suggested that care should be taken while classifying different bacterial polyketides on the basis of their KSα genes.
Chromomycin A3 and mithramycin are members of the aureolic acid family of antitumor antibiotics and are effective against Gram-positive bacteria as they inhibit growth and multiplication of several cancer cell lines[31]. This inhibiting activity of aureolic acids comes through interaction in an Mg2+-dependent manner with regions of GC-rich in the minor groove of DNA[32]. Zn2+ metalloenzymes including alcohol dehydrogenase (ADH) can also be inhibited by both aureolic acids through binding at zinc centers and disruption of quaternary structure of the metalloenzyme complex. This property makes these aureolic acids potential therapeutic agents against neurodegenerative disorders and metal dyshomeostasis[33].
In conclusion, for the analysis of growing volume of DNA sequence data new bioinformatics tools are needed. This is especially true in case of biosynthesis of secondary metabolites where major challenges for accurate sequence assembly and analysis are created by highly repetitive nature of associated genes. The current study has proven that biosynthetic gene clusters of an antitumor antibiotic chromomycin A3 synthesized by S. griseus has different genetic organization as compared to mithramycin that is a closely structurally related polyketide of the same class i.e. aureolic acid. Moreover, the 3D structures of KSα subunit of type II PKS of both aureolic acids have shown less degree of structural superimposition as compared to other classes of polyketides. Mithramycin has shown a better structural superimposition with polyketomycin i.e. a tetracyclic quinone rather than chromomycin A3. These incongruences are due to different rates of evolution of bacterial biosynthetic genes and more importantly to the process of horizontal gene transfer (HGT) that has been now widely recognized as a major force driving bacterial evolution. The dissimilarities are clearly indicating that HGT for both aureolic acids has gone through different directions. As the classification of bacterial polyketides plays a vital role to identify and study biosynthetic pathways of novel polyketides therefore, findings of this study will surely help in correct organization and classification of different classes of polyketides in future.
Acknowledgement
The work was supported by a grant from Higher Education Commission, Government of Pakistan.
Conflicts of interest
There are no conflicts of interest.
Financial support and sponsorship
Nil.
References
- Zhou H, Li Y, Tang Y. Cyclization of aromatic polyketides from bacteria and fungi. Nat Prod Rep 2010;27:839-68.
- Menendez N, Nur-e-Alam M, Brana AF, Rohr J, Salas JA, Mendez C. Biosynthesis of the antitumor chromomycin A3 in Streptomyces griseus: analysis of the gene cluster and rational design of novel chromomycinanalogs. ChemBiol 2004;11:21-32.
- Bianchi N, Osti F, Rutigliano C, Corradini FG, Borsetti E, Tomassetti M, et al. The DNA-binding drugs mithramycin and chromomycin are powerful inducers of erythroid differentiation of human K562 cells. Br J Haematol 1999;104:258-65.
- Chatterjee S, Zaman K, Ryu H, Conforto A, Ratan RR. Sequence-selective DNA binding drugs mithramycin A and chromomycin A3 are potent inhibitors of neuronal apoptosis induced by oxidative stress and DNA damage in cortical neurons. Ann Neurol 2001;49:345-54.
- Bianchi N, Rutigliano C, Passadore M, Tomassetti M, Pippo L, Mischiati C, et al. Targeting of the HIV-1 long terminal repeat with chromomycin potentiates the inhibitory effects of a triplex-forming oligonucleotide on Sp1-DNA interactions and in vitrotranscription. Biochem J 1997;326:919-27.
- Trefzer A, Blanco G, Remsing L, Kunzel E, Rix U, Lipata F, et al. Rationally designed glycosylated premithramycins: hybrid aromatic polyketides using genes from three different biosynthetic pathways. J Am ChemSoc 2002;124:6056-62.
- Wohlert SE, Kunzel E, Machinek R, Mendez C, Salas JA, Rohr J. The structure of mithramycin reinvestigated. J Nat Prod 1999;62:119-21.
- Garcia B, Gonzalez SJ, Menendez N, Brana AF, Nunez LE, Moris F, et al. The chromomycinCmmAacetyltransferase: a membrane-bound enzyme as a tool for increasing structural diversity of the antitumourmithramycin. MicrobBiotechnol 2011;4:226-38.
- Metsa-Ketela M, Salo V, Halo L, Hautala A, Hakala J, Mantsala P, et al. An efficient approach for screening minimal PKS genes from Streptomyces. FEMS MicrobiolLett 1999;180:1-6.
- Ichikawa N, Sasagawa M, Yamamoto M, Komaki H, Yoshida Y, Yamazaki S, et al. DoBISCUIT: a database of secondary metabolite biosynthetic gene clusters. Nucleic Acids Res 2013;41:408-14.
- Medema MH, Blin K, Cimermancic P, de Jager V, Zakrzewski P, Fischbach MA, et al. antiSMASH: rapid identification, annotation and analysis of secondary metabolite biosynthesis gene clusters in bacterial and fungal genome sequences. Nucleic Acids Res 2011;39:339-46.
- Darling AC, Mau B, Blattner FR, Perna NT. MAUVE: multiple alignment of conserved genomic sequence with arrangements. Genome Res 2004;14:1394-403.
- Kearse M, Moir R, Wilson A, Stones-Havas S, Cheung M, Sturrock S, et al. Geneious Basic: an integrated and extendable desktop software platform for the organization and analysis of sequence data. Bioinformatics 2012;28:1647-9.
- Batool M, Khalid MH, Hassan MN, Yusuf HF. Homology modeling of an antifungal metabolite plipastatin synthase from the Bacillus subtilis168. Bioinformation 2011;7:384-7.
- Nielsen M, Lundegaard C, Lund O, Petersen TN. CPHmodels-3.0--remote homology modeling using structure-guided sequence profiles. Nucleic Acids Res 2010;38:576-81.
- Fiser A, Sali A. Modeller: generation and refinement of homology-based protein structure models. Methods Enzymol 2003;374:461-91.
- Wiederstein M, Sippl MJ. ProSA-web: interactive web service for the recognition of errors in three-dimensional structures of proteins. Nucleic Acids Res 2007;35:407-10.
- Benkert P, Kunzli M, Schwede T. QMEAN server for protein model quality estimation. Nucleic Acids Res 2009;37:510-4.
- Laskowski RA, Rullmannn JA, MacArthur MW, Kaptein R, Thornton JM. AQUA and PROCHECK-NMR: programs for checking the quality of protein structures solved by NMR. J Biomol NMR 1996;8:477-86.
- Pettersen EF, Goddard TD, Huang CC, Couch GS, Greenblatt DM, Meng EC, et al. UCSF Chimera--a visualization system for exploratory research and analysis. J ComputChem 2004;25:1605-12.
- Lombo F, Blanco G, Fernandez E, Mendez C, Salas JA. Characterization of Streptomyces argillaceusgenes encoding a polyketide synthase involved in the biosynthesis of the antitumor mithramycin. Gene 1996;172:87-91.
- Metsa KM, Halo L, Munukka E, Hakala J, Mantsala P, Ylihonko K. Molecular evolution of aromatic polyketides and comparative sequence analysis of polyketideketosynthase and 16S ribosomal DNA genes from various streptomyces species. Appl Environ Microbiol 2002;68:4472-9.
- Maiorov VN, Crippen GM. Significance of root-mean-square deviation in comparing three-dimensional structures of globular proteins. J MolBiol 1994;235:625-34.
- Feng Z, Kallifidas D, Brady SF. Functional analysis of environmental DNA-derived type II polyketide synthases reveals structurally diverse secondary metabolites. ProcNatlAcadSci USA 2011;108:12629-34.
- Zhang W, Ames BD, Tsai SC, Tang Y. Engineered biosynthesis of a novel amidatedpolyketide, using the malonamyl-specific initiation module from the oxytetracyclinepolyketide synthase. Appl Environ Microbiol 2006;72:2573-80.
- Beam MP, Bosserman MA, Noinaj N, Wehenkel M, Rohr J. Crystal structure of Baeyer-VilligermonooxygenaseMtmOIV, the key enzyme of the mithramycin biosynthetic pathway. Biochemistry 2009;48:4476-87.
- Menendez N, Nur-e-Alam M, Fischer C, Brana AF, Salas JA, Rohr J, et al. Deoxysugar transfer during chromomycin A3 biosynthesis in Streptomyces griseussubsp. griseus: new derivatives with antitumor activity. Appl Environ Microbiol 2006;72:167-77.
- Edlund A, Loesgen S, Fenical W, Jensen PR. Geographic distribution of secondary metabolite genes in the marine actinomyceteSalinisporaarenicola. Appl Environ Microbiol 2011;77:5916-25.
- Wawrik B, Kutliev D, Abdivasievna UA, Kukor JJ, Zylstra GJ, Kerkhof L. Biogeography of actinomycete communities and type II polyketide synthase genes in soils collected in New Jersey and Central Asia. Appl Environ Microbiol 2007;73:2982-9.
- Ziemert N, Podell S, Penn K, Badger JH, Allen E, Jensen PR. The natural product domain seeker NaPDoS: A phylogeny based bioinformatic tool to classify secondary metabolite gene diversity. PLoS One 2012;7:e34064.
- Bosserman MA, Florez AB, Shaaban KA, Brana AF, Salas JA, Mendez C, et al. Characterization of the terminal activation step catalyzed by oxygenaseCmmOIV of the chromomycin biosynthetic pathway from Streptomyces griseus. Biochemistry 2011;50:1421-8.
- Majee S, Sen R, Guha S, Bhattacharyya D, Dasgupta D. Differential interactions of the Mg2+ complexes of chromomycin A3 and Mithramycin with poly(dG-dC).poly(dC-dG) and poly(dG).poly(dC). Biochemistry 1997;36:2291-9.
- Devi PG, Chakraborty PK, Dasgupta D. Inhibition of a Zn(II)-containing enzyme, alcohol dehydrogenase, by anticancer antibiotics, mithramycin and chromomycin A3. J BiolInorgChem 2009;14:347-59.
