- *Corresponding Author:
- T. S. Laxman
Academy of Scientific and Innovative Research (AcSIR), Anusandhan Bhawan, Rafi Marg, New Delhi-110 001, India - Y. Durgaprasad
Pharmacokinetics and Metabolism Division, CSIR-Central Drug Research Institute, Lucknow-226 031, India - S. B.Rabi
Department of Pharmaceutics, National Institute of Pharmaceutical Education and Research (NIPER), Raebareli-229-010, India
E-mail: rabi.cdri@gmail.com
| Date of Submission | 07 June 2016 |
| Date of Revision | 27 September 2016 |
| Date of Acceptance | 2 November 2016 |
| Indian J Pharm Sci 2016;78(6):732-740 |
This is an open access article distributed under the terms of the Creative Commons Attribution-NonCommercial-ShareAlike 3.0 License, which allows others to remix, tweak, and build upon the work non-commercially, as long as the author is credited and the new creations are licensed under the identical terms
Abstract
The purpose of this study was to build an in vitro-in vivo correlation model for topiramate extended release capsules. Three formulations with different release rate were developed by varying the percentage of the rate controlling polymer ethylcellulose and pore former hypromellose. In vitro dissolution of all formulations was performed by united states of phaemacopiea type I apparatus using multimedia dissolution conditions such as 0.1 N hydrochloric acid pH 1.2 for initial 2 h followed by phosphate buffer pH 6.8 for the rest of 22 h. Total dissolution time was up to 24 h. In vivo pharmacokinetic profile of the immediate release suspension and different extended release formulations were investigated in rabbit model after single oral administration of topiramate at a dose of 10.33 mg/kg in vitro-in vivo correlation model was established by using two stage numerical deconvolution approaches. Unit impulse response was obtained from pharmacokinetic profile of immediate release suspension which was used as a reference formulation. A linear correlation model with a time scaling factor was found to be useful to build level A correlation. The developed in vitro-in vivo correlation model was validated as per food drug administration guideline, and the % prediction error for maximum concentration observed (Cmax) and area under the concentration time curve was within acceptable limits of below 15%. The utility of the developed model was evaluated by testing the targeted formulations. The observed % prediction error was 2.61 and -0.43 for Cmax and area under the concentration time curve, respectively suggesting the usefulness of the present in vitro-in vivo correlation model.
Keywords
Topiramate, extended-release capsule, in vitro-in vivo correlation
Topiramate (TPM) is a second generation broad spectrum antiepileptic drug used in the treatment of a migraine, tonic clonic seizures and partial seizures [1,2]. The usual therapeutic dose of TPM was 50-400 mg divided in twice/day basis. The once a day extended release (ER) formulation was developed to reduce dose frequency, maintain steady plasma levels, minimize the concentration- related adverse effects and better accumulation ratio for effective management of antiepileptic therapy [3]. Lambrecht et al., reported smaller peak trough ratio for TPM-ER formulation than twice a day immediate release (IR) formulation suggesting that plasma peak trough variation could be reduced by using once a day ER formulation [4].
Often, the development of ER formulation with desired dissolution and plasma concentration profiles is time consuming and costly. in vitro-in vivo correlation (IVIVC) enlighten the mathematical relationship between an in vitro release of a dosage form and relevant in vivo response which will reduce the number of in vivo trials [5]. IVIVC for TPM tablets were reported earlier at the clinical level [6]. During the initial ER formulation development, IVIVC using a preclinical animal model would be beneficial in the speedy development of bioequivalent formulation at low cost. Numerous reports were available for applicability of preclinical animal species for testing IVIVC such as Beagle dogs for propranolol ER tablets [7]; rats for exenatide microspheres [8]; rabbits for glipizide tablets and flurbiprofen capsules [9,10] and cynomolgus monkey for RO-X tablets [11]. Among the preclinical animal models reported, rabbits were easy to handle, convenient for the administration of solid dosage forms and cost-effective animal model. Previous reports were also suggested the better correlation between the rabbits and humans for rank order of maximum concentration (Cmax) and area under curve (AUC) of different formulations [12]. Thus, the present work was aimed to establish rabbit as a preclinical animal model for IVIVC of TPM.
Three different ER formulations of TPM were developed and optimized as per FDA guideline in order to establish a level of correlation. Further, these ER formulations were subjected for in vitro dissolution studies. The in vivo release profile was accomplished by using preclinical pharmacokinetic studies in New Zealand (NZ) rabbits. Finally, the obtained fraction of drug dissolved was correlated to a fraction of drug absorbed by using suitable linear correlation model, which could be useful to accelerate the development of generic formulations of TPM. Once IVIVC model was developed, it was also used to check the percentage (%) variation limit allowed in the dissolution of marketed formulation.
Materials and Methods
TPM (purity≥98%), diclofenac (internal standard, IS), ethylcellulose and hypromellose were purchased from Sigma Aldrich, St Louis, MO, USA. HPLC grade methanol, n-hexane, ethyl acetate and formic acid were purchased from Merck Pvt. Ltd. (India). Ultrapure water was collected from a Milli-Q PLUS PF water purification system.
Analytical and bioanalytical method development of TPM
To estimate TPM concentration in dissolution media and plasma, a liquid chromatography-mass spectrometry (LC-MS/MS) method was developed. API 3200 mass spectrometer (Applied Biosystems, MDS Sciex, Toronto, Canada) coupled with a Waters HPLC system (Milford, USA) consisted of a quaternary pump (600), auto sampler (717) was utilized for analysis. The chromatographic separation was achieved on Waters Symmetry-Shield C18 column (5 μ, 4.6×150 mm) using methanol: 0.1% formic acid (95:5 v/v) as the mobile phase at a flow rate of 0.75 ml/min.
The LC-MS/MS system was operated with an electrospray ionization (ESI) source in negative polarity mode. The most abundant fragment ions of (m/z 338.16/77.96) and diclofenac (IS) (m/z 294.00/250.00) were chosen in the MRM acquisition for better sensitivity and selectivity. Compound-dependent parameters such as declustering potential -90 and -16 V; entrance potential -10 and -8 V; collision energy -70 and -10 eV and collision cell exit potential -10 and -20 V were set for TPM and diclofenac, respectively. All raw data were processed with PE SCIEX analyst software (Version 1.4.2) from applied biosystems.
Calibration standards were prepared by spiking 10 μl of working stocks solution into 90 μl of rabbit plasma or dissolution media to obtain a concentration range of 6.25-1600 ng/ml. The quality control (QC) samples of four different concentrations (6.25, 15, 300, 1400 ng/ml) viz., lower limit of quantification (LLOQ), low quality control (LQC), middle quality control (MQC) and high quality control (HQC), were prepared in five replicates.
Liquid-liquid extraction method was used for extraction of analytes from rabbit plasma or dissolution media. Plasma or dissolution samples (100 μl) were taken in 5 ml polypropylene tubes, then 10 μl of IS (2 μg/ ml final concentration) was spiked into the tubes and mixed on cyclomixer (Spinix Tarsons, Kolkata, India) for 15 s. After that 3 ml of extraction solvent (n-hexane and ethyl acetate, 50:50 v/v) was added. The samples were then vortexed and centrifuged for 10 min at 4000 rpm at 5° by Sigma 3-16K (Frankfurt, Germany) centrifuge. The organic layer (2.5 ml) was collected and evaporated to dryness under vacuum in SpeedVac concentrator (Savant Instrument, Farmingdale, USA). The dried residue was reconstituted with 100 μl of methanol followed by vortexing for 30 s. The samples (20 μl) were injected through an auto sampler into the LC-MS/MS system for analysis.
Development of different formulations of TPM
The development of IVIVC correlation requires two or more formulation with different release rates. Three preliminary prototypes of ER granules FS-01 (slow), FM-05 (medium) and FF-08 (fast) were developed with different concentrations of the rate controlling polymers ethylcellulose and hypromellose. The formulated ER granules were filled in capsules. The 0.5% w/v, carboxymethyl cellulose (CMC) suspension of TPM was used as reference IR treatment. The marketed Trokedni XR-200 mg ER capsules (manufactured by Catalent Pharma Solutions) were used as targeted formulation.
in vitro dissolution study
The in vitro release behavior of ER TPM capsules were studied using USP type I apparatus, i.e., the basket method rotating at 100 rpm. The TPM capsules were placed in 900 ml of dissolution media (0.1 N HCl, pH 1.2 for two hours, followed by phosphate buffer, pH 6.8) and maintained at 37°. The dissolution samples (10 ml) were collected at the predetermined time intervals up to 24 h and filtered through membrane filter (0.45 μm). The drug was extracted from the dissolution media by using earlier explained LLE method. LC-MS/MS was used to quantify the amount of drug released. At least six capsules of each formulation were accomplished to calculate the mean and standard deviation (SD) of % dissolved.
Dissolution profiles of the three ER formulations were subjected to similarity factor (f2) test. According to FDA guideline, in vitro release rates of different formulations should differ by at least 10% for IVIVC. When dissolution profiles shows 10% average difference then it gives f2 =50 [13]. We require the f2 value below 50 to discriminate in vitro release profiles [14,15]. in vitro dissolution data were analyzed using Hill, Weibull, double Weibull and Makoid-Banakar models. Different dissolution models were evaluated based on the various criteria including closeness of the fit between observed and predicted value coefficient of variation of the estimated parameters for all models akaike information criterion (AIC) and Schwarz’s Bayesian criterion (SBC) for representation of goodness of fit plot of observed fraction dissolved vs. predicted fraction dissolved for the percent prediction error (%PE) in the validation of the IVIVC model.
in vivo pharmacokinetic study
Per oral pharmacokinetic studies were performed in male NZ rabbits. The study was conducted in accordance with current legislation on animal experiments as per Institutional Animal Ethics Committee at CSIR-Central Drug Research Institute (IAEC approval no IAEC/2014/155). Previously rabbit has also been used as a preclinical animal model for TPM pharmacokinetic studies [16]. The rabbits were housed in restraining cages and kept in hygienic conditions at a temperature of 23-25°, relative humidity of 50-70% and 12-12 h light-dark cycle. Prior to the experiment, rabbits were fasted overnight (12 h) with free access to water. The rabbits were divided into the five different groups based on the administered formulations (n=3, in each group, weight range 2.5-3.2 kg): group-A, slow release formulation FS-01; group-B, medium release formulation FM-05; group-C, fast release formulation FF-08; group-D, marketed formulation and group-E, 0.5% w/v CMC suspension of TPM. Capsules filled with TPM granules were administered orally at a dose of 10.33 mg/kg body weight to rabbit followed by distilled water to swallow the capsule. For reference treatment, 0.5% w/v CMC suspension of TPM was administered to rabbits. In all cases, the same dose strength was given to the rabbit. Blood samples (0.4 ml) were collected from the marginal ear vein of each rabbit in heparinized microcentrifuge tubes at 0.25, 0.5, 0.75, 1.0, 2.0, 3.0, 4.0, 6.0, 8.0, 12.0, 24.0, 48.0, 72.0 and 96.0 h post dosing. Plasma was collected by centrifuging the blood samples at 4000 rpm for 10 min and stored at -70±10° until the analysis.
Development of IVIVC model
IVIVC was performed in various stages including the development of correlation model, validation of the model and utilization of the same for in vivo prediction of targeted formulation. The present work is based on the two-stage numerical deconvolution method. It involves the deconvolution in first stage to explore the time course of in vivo absorption. In the second stage, correlation was built between the in vitro drug release and in vivo drug absorption. In current study unit impulse response (UIR) is generated by using oral pharmacokinetic profile of TPM suspension [17]. Three preliminary formulations FF-08, FM-05, FS-01 were considered for the building of IVIVC model. Fraction of drug absorbed was estimated using the ‘deconvolution through convolution’ method (WinNonlin IVIVC ToolkitTM, Version 6.3, Pharsight, CA, USA) from the observed pharmacokinetic profile for each formulation. The IVIVC model was developed by using a fraction of the drug absorbed and that of a fraction of drug dissolved. On the basis of developed IVIVC model, predicted fraction of drug absorbed was estimated from the observed fraction of drug dissolved [18]. Levy plot was considered as a primary attempt for selection of correlation model. Two levy plots were considered during a model development, i.e., fraction of drug absorbed (Fabs) vs. fraction of drug dissolved (Fdiss) and in vivo absorption time (Tvivo) vs. in vitro dissolution time (Tvitro). In order to attemmpt level A corrrelation, the following linear correlation models were applied. Model 1∶ Fabs=AbsScale×Diss, Model 2∶ Fabs=AbsScale×Diss (Tscale×Tvivo), Model3∶ Fabs=AbsScale×Diss (Tscale×Tvivo-Tshift), Model 4∶Fabs=AbsScale× [Diss(Tscale×Tvivo- Tshift)- AbsBase.
These models take consideration of time scaling factor (Tscale), absorption scale factor (Abs Scale), time scale shift (Tshift) and absorption baseline (AbsBase). Selection of the model was based on the consideration of multiple parameters including the Akaike information criteria (AIC) and Schwarz’s Bayesian criterion (SBC), correlation coefficient (R2), the fit between observed and predicted value, %PE limit for internal validation as per FDA.
Validation and prediction of IVIVC model
The IVIVC model can be validated by using the internal and/or external predictabilities. The internal predictability involves the use of the same formulation to define the IVIVC model [15]. In this study, FM-05 and FF-08 were used as internal formulation. Additional formulation FS-01 with different release rate was prepared for external predictabilities. The %PE (Eqns. 1 and 2) of the IVIVC model was calculated with respect to maximum concentration observed (Cmax) and area under the concentration time curve (AUC). FDA regulatory guidance suggests that the %PE values for Cmax and AUC should be less than ±15% for each formulation and below ±10% for the average. The application of the established IVIVC model was evaluated by the prediction of targeted formulation. Eqns.: %prediction error (PE) for Cmax = Cmax (observed) – Cmax (predicted) / Cmax (observed) × 100 and % prediction error (PE) for AUC = AUC (observed) – AUC (predicted) / AUC (observed) × 100.
Evaluation of IVIVC for simulated dissolution profiles
The simulation of dissolution profiles was carried out for the marketed formulation to check variation window allowed for dissolution. Dissolution profiles for marketed formulation were simulated in both ways, i.e., increase or decrease of 1, 3, 5, 7, 9 and 11% fraction of dissolution from the marketed formulation. These simulated dissolution profiles were tested for the ±10% PE bounds as per FDA guidelines for Cmax and AUC.
Bioequivalence testing for the simulated profiles
The simulated dissolution profiles of the marketed formulation were prepared by varying the fraction of dissolution by 5, 11, 17, 20 and 25% in either ways, i.e., increase or decrease. The developed IVIVC model was utilized to predict the in vivo performance of these simulated dissolution profiles. Bioequivalence was tested between the simulated and marketed in vivo profiles.
Results and Discussion
Accuracy and precision were within acceptable limits for the developed LC-MS/MS method. The recovery of analytes was calculated from the spiked plasma samples of QCs. The absolute mean percent recoveries were 70.92±2.60, 74.82±4.04 and 73.66±3.64, respectively at LQC, MQC and HQC concentrations. Negligible matrix effect was observed as the calculated concentrations were within acceptable range of <±15% (106.1 to 108.3%). Therefore, ion suppression or enhancement from rabbit plasma was negligible.
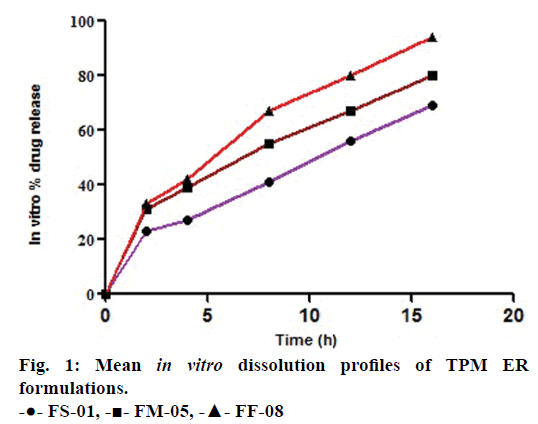
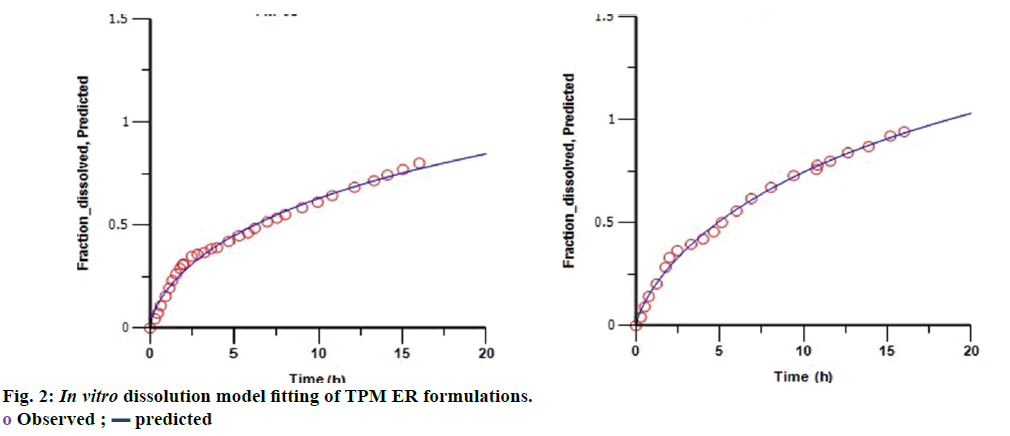
The similarity factors (f2) of FM- 05 vs. FF-08, FM-05 vs. FS-01, and FS-01 vs. FF-08 formulations were 49, 47 and 35, respectively. These values indicated that the dissolution profiles were sufficiently diverse to proceed for IVIVC. Observed raw data for dissolution did not show any lag time (Figure 1). Hill, Weibull, double Weibull and Makoid- Banakar models were evaluated for parameterizing the dissolution data. Hill equation was finalized on the basis of low AIC-105.84, low SBC-102.43 and good R2 0.9980 compared to the other dissolution model (Table 1). Hill Eqn. 3 parameterizes dissolution profile better than other models, indicates the probability of sigmoidal cumulative drug release profile. Figure 2 shows how good the observed dissolution data correlates with predicted data. Eqn. 3:
| Model | Parameter | ||
|---|---|---|---|
| AIC | SBC | Weighted correlation (R2) | |
| Hill | -105.84 | -102.43 | 0.9980 |
| Weibull | -105.79 | -101.86 | 0.9979 |
| Double Weibull | -99.09 | -92.27 | 0.9979 |
| Makoid-Banakar | -104.00 | -100.60 | 0.9978 |
Table 1: Summary of model performance and selection for mean in vitro dissolution profiles of topiramate er capsules

Where, Mαd Mean dissolution time, α-Exponent referred as slope or sigmodity factor Fd, ∞. The amount of drug released at time infinity.
The mean dissolution time (Mαd) for FS-01, FM-05, FF-08 and marketed (MKT) formulation was found to be 65.17, 39.46, 27.21 and 24.30 min, respectively. Fraction dissolved at infinity (Fd, ∞) has the value of 2.48, 2.15, 2.32 and 1.90 for FS-01, FM-05, FF-08 and MKT, respectively.
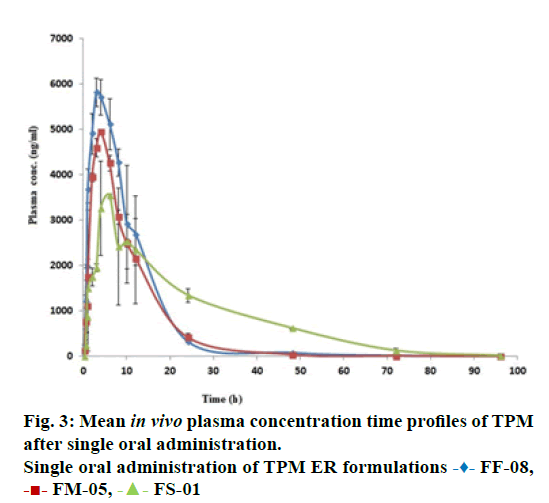
The in vivo pharmacokinetic profile for slow, medium and fast ER formulation was shown in Figure 3. Specific rank orders for these formulations were maintained same as in vitro. Therefore the data were fulfilled the primary requirement for assessment of IVIVC. Ideally, for generating unit impulse response (UIR), i.v. bolus as reference data is preferred because it did not show any absorption phase. In the current context, we used IR suspension as reference data, so it requires the elimination of absorption phase, which was done by ‘strip Ka’ option [18]. Then the obtained UIR is representative of only disposition kinetic. Polyexponential Eqn. 4 gives average UIR of the IR data without ‘strip Ka’. This equation has absorption as well as disposition component. Maziar kakhi et al. reported an Eqn. 5 with the assumption of first-order absorption process which describes only disposition phase of the pharmacokinetic profile (‘stripping Ka’). UIR will now explains hypothetical dose normalized i.v. bolus data and it always remains positive [18]. The obtained pharmacokinetic parameters for reference formulation were presented in Table 2. UIR values obtained from polyexpontial Eqn. 5 were well fitted with observed IR in vivo pharmacokinetic profile (Figure 4). Eqns. 4 and 5:
| Parameter | Estimate | Standard error | % coefficient of variation (CV) | 95% CI (lower-upper) | |
|---|---|---|---|---|---|
| Optimized IVIVC model | AbsScale | 1.69 | 0.0036 | 0.21 | 1.684-1.698 |
| Tscale | 1.71 | 0.0303 | 1.77 | 1.648-1.768 | |
| IR reference formulation | Ka | 1.53 | 0.22 | 15.00 | 1.03-2.02 |
| A1(ng/ml) | 764.54 | 59.63 | 7.80 | 635.71-893.3 | |
| Alpha (1/h) | 0.20 | 0.25 | 12.55 | 0.146-0.255 |
Table 2: Summary of parameters for optimized ivivc model and ir reference formulation
gIR (t) without strip Ka =

gIR (t) with strip Ka =

Where, gIR-unit impulse response (UIR) (ng/ml), Ai- pre exponential coefficient in polyexpontial model for IR data (ml-1), Bi-pre-exponential coefficient in the polyexpontial model for hypothetical dose normalized i.v. bolus data (ng/ml), D-Dose, H-Heaviside step function, Bi and λi: exponent in polyexpontial UIR of IR data and dose normalized i.v. bolus data, respectively. Ka: first-order absorption rate constant (ml/ng.h) tlag: initial time lag (h).
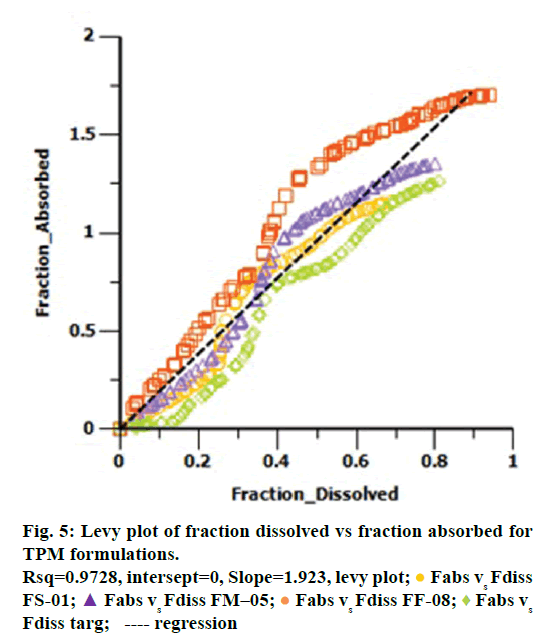
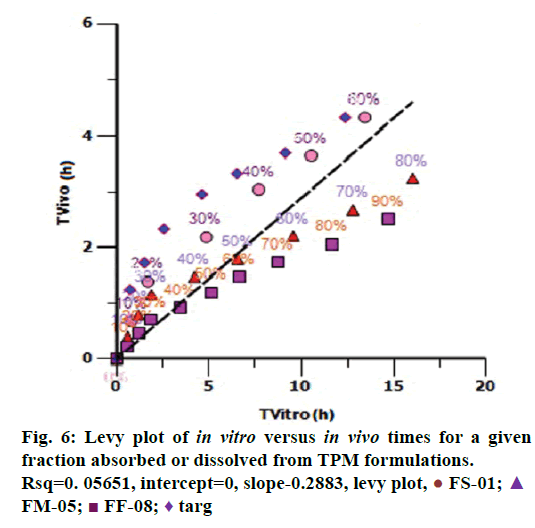
Levy plot of Fdiss vs. Fabs gives preliminary information about which correlation model should be considered for IVIVC [19,20]. Levy plot (Figure 5) shows the deviation of the data points from the regression line, therefore AbsScale should be utilized to minimize this deviation. Levy plot of Tvitro vs. Tvivo (Figure 6) shows time taken for a percentage of dissolution and the same percentage of absorption. Visual observation of this plot reveals the need of time scaling in correlation model for time correction. Linear correlation models mentioned earlier were screened for all formulations. AIC and SBC criteria help to choose the best model for efficiently exploring the in vitro-in vivo correlation by giving the quality of each model in comparison with other. AIC and SBC value for model 2 were low as compared to another model, i.e., -168.40 and -161.78 which indicates the goodness of fit (Table 3). Regression for model 3 and model 4 was better than the model 2. But, only regression criteria will not make them superior models. The additional criterion considered was %PE for Cmax and AUC. Except model 2, remaining models failed either internal validation or prediction. in vivo dissolution cut-off time (T cutoff) was not considered for the development of model because mean tmax was less than 24 h for all formulation. Linear correlation model 2 with the time scale (Ts) and absorption scale (As) were finalized to build IVIVC model. The obtained value of As (1.69) and Ts (1.71) were used to build the IVIVC (Table 2) Eqn. 6.
| Parameters | Model-1 | Model-2 | Model-3 | Model-4 |
|---|---|---|---|---|
| R2 | 0.9428 | 0.9869 | 0.9870 | 0.9871 |
| AIC | 905.94 | -168.40 | -166.42 | -166.34 |
| SBC | 912.55 | -161.78 | -156.50 | -153.11 |
Table 3: Summary of linear correlation models

Where Fa pred-the predicted counterpart of Fa,obs, Fd pred- the predicted fraction dissolved.
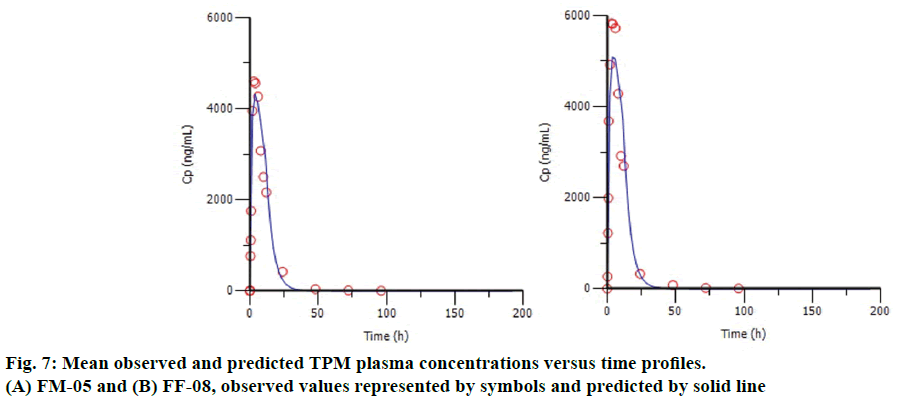
The %PE of Cmax and AUC for internal and marketed formulation were shown in Table 4. The average %PE for the all internal formulation was below 10%, satisfying the internal validation criterion. Figure 7 shows the plot of observed and predicted TPM plasma concentrations for the formulation FM-05 (Figure 7A) and FF-08 (Figure 7B). It indicates the good correlation between observed and predicted value, suggesting the better model fitting. Although formulation FF-08 shows comparatively high %PE for Cmax, i.e., -12.82, it satisfies the FDA requirement of individual %PE (below 15%). The formulation FS-01 gave the high %PE of -36.32 for AUC value so it was not considered for validation.
| Formulation | Cmax | AUC |
|---|---|---|
| % PE for internal formulation | ||
| FM-05 | -6.64 | 1.99 |
| FF-08 | -12.82 | 0.62 |
| Average of internal formulation | 9.73 | 1.31 |
| % PE for marketed formulation | ||
| Marketed formulation | 2.61 | -0.43 |
Table 4: Prediction errors (%) associated with cmax and auc for internal tpm er formulations and marketed formulation
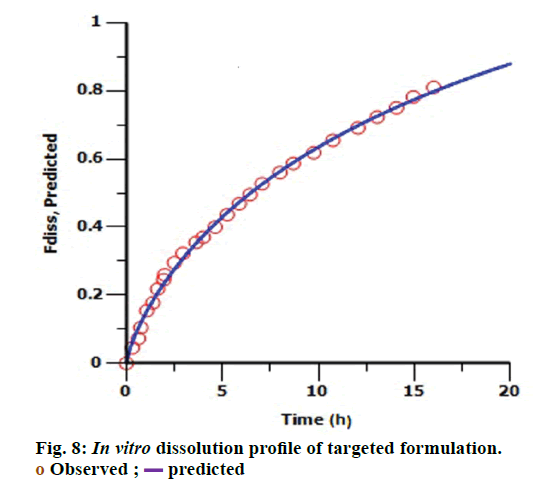
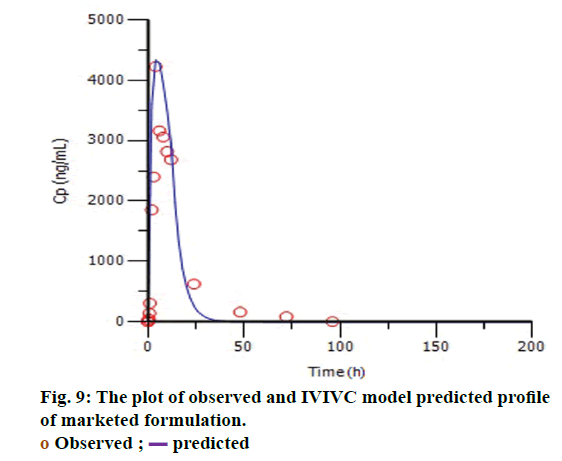
The targeted formulation was utilized to verify the usefulness of the validated model. Initially, in vitro dissolution profile of the targeted formulation was fitted into the Hill dissolution model which was used to build IVIVC model. Figure 8 shows the observed Fdiss values were close to the predicted values indicating that Hill model was suitable to fit the dissolution data. IVIVC models were then applied to predict the pharmacokinetic profile of targeted formulation. Figure 9 shows model predicted pharmacokinetic profile which was very close to the observed pharmacokinetic profile indicating the applicability of the model. The %PE of targeted formulation for Cmax and AUC was found to be 2.61 and -0.43 (within acceptable limit). The established IVIVC level A correlation confirms the usefulness of proposed IVIVC model. Level A correlation is quite imperative since it represents a point to point correlation between in vitro dissolution and the in vivo input rate of the drug from the formulation [21].
The developed IVIVC model could also predict in vivo profile of targeted formulation in initial stage so as to decline the failure rate of bioequivalence. This preclinical pharmacokinetic approach might be useful for the initial stages of development of ER formulation where several numbers of trials were required to set the formulations for IVIVC. If these trials were performed in animals, then it will ultimately reduce the optimization trials, human use, cost, as well as time.
IVIVC for simulated dissolution profiles of the marketed formulation were evaluated for the %PE by using the developed IVIVC correlation model. The result suggests that as the % variation in the fraction dissolution increases or decreases the %PE for Cmax and AUC also changes. It was observed that up to 7% change in the fraction dissolution, %PE passes the FDA criteria for ±10%. Above the 7% variation in the marketed dissolution profile, %PE for Cmax and AUC fall outside the error bound of ±10%. So the presented IVIVC correlation model allowed the ±7% of variation window in the fraction dissolution of marketed formulation.
Bioequivalence was observed up to 17% changes in the fraction dissolution of marketed formulation. Above 20% change in the fraction dissolution, it fails to show the bioequivalence to the marketed formulation.
In conclusion, the present work established a preclinical IVIVC model for TPM extended release capsules. A mathematical model with time scaling factor found helpful to perform IVIVC, which could be used as preliminary information for further development in clinical IVIVC. Hill equation was found suitable for parameterization of in vitro dissolution data. Deconvolution through convolution approach was used to build level A correlation which might be expected in human. It was also observed that targeted formulation was fitted in the proposed IVIVC model with acceptable %PE of 2.61 and -0.43 for Cmax and AUC. These studies were also provided the setup of a preclinical pharmacokinetic animal model for IVIVC. Further, with the help of the physiologicalbased pharmacokinetic modelling and in vitro-in vivo extrapolation methods, preclinical pharmacokinetic profile of different formulations could be extrapolated to humans [22,23]. Finally, the preclinical IVIVC of TPM would provide cost reduction in formulation development as the numbers of trials for expected in vivo profile were reduced due to simulated IVIVC model. The presented preclinical IVIVC of once daily extended release capsule gives expected in vivo release; however, further studies in human were needed to prove the utility of the developed model. This model also proved useful to set the limit of variation in the dissolution.
Acknowledgements
Authors TSL and SP thankful the CSIR for granting fellowships. Authors also thankful Subrata Kundu and Ganga Srinivasan for their valuable guidance. The CSIR-CDRI communication number of this article is 9419.
Conflict of interest
There is no potential conflict of interest.
Financial support and sponsorship
Nill.
References
- LaRoche SM. A new look at the second generation antiepileptic drugs: a decade of experience. Neurologist 2007;13:133-9.
- Silberstein SD. Topiramate in migraine prevention. Headache 2005;45:S57-S65.
- Bialer M. Extended release formulations for the treatment of epilepsy. CNS drugs 2007;21:765-74.
- Lambrecht LJ, Shekh‐Ahmad T, Todd WM, Halvorsen MB, Bialer M. Comparative pharmacokinetic analysis of USL255, a new once daily extended‐release formulation of topiramate. Epilepsia 2011;52:1877-83.
- Lu Y, Kim S, Park K. In vitro-in vivo correlation: perspectives on model development. Int J Pharm 2011;418:142-8.
- Nghiem T, Jackson G. Controlled release formulations using intelligent polymers. Google Patents. 2008.
- Cheng C, Wu PC, Lee HY, Hsu KY. Development and validation of an in vitro-in vivo correlation (IVIVC) model for propranolol hydrochloride extended-release matrix formulations. J Food Drug Anal 2014;22:257-63.
- Ghosh A, Nayak UK, Rout P, Nag T, Roy P. Preparation, evaluation and in vitro-in vivo correlation (IVIVC) study of lamivudine loaded microspheres. Res J Pharm Tech 2008;1:353-6.
- Philip AK, Pathak K. Wet process-induced phase-transited drug delivery system: a means for achieving osmotic, controlled and level A IVIVC for poorly water soluble drug. Drug Dev Ind Pharm 2008;34:735-43.
- Sankalia JM, Sankalia MG, Mashru RC. Drug release and swelling kinetics of directly compressed glipizide sustained release matrices: establishment of level A IVIVC. J Control Release 2008;129:49-58.
- Scheubel E, Adamy L, Hoffart V, Michel Cardot J. Selection of the most suitable dissolution method for an extended release formulation based on IVIVC level A obtained on cynomolgus monkey. Drug Dev Ind Pharm 2010;36:1320-9.
- Maeda T, Takenaka H, Yamahira Y, Noguchi T. Use of rabbits for GI drug absorption studies: relationship between dissolution rate and bioavailability of griseofulvin tablets. J Pharm Sci 1979;68:1286-9.
- Moore JW, Flanner HH. Mathematical comparison of dissolution profiles. Pharm Technol 1996;20:64-74.
- Center for Drug Evaluation and Research (CDER), USFDA. Guidance for industry d dissolution testing of immediate release and solid oral dosage forms 1997.
- Eddington ND, Marroum P, Uppoor R, Hussain A, Augsburger L. Development and internal validation of an in vitro-in vivo correlation for a hydrophilic metoprolol tartrate extended release tablet formulation. Pharm Res 1998;15:466-73.
- Matar KM, Marafie NA. Effect of pregnancy on topiramate pharmacokinetics in rabbits. Xenobiotica 2011;41:416-21.
- FDA Guidance for Industry, Extended release oral dosage forms: Development, evaluation and application of in vitro/in vivo Correlations 1997.
- Kakhi M, Marroum P, Chittenden J. Analysis of level A in vitro-in vivo correlations for an extended‐release formulation with limited bioavailability. Biopharm Drug Dispos 2013;34:262-77.
- Macha S, Yong CL, Darrington T, Davis MS, MacGregor TR, Castles M, et al. In vitro-in vivo correlation for nevirapine extended release tablets. Biopharm Drug Dispos 2009;30:542-50.
- Parejiya PB, Barot BS, Patel HK, Chorawala MR, Shelat PK, Shukla A. In vivo performance evaluation and establishment of IVIVC for osmotic pump based extended release formulation of milnacipran HCl. Biopharm Drug Dispos 2013;34:227-35.
- Cardot J, Beyssac E. In vitro-in vivo correlations: scientific implications and standardization. Eur J Drug Metab 1993;18:113-20.
- Wu C, Kou L, Ma P, Gao L, Li B, Li R, et al. Interspecies prediction of oral pharmacokinetics of different lacidipine formulations from dogs to human: physiologically based pharmacokinetic modelling combined with biorelevant dissolution. RSC Adv 2015;5:19844-52.
- Wang B, Liu Z, Li D, Yang S, Hu J, Chen H, et al. Application of physiologically based pharmacokinetic modeling in the prediction of pharmacokinetics of bicyclol controlled-release formulation in human. Eur J Pharm Sci 2015;77:265-72.
