- Corresponding Author:
- B. Syama sundar
Department of Pharmacy, Acharya Nagarjuna University, Nagarjuna Nagar, Guntur - 522 510
E-mail: profbsyamsundar@yahoo.co.in
| Date of Submission | 15 December 2009 |
| Date of Revision | 20 August 2010 |
| Date of Acceptance | 14 November 2010 |
| Indian J Pharm Sci, 2010, 72 (6): 798-801 |
Abstract
A new, simple high performance thin layer chromatographic method has been proposed for the determination of rizatriptan benzoate in a tablet dosage form. The drug was separated on aluminum plates precoated with silica gel 60 F 254 with dichloromethane-acetone-acetic acid 3:2:0.2(v/v/v) as mobilephase. Quantitative analysis was performed by densitometric scanning at 230 nm. The method was validated for linearity, accuracy, precision and robustness. The calibration plot was linear over the range 200-700 ng/band for rizatriptan benzoate. The method was successfully applied to the analysis of drug in bulk and marketed tablets.
Keywords
High-performance thin-layer chromatography, rizatriptan benzoate, tablets
Rizatriptan benzoate [1] is chemically N,N-dimethyl- 1,5-(1H-1,2,4-triazoal-1-yl methyl)-1H-indole-3- ethanamine monobenzoate with a molecular weight of 391.47. It is used in migraine therapy. Rizatriptan has been found to bind with high affinity to human 5HT 1B/1D receptor leading to inhibition of the neuropeptide release and reduced transmission in the trigeminal pain pathways. Literature survey revealed that only a few methods on liquid chromatography have been reported for the quantitative determination of rizatriptan in biological samples and tablet dosage forms [2-9]. This paper describes a simple, accurate, precise, and sensitive HPTLC method for determination of rizatriptan benzoate in tablets which was optimized and validated in accordance with guidelines suggested through International Conference on Harmonization [10].
Methanol, toluene, ethyl acetate, acetic acid, propanol, acetone, and dichloromethane (analytical reagent grade) were obtained from Sisco Research Laboratories, Mumbai (India). Standard bulk drug sample of rizatriptan benzoate (99.7% pure) was obtained as a gift sample from SMS Pharmaceuticals, Hyderabad (India). Maxalt tablets with label claim of 10 mg rizatriptan benzoate (Merck Sharp and Dohme Ltd) were used in this study.
A standard stock solution of rizatriptan benzoate was prepared by dissolving 10 mg drug in 100 ml methanol in order to make a concentration of 100 μg/ ml. Chromatography was performed on 10×10 cm aluminum plates pre-coated with 250-μm layers of silica gel 60 F254 (E. Merck, Darmstadt, Germany). Before use the plates were prewashed with methanol and activated at 110o for 5 min. Samples were applied to the plates as bands of 6 mm wide and 10 mm apart by means of a Camag (Switzerland) Linomat V sample applicator equipped with a 100 μl syringe (Hamilton, Bonaduz, Switzerland). Linear ascending development was performed in a 10×10 cm twin trough glass chamber (Camag), with dichloromethane-acetone-acetic acid 3:2:0.2 (v/v/v) as mobile phase and the chamber was pre saturated with mobile phase vapour for 10 min. The development distance was 8.5 cm with a development time of approximately 60 min. After chromatography the plates were dried in a current of air by using air blowing drier. Densitometric scanning was performed with a Camag TLC Scanner 3 at 230 nm for all measurements. The scanner was operated by Wincats software Version 1.2.3. The source of radiation was a deuterium lamp emitting a continuous UV spectrum between 200 and 400 nm. The slit dimensions were 5 mm × 0.45 mm and the scanning speed was 20 mm s-1.
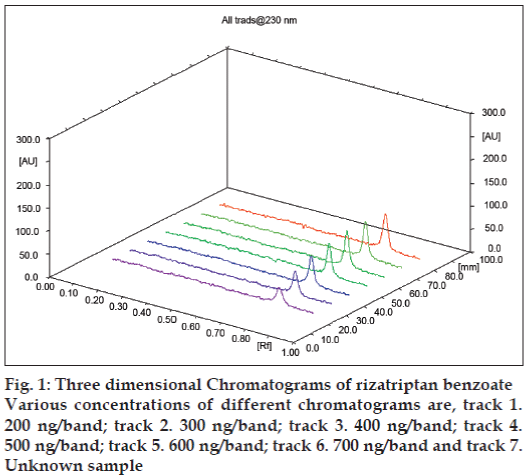
After chromatographic development, bands were scanned over the range 200-400 nm (spectrum scan speed 20 nm s-1) so that the drug could be estimated at 230 nm, which is ascertained by taking the spectrum at different concentrations between 200–700 ng with an increment of 100 ng. It is also observed that spectra are similar in their behavior as depicted through three dimensional spectra (fig. 1).
The standard stock solution of rizatriptan benzoate (100 μg/ml) was applied on a TLC plate, in the range 2-7 μl, by use of the Linomat V sample applicator and 100 μl syringe. The plate was developed and scanned under the conditions described above. Each amount was analyzed six times and peak areas were recorded. A calibration plot of peak area against respective amount was established for rizatriptan benzoate.
Twenty tablets were weighed accurately and finely powdered. A quantity of powder equivalent to 10 mg rizatriptan benzoate was weighed and transferred to a 100 ml volumetric flask containing approximately 50 ml methanol. The mixture was ultra sonicated for 5 min then diluted to volume with methanol. The solution was filtered using Whatmann 41 paper. Different aliquots of the filtrate were applied to a TLC plate. After the development of chromatogram the peak area of the bands was measured at 230 nm and the amount of drug in each tablet was determined from the calibration plot. The analytical procedure was repeated six times for the homogenous powder sample.
The limit of detection of a compound is defined as the smallest level of analyte that gives a measurable response. LOD was determined by using the equation LOD = 3.3×σ/S. The limit of quantitation is the lowest concentration of a compound that can be quantified with acceptable precision and accuracy. LOQ = 10×σ/S, where σ= the standard deviation of the response and S= the slope of the calibration curve.
To study intra-day and inter-day precision, three different concentrations (300, 400 and 500 ng/band) of sample solutions were prepared and applied to the TLC plates. All the solutions were analyzed in triplicate on the same day and on three different days to record intra-day and inter-day variations in the results respectively.
To check the accuracy of the method, recovery measurements were performed by the addition of standard drug solution at three different levels (50, 100 and 150%) to pre-analyzed sample solution (200 ng/band for rizatriptan benzoate so that after addition of standards, samples would be in the linear range). Three replicate estimations were carried out for each concentration level.
The effect of small, deliberate variation (±0.2%) of the analytical conditions on the peak areas of the drugs was examined in order to assess the robustness of the method. The robustness of the method was checked for 300 and 600 ng/band for rizatriptan benzoate.
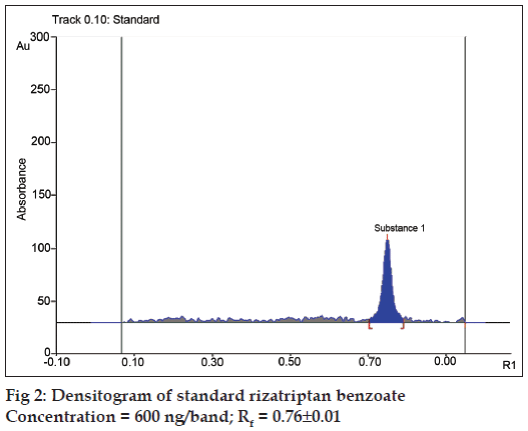
Different mobile phases containing toluene, methanol, acetic acid, propanol, acetone, ethyl acetate, dichloro methane in different proportions were examined. Of these the mixture of dichloro methane-acetone-acetic acid 3:2:0.2 (v/v/v) was found to be most suitable for the studies. The Rf value of rizatriptan benzoate was 0.76±0.01. The densitogram obtained from a standard solution of rizatriptan benzoate is shown in fig. 2.
The calibration plot was found to be linear over the range 200-700 ng/band for rizatriptan benzoate, with correlation coefficient of 0.9982±0.0102. The LOD and LOQ were found to be 50 and 200 ng/ band respectively. The proposed HPTLC method was validated for intra and inter day variations. The values of percent relative standard deviations were found to be 0.24 and 0.32 respectively which indicate that the method is precise. The method was also evaluated by assay of commercially available tablets containing rizatriptan benzoate. Six replicate analyses were performed on accurately weighed amount of the tablets. The percent assay was found to be 99.46±0.45 for rizatriptan benzoate. To study the accuracy of the method, recovery studies were performed. For rizatriptan benzoate, recovery ranged from 99.18 to 100.5%, with values of percent RSD ranging from 0.29 to 0.54 indicating that the proposed HPTLC method is highly accurate (Table 1). Study on the robustness of the method revealed that the peak areas were unaffected (RSD<2%) by small changes in the operating conditions and can be inferred to be more robust. The method validation parameters are presented in Table 2.
| Sample | Excess of drug added tothe analyte (%) | Theoretical content (ng) | % of recovery* | % of RSD |
|---|---|---|---|---|
| Rizatriptan benzoate | 50 | 300 | 99.37 | 0.29 |
| 100 | 400 | 99.18 | 0.37 | |
| 150 | 500 | 100.5 | 0.54 | |
| *Average of three determinations | ||||
Table 1: Results from recovery studies of rizatriptan benzoate
| Parameters | Results of rizatriptan benzoate |
|---|---|
| Linearity (ng/band) | 200-700 |
| Correlation coefficient | 0.9982 |
| LOD (ng/band) | 50 |
| LOQ (ng/band) | 200 |
| Interday Precision (%RSD) | 0.32 |
| Intraday Precision (%RSD) | 0.24 |
Table 2: Method validation parameters
Thus the validated HPTLC method for rizatriptan benzoate is simple, rapid, accurate, precise, sensitive, and robust and hence recommended for routine analysis of rizatriptan benzoate in bulk and tablet dosage forms.
Acknowledgements
The authors wish to express their gratitude to SMS Pharmaceuticals, Hyderabad, India for the gift sample of pure rizatriptan benzoate. Mrs. A. Suneetha is thankful to management of Hindu College of Pharmacy, Guntur, India for according permission to carryout research work.
References
- Maryadele JO, Heckelman PE, Koch CB, Roman KJ. editors. The Merck Index: An Encyclopedia of Chemicals, Drugs and Biologicals. 14th ed. Whitehouse Station NJ: Merck and co Inc; 2006.
- Chen J, Jiang W, Mei N, Gao X, Zhang Q. Liquid chromatographic method for the determination ofrizatriptan in human plasma. J Chromatogr B AnalytTechnol Biomed Life Sci 2004;805:169-73.
- Chen Y, Miao H, Lin M, Fan G, Hong Z, Wu H, et al. Development and validation of a selective and robust LC-MS/MS method for high-throughput quantifying rizatriptan in small plasma samples. J Chromatogr B AnalytTechnol Biomed Life Sci 2006;844:268-77.
- Vishwanathan K, Bartlett MG, Stewart JT. Determination of antimigraine compounds rizatriptan, zolmitriptan, naratriptan and sumatriptan in human serum by liquid chromatography/electrospray tandem mass spectrometry. Rapid Commun Mass Spectrom 2000;14:168-72.
- Chen J, Jiang WM, X ie YL, Jin L, Mei N, Liang XG. Evaluation of bioequivalence and pharmacokinetics of two formulations of rizatriptan after single oral administration in healthy volunteers.Arzneimittelforschung 2005;55:355-8.
- Musson DG, Birk KL, Panebianco DL, Gagliano KD, Rogers JD, Goldberg MR. Pharmacokinetics ofrizatriptan in healthy elderly subjects. Int J ClinPharmacolTher 2001;39:447-52.
- Altinoz S, Ucar G, Yildiz E. Determination of rizatriptan in its tablet dosage form by UV and Spectrofluorimetric methods. Anal Lett2002;35:2471-85.
- MallikarjunaRao B, Sangaraju S. Development and validation of a specific stability indicating high performance liquid chromatographic method for rizatriptan benzoate. J Pharm Biomed Anal 2006;41:1146-51.
- Sundar BS, Suneetha A. Validation of RP-HPLC analytical method for quantitation of rizatriptan benzoate in tablet dosage form. Indian Drugs 2009;46:422-5.
- International Conference on Harmonization (2005) ICH harmonized tripartite guidelines, Validation of Analytical Procedures׃ Text and Methodology Q2 (R1). Geneva: ICH; 2005.

