- *Corresponding Author:
- M. M. Desai
Maulana Azad College of Arts and Science, Dr. Babasaheb Ambedkar Marathwada University, University Campus, Aurangabad, Maharashtra 431004,India
E-mail: makaranddesai18@gmail.com
| Date of Received | 10 April 2022 |
| Date of Revision | 09 February 2023 |
| Date of Acceptance | 17 July 2023 |
| Indian J Pharm Sci 2023;85(4):962-971 |
This is an open access article distributed under the terms of the Creative Commons Attribution-NonCommercial-ShareAlike 3.0 License, which allows others to remix, tweak, and build upon the work non-commercially, as long as the author is credited and the new creations are licensed under the identical terms
Abstract
The United States Pharmacopeia monograph of carvedilol states 3 different methods for evaluation of organic impurities. The present study provides a single stability-indicating analytical method for estimation of carvedilol and its organic impurities from bulk and its tablets dosage forms. The method uses Purosphere STAR RP 18-endcapped (250×4 mm, 3 μm) column and a gradient elution with a flow of 1 ml/min. Mobile phase buffer was prepared by adding 1 ml of triethylamine solution to 20 mM potassium dihydrogen phosphate solution, and pH was adjusted to 2.8±0.05 with orthphosphoric acid. Mobile phase A comprises of acetonitrile:buffer (10:1000 v/v), whereas Mobile phase B consist of methanol:acetonitrile:buffer (500:400:150 v/v/v). The eluted compounds were monitored at 226 nm and 240 nm. The column oven temperature was maintained at 50°. In the current chromatographic method total 19 impurities (3 degradation and 16 process related impurities) of carvedilol were separated in a single run. The developed method was validated as per International Council for Harmonisation guidelines for various parameters like system suitability, linearity, precision, accuracy, sensitivity (limits of detection and limits of quantification) and force degradation. All the validation parameters were within the acceptable range. The developed and validated method was quantitatively applied for estimation of all the process and degradation impurities in carvedilol active pharmaceutical ingredient and tablet formulation.
Keywords
Carvedilol, RP-HPLC, method validation, stability-indicating, tablets
Carvedilol (CVD), chemically represented as (2RS)-1-(9H-Carbazol-4-yloxy)-3-[[2-(2-methoxyphenoxy)ethyl]amino]propan-2-ol (fig. 1). It is a non-selective betablocker and induces vasodilation by alpha-1 adrenoreceptor blockade. It is used to treat high blood pressure, Congestive Heart Failure (CHF), and left ventricular dysfunction in people who are otherwise stable[1,2]. CVD is rapidly absorbed after oral administration, however the absolute bioavailability of CVD in humans is approximately 25 % because of significant first-pass hepatic metabolism by cytochrome P450[3,4].
CVD is official in United States Pharmacopeia (USP), British Pharmacopoeia (BP), European Pharmacopoeia (Ph.Eur.) whereas CVD Tablets are official in BP and USP[5-7]. The Active Pharmaceutical Ingredient (API) vendor has provided 19 impurities of CVD out of which 16 are process related impurities and 3 are degradation impurities (Table 1). The estimation of impurities in molecule is essential to confirming stability of the molecule. As per USP monograph there are 3 methods for estimation of impurities, which able to estimate about 7 impurities in total. Procedure 1 is used to quantitate USP-related compounds A, B, C, D, E, and CVD bisalkylpyrocatechol derivative, which has a run time of about 60 mins. Procedure 2 enables the estimation of USP-related compounds A, B, C, F, N-Isopropylcarvedilol, and biscarbazole with a run time of 80 mins. Procedure 3 is to be followed if CVD related compound F is present in the drug substance[5]. The Ph.Eur./BP method enables the estimation of Impurity A and Impurity C only with the runtime of about 35 mins[6,7]. Literature review provided few method for estimation of CVD along with the impurities by High-Performance Liquid Chromatography (HPLC)[8-12], Ultra-Performance Liquid Chromatography (UPLC)[13,14], capillary electrophoresis[15], however all the methods are able to estimate about 3 to 9 impurities. The CVD procured from Ipca laboratories have about 16 process related and about 3 degradant impurities as per the route of synthesis. The vendor also use 2 different method for estimation of the about 15 impurities. Hence the current work attempts to develop a single stability-indicating method which can separate all reported impurities in shorted possible time so that the method can be used routinely for quantitative estimation of all 19 impurities in API and its tablet dosage formulation.
Materials and Methods
CVD and its impurities were obtained as gift sample from Ipca Laboratories Ltd., Mumbai, India. Acetonitrile (HPLC grade), Methanol (HPLC grade), Triethylamine (for Chromatography), Potassium dihydrogen phosphate (Emparta® ACS) and Orthophosphoric acid 88 % (Emparta® ACS) was purchased from Merck Life Sciences Pvt. Ltd., Mumbai, India. Purified water was obtained from Milli Q water purification system, Millipore (Massachusetts, USA), and used in preparation of solutions. Buffers and all other chemicals were of analytical grade.
| Name | Structure | Origin of Impurity |
|---|---|---|
| 1-(9H-Carbazol-4-yloxy)-3-aminopropan-2-ol | 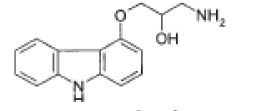 |
Degradation impurity |
| 3-(9H-Carbazol-4-yloxy)propane-1, 2-diol | 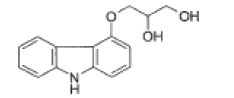 |
Process related impurity |
| 4-HOC | 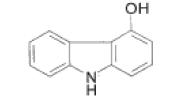 |
Process related impurity |
| Impurity-A | 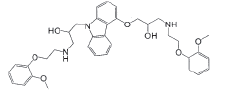 |
Process related impurity |
| Bisalkylpyrocatechol | 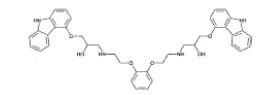 |
Process related impurity |
| N-Methyl propanol amine | 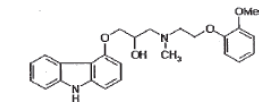 |
Process related impurity |
| N-Isopropyl carvedilol | 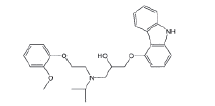 |
Process related impurity |
| Impurity- D (USP) | 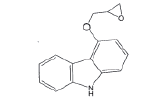 |
Process related impurity |
| Chloro impurity | 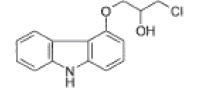 |
Process related impurity |
| N-Methyl carbazole | 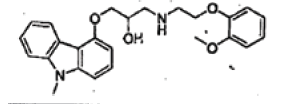 |
Process related impurity |
| Keto carvedilol | 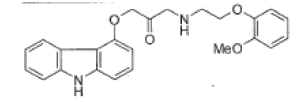 |
Degradation impurity |
| Impurity-C | 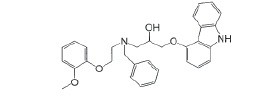 |
Process related impurity |
| Acetyl Carvedilol | 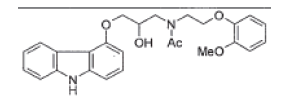 |
Degradation and process related impurity |
| Impurity-D(EP) | 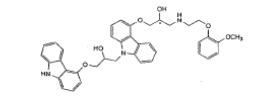 |
Process related impurity |
| Impurity-B | 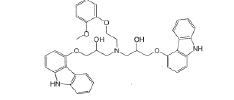 |
Process related impurity |
| Biscarbazole | 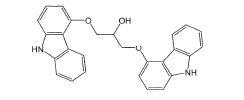 |
Process related impurity |
| Impurity-E | 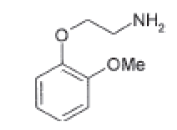 |
Process related impurity |
| Guaiacol | 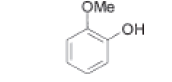 |
Process related impurity |
| Acetyl MEA | 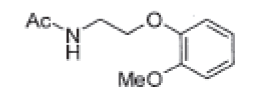 |
Process related impurity |
Table 1: Impurities and its Structure
Materials:
The Experiments were performed on Waters Alliance e2695 System (Waters Corporation, Milford, MA) equipped with an auto sampler, a quaternary gradient pump, a temperature controlled column compartment and photo-diode array detector. Data acquisition was performed on Empower 3 Chromatography Software (Waters).
Chromatographic condition:
The chromatographic separation was achieved using Purosphere STAR RP 18-endcapped (250×4 mm, 3 µm) column with a gradient elution with flow rate of 1 ml/min. The column temperature was maintained at 50°, whereas sample temperature was maintained at 10°. Chromatographic elution was monitored at 226 nm and 240 nm. Potassium dihydrogen phosphate (20 mM) with 1 ml triethylamine, pH adjusted to 2.8±0.05 with orthophosphoric acid was used as mobile phase buffer. The mobile phase A consists of acetonitrile:buffer (10:1000 v/v) and mobile phase B consist of methanol:acetonitrile:buffer (500:400:150 v/v/v). A gradient program as per Table 2 was used for separation of impurities. Injection volume of 10 µl was used. The samples solution, standard solution and impurity solutions were prepared in a mixture of 780 ml of water, 220 ml of acetonitrile and 1 ml of trifluoroacetic acid.
| Time (min) | Flow (ml/min) | Solution A (%) | Solution B (%) |
|---|---|---|---|
| 0 | 1 | 85 | 15 |
| 2 | 1 | 85 | 15 |
| 11 | 1 | 65 | 35 |
| 50 | 1 | 50 | 50 |
| 55 | 1 | 40 | 60 |
| 60 | 1 | 35 | 65 |
| 65 | 1 | 30 | 70 |
| 70 | 1 | 20 | 80 |
| 75 | 1 | 85 | 15 |
| 80 | 1 | 85 | 15 |
Table 2: Gradient Program
Preparation of sample solution:
ASample solution was prepared by dissolving sufficient quantity of CVD or equivalent tablet power to obtain 0.5 mg/ml solution using above mentioned diluent. The solution was sonicated for 30 mins, after cooling to room temperature sample was filtered through 0.45 µm polytetrafluoroethylene membrane syringe filter.
Standard preparation:
For standard solution preparation 25 mg of CVD was dissolved in about 50 ml of above diluent to give 0.5 mg/ml solution. This stock solution was suitably diluted to give 0.001 mg/ml solution of CVD.
Method validation:
The final developed method was validated for various parameters i.e. specificity, linearity, LOD and LOQ, precision, accuracy (recovery), solution stability and stress degradation studies as per ICH guide lines (ICH Q2 (R1)[16].
Specificity:
Specificity is defined as the ability of the method to unambiguously assess the analyte in the presence of other potential components which typically includes impurities, degradation products, formulation matrix, etc. For establishing specificity diluent, placebo preparation, sample solution, sample solution spiked with all impurities and individual impurity solutions were injected into the final developed method. The specificity was also assessed by injecting samples of stress degradation study. The samples were deliberately exposed to harsh conditions to generate the degradation products. The details of stress conditions are discussed in separate section.
Linearity:
Minimum of six concentration levels of each impurities corresponding to 5 % to 150 % of the specified value were used to verify the linearity of the detector. For linearity plot construction 0.05, 0.10, 0.20, 0.50, 1.00, and 1.50 µg/ml solutions were prepared for all impurities and CVD. The relative response factor for each impurity against the CVD was calculated.
Detection and quantitation limits:
Limit of Detection (LOD) and Limit of Quantitation (LOQ) were obtained as per International Council for Harmonisation (ICH) method based on residual standard deviation of the regression line of response (σ) and slope (s). The LOD was defined as the minimum concentration of analyte that is detected but not suitable for quantification with given experimental condition. It is calculated using the formula 3.3σ/s. The LOQ was defined as the minimum concentration of analyte at which it is possible to quantitate with appropriate precision and accuracy. It is calculated using the formula 10σ/s.
Accuracy of the method:
The method accuracy was established by recovery study and was performed over the range from LOQ, 50 %, 100 % and 150 % of the specification level (0.2 %) of each impurity. Triplicate analysis at each level was performed. The acceptance criteria was defined as mean percentage overall recovery value for each impurity is 85 % to 115 %. Whereas mean percentage recovery value at LOQ level for each known and unknown impurity is 70 % to130 %
Precision:
Method precision was determined from six replicate sample preparation spiked with all impurities (0.2 %). The Coefficient of Variation (% CV) should be between ±5 % for each impurity at spiked concentration.
Solution stability studies:
The stability of solutions was performed at 10°, by analyzing the spiked sample at regular intervals using the developed method. The spiked sample was analyzed at 0 h, 5 h, 17 h, 30 h and 38 h. The acceptance criteria was defined as the absolute difference from initial for known and unknown individual impurity shall not be more than ±0.05, however the absolute difference from initial for total impurity shall not be more than ±0.2.
Stress degradation studies:
To identify the probable degradation products and to establish the specificity of the method, stress testing is a useful tool. The stress degradation of CVD, placebo and tablet sample was conducted by acid hydrolysis, base hydrolysis, oxidative degradation and photolytic degradation. Acid hydrolysis was performed by adding 5 ml of 2 N hydrochloric acid solution to the sample and subsequent heating in water bath at 60° for 30 min. Whereas, 5 ml of 2 N sodium hydroxide solution was added to the sample with subsequent heating at 60° for 30 min for base hydrolysis. After completion of treatment the samples were neutralized and further sample preparation was followed given under samples preparation section. For oxidative degradation, 5 ml of 30 % H2O2 solution was added to the sample kept at room temperature for 30 min and followed as above. For photolytic degradation, CVD, placebo and tablet samples were exposed to Ultraviolet (UV) light for 24 h and the samples were prepared as mentioned above.
Results and Discussion
The main objective of the study was to develop a chromatographic method which can separate CVD from its all impurities (16 process related and 3 degradation, Table 1) and then quantitatively estimate the impurities from API and its tablet formulation. In USP monograph of CVD, 3 methods are provided for the estimation of organic impurities. To initiate the method development organic impurity procedure 1 was used as reference and all the impurities were injected in the same. All the impurities were not resolved in the same. Hence the API vendor’s procedure 1 was used with YMC Pack Pro C8 150×4.6, 5 µ column, with Buffer (0.02 M KH2PO4, pH 2.0): ACN (70:30). In this method about 10 impurities were well resolved however 5 impurities were co-eluting with other. Further optimization using this method was done by changing column length (YMC Pack Pro C8 250×4.6, 5 µ and Inertsil C8 250×4.6, 5 µ), column chemistry (Inertsil C18 250×4.6, 5 µ and InertSustain AQ-C18 250×4.6, 5 µ), particle size of column (Purosphere STAR RP-18 endcapped 250×4 mm, 3 µm) and using different mobile phases. In the final method as mentioned in experimental section was selected based on the well resolution of all 19 impurity peaks from main peak of CVD. Out of 19 impurities, Impurity E, Acetyl MEA, Guaiacol were having λmax around 226 nm, hence chromatographic elution was monitored at two wavelengths i.e. 226 nm and 240 nm. The resolution in all the impurities was observed mainly due to the non-polar nature of the column due to endcapping, high carbon loading and lower particle size of silica in Purosphere STAR-RP-18 column[10]. The representative chromatogram of the spiked sample and as such sample at both wavelengths is given in fig. 2 and fig. 3, respectively. The developed method was then validated as per ICH Q2(R2) guidelines. The validation results are discussed in details in following sections.

Fig 1: Chemical structure of carvedilol

Fig 2: Chromatogram of spiked sample indicating the specificity

Fig 3: Chromatogram of as such sample
The method specificity was proved by injecting the placebo solution, sample spiked with all 19 impurities, each individual impurity and standard solution and sample solution. All the impurities and the placebo peaks were very well resolved from the main peak of CVD and each other (fig. 1, Table 2). The peak purity was established for peaks of impurities and CVD, which was found to be pure when analyzed using Empower 3 software. The RRT values for all the impurities were given in Table 3.
| Name | RRT* | RRF | Correlation Coefficient | % LOD | % LOQ |
|---|---|---|---|---|---|
| Carvedilol (240 nm) | 1 | - | 0.9999 | 0.003 | 0.008 |
| Carvedilol (226 nm) | 1 | - | 0.9998 | - | - |
| 1-(9H-Carbazol-4-yloxy)-3-aminopropan-2-ol | 0.36 | 1.38 | 0.9999 | 0.003 | 0.008 |
| 3-(9H-Carbazol-4-yloxy)propane-1, 2-diol | 0.62 | 1.84 | 0.9999 | 0.003 | 0.008 |
| 4-HOC | 0.73 | 2.12 | 0.9999 | 0.003 | 0.008 |
| Impurity-A | 0.86 | 0.49 | 0.9993 | 0.011 | 0.032 |
| Bisalkylpyrocatechol | 0.94 | 0.56 | 0.9978 | 0.007 | 0.020 |
| N-Methyl propanol amine | 1.07 | 0.58 | 0.9999 | 0.008 | 0.024 |
| N-Isopropyl Carvedilol | 1.34 | 0.87 | 0.9999 | 0.005 | 0.016 |
| Impurity-D (USP) | 1.44 | 1.33 | 0.9995 | 0.003 | 0.010 |
| Chloro impurity | 1.47 | 1.34 | 0.9997 | 0.003 | 0.008 |
| N-Methyl carbazole | 1.65 | 0.83 | 0.9999 | 0.007 | 0.020 |
| Keto carvedilol | 1.82 | 0.63 | 0.9998 | 0.007 | 0.020 |
| Impurity-C | 1.87 | 0.71 | 0.9995 | 0.005 | 0.016 |
| Acetyl carvedilol | 1.89 | 0.86 | 0.9999 | 0.005 | 0.016 |
| Impurity-D(EP) | 1.98 | 0.96 | 0.9997 | 0.004 | 0.012 |
| Impurity-B | 2.02 | 1.04 | 0.9997 | 0.005 | 0.016 |
| Biscarbazole | 2.11 | 1.61 | 0.9999 | 0.007 | 0.020 |
| Impurity-E$ | 0.21 | 0.40 | 0.9995 | 0.008 | 0.024 |
| Guaiacol$ | 0.43 | 0.42 | 1.0000 | 0.013 | 0.040 |
| Acetyl MEA$ | 0.49 | 0.35 | 1.0000 | 0.013 | 0.040 |
Table 3: Specificity, Linearity and Sensitivity
The calibration curves were constructed using the peak response vs. the concentration for CVD and all 19 impurities. The peak response was found proportional to concentration level over the range of 5 % to 150 % of the specification levels i.e. 0.2 % as given in Table 3. The correlation coefficients for CVD and its impurities were more than 0.999 indicating the linear response[17].
The LOD and LOQ values were obtained from the linearity curve as per ICH guidelines and value are represented in Table 3. The obtained LOQ values were found to be less than 20 % of the specification level i.e. 0.2 %. Accuracy by spiked recovery for CVD and its impurities in placebo at LOQ level and at 50 %, 100 % and 150 % levels in formulation sample showed good correlation. The triplicate analysis for all levels showed average recovery with in acceptance criteria. The results are summarized in Table 4 and met the acceptance criteria specified in the foot note to the table.
| Name | LOQ Recovery | 50 % Recovery | 100 % Recovery | 150 % Recovery |
|---|---|---|---|---|
| Carvedilol (240 nm) | 88.2 | 101.3 | 98.2 | 97.8 |
| 1-(9H-Carbazol-4-yloxy)-3-aminopropan-2-ol | 109.8 | 104.2 | 105.6 | 102.3 |
| 3-(9H-Carbazol-4-yloxy)propane-1, 2-diol | 95.8 | 96.7 | 94.5 | 95.2 |
| 4-HOC | 97.0 | 95.4 | 90.1 | 90.8 |
| Impurity-A | 100.9 | 102.4 | 109.5 | 104.6 |
| Bisalkylpyrocatechol | 80.9 | 95.6 | 102.9 | 99.1 |
| N-Methyl propanol amine | 108.1 | 105.7 | 119.4 | 115.2 |
| N-Isopropyl carvedilol | 116.2 | 108.9 | 105.7 | 106.9 |
| Impurity- D (USP) | 105.6 | 109.1 | 114.9 | 112.3 |
| Chloro impurity | 98.0 | 99.5 | 105.8 | 110.8 |
| N-Methyl carbazole | 104.6 | 103.8 | 104.3 | 105.2 |
| Keto carvedilol | 107.3 | 106.8 | 108.0 | 107.5 |
| Impurity-C | 95.8 | 97.2 | 106.4 | 99.2 |
| Acetyl carvedilol | 103.7 | 99.9 | 102.1 | 98.4 |
| Impurity-D(EP) | 93.8 | 98.4 | 96.8 | 97.7 |
| Impurity-B | 76.2 | 100.9 | 108.0 | 105.2 |
| Biscarbazole | 97.8 | 91.3 | 85.6 | 93.2 |
| Impurity-E (226nm) | 119.1 | 112.5 | 108.2 | 114.8 |
| Guaiacol (226nm) | 102.9 | 104.2 | 108.3 | 102.9 |
| Acetyl MEA (226nm) | 118.1 | 106.7 | 101.5 | 108.7 |
Note: All the values which are reported are mean of 3 values. Acceptance criteria: Mean % overall recovery value for each impurity is 85% to 115%. Mean % recovery value at LOQ level for each known and unknown impurity is 70% to130%
Table 4: Method Recovery
The instrument precision established by injection six replicate injections of the standard solution and the % Relative Standard Deviation (RSD) of 0.59 % for replicate injection was well within the acceptance criteria of 2 %, indicating the system suitability. In the method precision, six sample preparations showed the % RSD with in the acceptance criteria of less than 5 % for all the impurities and CVD indicating that the method is repeatable. The results are summarized in Table 5. The solution stability performed at 10° showed that the sample were stable upto 38 h. The absolute difference from the initial concentration was found to be less than ±0.05 upto 38 h. The results are summarized in Table 6.
| Impurity | Sample 1 | Sample 2 | Sample 3 | Sample 4 | Sample 5 | Sample 6 | RSD |
|---|---|---|---|---|---|---|---|
| 1-(9H-Carbazol-4-yloxy)-3-aminopropan-2-ol | 0.251 | 0.256 | 0.258 | 0.258 | 0.265 | 0.257 | 1.7 |
| 3-(9H-Carbazol-4-yloxy)propane-1, 2-diol | 0.211 | 0.214 | 0.204 | 0.201 | 0.224 | 0.197 | 4.7 |
| 4-Hydroxy carbazole | 0.208 | 0.203 | 0.203 | 0.205 | 0.213 | 0.204 | 1.9 |
| Impurity-A | 0.203 | 0.205 | 0.198 | 0.200 | 0.201 | 0.200 | 1.2 |
| Bisalkylpyrocatechol | 0.232 | 0.225 | 0.221 | 0.219 | 0.221 | 0.231 | 2.5 |
| N-Methyl propanol amine | 0.251 | 0.252 | 0.250 | 0.251 | 0.252 | 0.249 | 0.5 |
| N-Isopropyl carvedilol | 0.213 | 0.212 | 0.214 | 0.214 | 0.212 | 0.213 | 0.4 |
| Impurity- D (USP) | 0.254 | 0.249 | 0.236 | 0.258 | 0.241 | 0.262 | 4 |
| Chloro impurity | 0.212 | 0.216 | 0.220 | 0.219 | 0.218 | 0.222 | 1.6 |
| N-Methyl carbazole | 0.205 | 0.210 | 0.211 | 0.209 | 0.206 | 0.209 | 1.1 |
| Keto carvedilol | 0.289 | 0.282 | 0.279 | 0.290 | 0.281 | 0.295 | 2.2 |
| Impurity-C | 0.237 | 0.226 | 0.227 | 0.227 | 0.226 | 0.238 | 2.5 |
| Acetyl carvedilol # | 0.223 | 0.221 | 0.219 | 0.220 | 0.227 | 0.219 | 1.4 |
| Impurity-D(EP) | 0.194 | 0.198 | 0.193 | 0.193 | 0.191 | 0.197 | 1.4 |
| Impurity-B | 0.254 | 0.248 | 0.253 | 0.253 | 0.255 | 0.264 | 2.1 |
| Biscarbazole | 0.165 | 0.159 | 0.161 | 0.160 | 0.156 | 0.167 | 2.5 |
| Impurity-E (226 nm) | 0.256 | 0.249 | 0.246 | 0.246 | 0.254 | 0.239 | 2.5 |
| Guaiacol (226 nm) | 0.224 | 0.227 | 0.226 | 0.228 | 0.233 | 0.226 | 1.4 |
| Acetyl MEA (226 nm) | 0.215 | 0.212 | 0.201 | 0.215 | 0.209 | 0.205 | 2.7 |
Note: Acceptance Criteria: % RSD of 6 replicate injections of standard solution is not more than 5.0
Table 5: Method Precision
| Impurity (240 nm) | 0 h | 5 h | 17 h | 30 h | 38 h | Absolute difference |
|---|---|---|---|---|---|---|
| 1-(9H-Carbazol-4-yloxy)-3-aminopropan-2-ol | 0.257 | 0.257 | 0.258 | 0.259 | 0.26 | 0.003 |
| 3-(9H-Carbazol-4-yloxy)propane-1, 2-diol | 0.197 | 0.201 | 0.209 | 0.219 | 0.225 | 0.028 |
| 4-Hydroxy carbazole | 0.204 | 0.204 | 0.204 | 0.203 | 0.204 | 0.000 |
| Impurity-A | 0.200 | 0.198 | 0.199 | 0.199 | 0.201 | 0.001 |
| Bisalkylpyrocatechol | 0.231 | 0.217 | 0.227 | 0.220 | 0.237 | 0.006 |
| N-Methyl propanol amine | 0.249 | 0.251 | 0.250 | 0.250 | 0.255 | 0.006 |
| N-Isopropyl carvedilol | 0.213 | 0.213 | 0.214 | 0.215 | 0.216 | 0.003 |
| Impurity- D (USP) | 0.262 | 0.257 | 0.247 | 0.235 | 0.230 | -0.032 |
| Chloro impurity | 0.222 | 0.220 | 0.219 | 0.222 | 0.222 | 0.000 |
| N-Methyl carbazole | 0.209 | 0.209 | 0.210 | 0.207 | 0.210 | 0.001 |
| Keto carvedilol | 0.295 | 0.286 | 0.271 | 0.274 | 0.286 | -0.009 |
| Impurity-C | 0.238 | 0.227 | 0.226 | 0.231 | 0.237 | -0.001 |
| Acetyl carvedilol # | 0.219 | 0.229 | 0.222 | 0.222 | 0.222 | 0.003 |
| Impurity-D(EP) | 0.197 | 0.193 | 0.193 | 0.193 | 0.195 | -0.002 |
| Impurity-B | 0.264 | 0.254 | 0.253 | 0.255 | 0.262 | -0.002 |
| Biscarbazole | 0.167 | 0.161 | 0.163 | 0.162 | 0.165 | -0.002 |
| Impurity-E (226 nm) | 0.239 | 0.250 | 0.250 | 0.254 | 0.249 | 0.01 |
| Guaiacol (226 nm) | 0.226 | 0.229 | 0.229 | 0.230 | 0.238 | 0.012 |
| Acetyl MEA (226 nm) | 0.205 | 0.212 | 0.213 | 0.215 | 0.216 | 0.011 |
| Unknown max | 0.088 | 0.090 | 0.088 | 0.089 | 0.091 | 0.003 |
| Total impurities | 3.815 | 3.767 | 3.753 | 3.747 | 3.816 | 0.001 |
Note: Absolute difference from initial for known and unknown impurity shall not be more than ±0.05. Absolute difference from initial for total impurity shall not be more than ±0.2
Table 6: Solution Stability
The results of stress degradation study are given in Table 7. The table indicates that, CVD undergoes degradation mainly due to base catalyzed hydrolysis and oxidation. Upto 14 % of the impurities were generated in oxidative degradation of CVD and upto 13 % in the formulation sample. However the hydrolytic degradation generated upto 5 % impurities in CVD and its formulation. The mass balance study showed results of more than 95 % indicate that a good correlation was observed between generation of impurities in the degradation sample and the assay value of the sample.
| Condition | % Assay | % of Total Impurities | % Mass balance |
| Sample as such | 94.5 | 0.27 | NA |
| Acid hydrolysis | 93.0 | 0.21 | 98.4 |
| (Sample+5 ml 2N HCl at 60° for 30 min) | |||
| Base hydrolysis | 86.8 | 4.69 | 96.5 |
| Sample +5 ml 2N NaOH at 60º for 30 min | |||
| Oxidative degradation | 80.2 | 12.76 | 98.8 |
| Sample +5 ml H2O2 for 30 min | |||
| Photolytic degradation | 93.5 | 0.121 | 98.8 |
| Sample+24 h in UV light | |||
| API as such | 100.5 | 0.176 | NA |
| Acid hydrolysis | 98.8 | 0.22 | 98.4 |
| (API+5 ml 2N HCl at 60° for 30 min) | |||
| Base hydrolysis | 90.2 | 6.14 | 95.7 |
| API+5 ml 2N NaOH at 60° for 30 min | |||
| Oxidative degradation | 86.5 | 13.82 | 99.1 |
| API+5 ml H2O2 for 30 min | |||
| Photolytic degradation | 99.6 | 0.18 | 99.1 |
| API+24 h in UV light |
Table 7: Force Degradation Study
These experimental results indicate that the proposed single method is suitable for simultaneous qualitative and quantitative determination of CVD and its 19 impurities in pharmaceutical formulations and in the bulk drug. The method is highly sensitive, and able to estimate all the impurities with precision and accuracy. Validation results indicate that the method is suitable, reliable, and applicable for qualitative and quantitative determination of CVD and its related substances in tablets and raw materials in a day to day analysis.
Acknowledgements:
The authors would like to thank the Ipca Laboratory for providing the standards for the research work.
Conflict of interest:
Authors declare that there is no conflict of interest exists.
References
- Ruffolo RR, Feuerstein GZ. Pharmacology of carvedilol: Rationale for use in hypertension, coronary artery disease, and congestive heart failure. Cardiovasc Drug Ther 1997;11:247-56.
[Crossref] [Google Scholar] [PubMed]
- Gannu R, Yamsani VV, Rao YM. New RP‐HPLC method with UV‐detection for the determination of carvedilol in human serum. J Liq Chromatogr Relat Technol 2007;30(11):1677-85.
- Sharma A, Jain CP, Tanwar YS. Preparation and characterization of solid dispersions of carvedilol with poloxamer 188. J Chilean Chem Soc 2013;58(1):1553-7.
- Ubaidulla U, Reddy MV, Ruckmani K, Ahmad FJ, Khar RK. Transdermal therapeutic system of carvedilol: Effect of hydrophilic and hydrophobic matrix on in vitro and in vivo characteristics. AAPS PharmSciTech 2007;8(1):2.
[Crossref] [Google Scholar] [PubMed]
- Carvedilol. In: The United States Pharmacopoeia, 44nd Rev., and the National Formulary, 39th ed., Rockville, M.D.: United States Pharmacopoeial Convention Inc.; 2021.
- Carvedilol. In: British Pharmacopoeia 2021. London: The Stationary Office, British Pharmacopoeia Commission Office; 2021.
- Carvedilol. In: European Pharmacopoeia 10.0. Strasbourg, France: European directorate for the Quality of Medicines and HealthCare of the Concil of Europe; 2019.
- Rao LSS, Madhavan P, Prakash KV. Development and validation of stability indicating method for the quantitative determination of carvedilol and its related impurities in pharmaceutical dosage forms using RP HPLC. J Chem Pharm Res 2015;7(9):144-54.
- Ciobanu AM, Pop AL, Crişan SI, Pali M, Burcea-Dragomiroiu GT, Popa DE, et al. HPLC studies for assessing the stability of carvedilol tablets. Farmacia 2017;65(4):523-31.
- Mahajan N, Deshmukh S, Farooqui M. Analytical method development and validation for known and unknown impurities profiling for carvedilol pharmaceutical dosage form (Tablets). Int J Curr Pharm Res 2021;13(6):71-80.
- Rao UV, Haritha G, Krishnaiah T, Saikiran TG, Reddy TA, Nikhil US, et al. Method development and forced degradation studies of carvedilol by RP-HPLC. Int J Pharm Anal Res 2017;6:457-68.
- Ware AL, Pekamwar SS. development and validation of bioanalytical RP-HPLC method for determination of carvedilol and development and validation of RP-HPLC method for determination of carvedilol in bulk drug and formulation. Indo-Am J Pharm Res 2020;10(12):1474-501.
- Sajan PG, Rohith T, Patil S, Mantelingu K, Rangappa KS, Kumara MN. Rapid, Highly efficient and stability indicating RP-UPLC method for the quantitative determination of potential impurities of carvedilol active pharmaceutical ingredient. Int J Pharm Pharm Sci 2014;6(10):214-20.
- Nadella NP, Ratnakaram VN, Srinivasu N. Development and validation of UPLC method for simultaneous quantification of carvedilol and ivabradine in the presence of degradation products using DoE concept. J Liq Chromatogr Rel Technol 2018;41(3):143-53.
- Jouyban A, Hasanzadeh M, Shadjou N. Non-aqueous electromigration analysis of some degradation products of carvedilol. Iran J Pharm Res 2014;13(2):471-86.
[Google Scholar] [PubMed]
- Guideline IH. Validation of analytical procedures: Text and methodology. Q2 (R1). 2005;1(20):05.
- Stojanović J, Marinković V, Vladimirov S, Veličković D, Sibinović P. Determination of carvedilol and its impurities in pharmaceuticals. Chromatographia 2005;62:539-42.