- *Corresponding Author:
- G. Gonzalez De La Cruz
Departamento de Física, CINVESTAV-I.P.N. Apartado Postal 14-740, 07000
E-mail: bato@fis.cinvestav.mx
| Date of Submission | 13 November 2019 |
| Date of Revision | 16 December 2019 |
| Date of Acceptance | 15 January 2020 |
| Indian J Pharm Sci 2020;82(2):47-58 |
This is an open access article distributed under the terms of the Creative Commons Attribution-NonCommercial-ShareAlike 3.0 License, which allows others to remix, tweak, and build upon the work non-commercially, as long as the author is credited and the new creations are licensed under the identical terms
Abstract
In this investigation, quantum dots of cadmium sulfide semiconductor crystals capped with dextrin and bioconjugated with doxorubicin were used to target and provide imaging of HeLa cells, which play a critical role in cervical cancer. These dextrin-capped cadmium sulfide nanoparticles/semiconductor quantum dots bioconjugated with doxorubicin are in the range of 5 nm in size and exhibit an intense fluorescence emission in the green and red spectrum, which benefited fluorescence imaging on HeLa cells. Results obtained showed that dextrin-capped cadmium sulfide nanoparticles/semiconductor quantum dots bioconjugated with doxorubicin have a large accumulation time in cells distributed in the cytoplasm and nucleus, where the pharmacological effects of drugs are enhanced. Cells treated with dextrin-capped cadmium sulfide nanoparticles/semiconductor quantum dots bioconjugated with doxorubicin also showed a major increase in size, including cytoplasm and nucleus, as compared to cells treated with doxorubicin alone. Additionally, binucleated cells and membrane blebbing was also found. Therefore, dextrin-capped cadmium sulfide nanoparticles/semiconductor quantum dots bioconjugated with doxorubicin could be used as probes for simultaneous cell cancer-targeted fluorescent imaging, tracking and monitoring cell viability with the advantage of improving the clinical effects of antineoplastic drugs with increasing apoptosis.
Keywords
Semiconductor quantum dots, bioconjugation, doxorubicin, cytotoxicity, apoptosis
Due to the tremendous progress in organic synthesis and physical chemistry, it is now possible to design and elaborate nanoparticle systems with a large surface to volume ratio and a better surface to improve the attachment of ligands such as biopolymers, antibodies and peptides with useful applications in biotechnology and medicine. In biomedicine, nanoparticles can be potentially employed as a tool for early diagnosis and innovative modes of drug delivery. The potential medical applications of nanoparticles are in the fields of imaging, therapy and nano diagnostics. These can also carry luminescent target ligands to get better imaging to monitor pharmacological effects [1].
In the nanoparticle world, semiconductor quantum dots (QDs) are brightly luminescent nanoparticles now emerging as a new class of fluorescent labels; these have found numerous applications in bioimaging, biodiagnosis and drug delivery. Electrons in QDs satisfy the Schrodinger Eqn and then, their energy levels are quantized with values and spacing that depend on the geometry of the QDs. Excitons are generated in the QDs due to light absorption and the electron-hole pair recombination produce emission peaks at different wavelengths, tuning the size and shape. Due to exceptional photostability, broad absorption and narrow emission bands, QDs are seen as an ideal substitution to organic fluorophores. Furthermore, functionalized QDs are useful and can be modified with a variety of biomolecules and small biological polymers, besides enhancing their bioactivity; it is possible to decrease their side effects. Because of these characteristics, QDs can be effectively bound to target cell membranes, turning these into excellent probes for detection, diagnosis, imaging of cells and delivery of therapeutic agents [2-4].
QDs carried out in aqueous solution may be covalently coupled to several biomolecules to be used as sensitive tools for biological targets [5]. This could be attained using accepted bioconjugation procedures [6]. In particular, the conjugation of biomolecules is required for imaging and photodynamic therapy of cancer [7]. Of these biomolecules, doxorubicin (DOX) has been used as a targeting agent against positive cancer cells in imaging and therapy.
DOX is an anthracycline composed of a flat tetracyclic ring (rings a, b, c and d) and variable side chains, including an amino sugar. It is well known that DOX inhibits tumor cell multiplication via several cellular effects and the intercalation between DNA bases due to the anthracycline planar structure are among the most important; this leads to topological changes involving the inhibition of DNA, RNA and protein synthesis [8]. It also acts by DNA intercalation, where the molecule is preferentially intercalated at guanine-cytosine base pairs sites, and the formation of this complex activates the response to DNA damage, thus inducing cell death [9]. Besides that, it induces the formation of reactive oxidative species (ROS) that affect cell membranes by binding to certain proteins and phospholipids [10].
Stimuli-responsive external parameters used as triggers have been reported using X-ray [11,12], pH [13], nearinfrared light and temperature gradients [14]. However, the clinical applications of free DOX are restricted because it often causes severe damage to normal cells and healthy tissues during treatment and eventually to systemic immunity. To overcome this problem, various delivery systems of DOX have been designed in order to improve the efficacy through controlled drug release, targeting and significantly reduce toxicity as compared to free DOX. Among the different materials in use, nanomaterials have emerged as potential drug delivery carriers to treat many common human cancers. Literature reported several DOX-based nanoparticles in use as drug delivery systems, including calcium carbonate nanocrystals [15], polymeric nanoparticles [13], zinc oxide quantum dots [16] (which dissolve in acid conditions and present less toxic effects), bi-functionalized indium phosphide/zinc sulfide QDs [17], carbon nanoparticles [18], nanoparticle core-shell cadmium selenide/zinc sulfide [19], plasmonic microgels of gold nanorods [20], semiconductor cadmium telluride quantum dots coated with modified silica nanoparticles [21], multifunctional core-shell ferric oxide/gold nanoparticle [22] and nanodiamonds [23].
In recent years, our research group had synthetized cadmium sulfide semiconductor QDs in aqueous solution using dextrin as a capping agent (CdS-Dx/QDs) [24]. Those QDs were analyzed to determine toxicity in animals and cells. These authors showed that the CdS-Dx/QDs are toxic in a dose-dependent manner and that cell distribution differed between studied cell lines. Therefore, CdS-Dx/QDs appear to possess attractive properties for biological processes associated with the labeling and imaging of clinical and pharmacological applications.
The main purpose of this work was to bioconjugate the CdS-Dx/DOX QDs and carry out optical characterization of these QDs with different techniques, as well as screen pharmacological effects on cells. The results obtained showed that CdS-Dx/QDs bioconjugated with DOX (CdS-Dx/DOX QDs) are mostly distributed in the cytoplasm and nucleus of the cells, where the pharmacological effects of drugs are enhanced. In addition, it was also noted that the pharmacological evaluation of cells treated with CdS-Dx/DOX QDs showed a major increase in size, including cytoplasm and nucleus, as compared to cells treated with DOX alone. Furthermore, binucleated cells and membrane blebbing was found. For these reasons, CdS-Dx/ DOX QDs could be used as probes for simultaneous cell cancer-targeted fluorescent imaging, tracking and monitoring cell viability while advantageously improving the clinical effects of antineoplastic drugs. Finally, it is worth mentioning that CdS-Dx/DOX QDs represented a new type of nanoparticles for application in biomedicine as compared to those reported by Granada-Ramirez et al. recently [25].
Materials and Methods
Cadmium chloride (CdCl2, 99.999 % pure), potassium hydroxide (KOH, semiconductor grade), ammonium nitrate (NH4NO3, 99.999 % pure), thiourea (CS(NH2)2, 99 % pure), sodium hydroxide (NaOH, 99 % pure), dextrin ((C6H10O5)n, 99 % pure) 1,1–carbonyldiimidazole ((C3H3N2)2CO, 97 % pure), tetrahydrofuran (C4H8O, 99.9 % pure) and DOX hydrochloride (C27H29NO11·HCl, 98.0-102.0 % pure) were all purchased from Sigma- Aldrich. Dilute aqueous solution of 1 M sodium hydroxide (NaOH) was used to control the pH of the synthesis and in the bioconjugation process at buffering the carbonates pH 9 (0.1 M) was employed. Finally, deionized water was used as the solvent.
Synthesis of the DOX conjugated CdS-Dx/QDs:
Colloidal CdS-Dx/QDs were produced by chemical synthesis process via aqueous solutions, CdCl2 (0.02 M), KOH (0.5 M), NH4NO3 (0.5 M) and CS(NH2)2 (0.2 M) were mixed and heated at 70º. Dextrin was used as a capping agent at 2 % concentration. In order to control the formation of the QDs during the synthesis of the CdS-Dx/QDs, these solutions were added in a balloon flask and adjusted to pH 11 by adding drops of 1M NaOH solution, maintaining 75° temperature with stirring, for 40 min. After the synthesis, the yellow precipitate was centrifuged at 18 000 rpm for 30 min. Subsequently the yellow precipitate was washed 6 times with deionized water and acetone and finally dried at 40º for 24 h.
Bioconjugation technique:
QDs conjugation with biomolecules could be carried out by electrostatic binding, direct covalent crosslinking attached on the surface of the CdSDx/ QDs. Bioconjugation technique involved the chemical reaction of one unique functional group with another, resulting in the creation of a covalent bond. Consequential bioconjugation with an amine group surrounding compound produced a carbamate bond.
Formation of the CdS-Dx/DOX QDs was carried out by dispersing 1 mg of freshly prepared CdS-Dx/QDs suspended in 10 % THF containing carbonyldiimidazole (CDI) at a concentration 0.1 M and mixing for several minutes. Then, 10 μg/ml of DOX was added and the mixture were stirred for 12 h; the reddish solution was centrifuged at 18 000 rpm for 30 min. The pellets were washed with fresh buffer and the CdS-Dx/DOX QDs were dried at 37º for 12 h.
Optical characterization of CdS-Dx/DOX QDs:
The X-ray diffraction (XRD) pattern provides information about the structure and size of the crystalline CdS-Dx/DOX QDs, which was determined on an X-ray diffractometer (Siemens D5000, Cu Kα radiation). The particle size and morphology were characterized using high resolution transmission electron microscope (HRTEM, model JEM-ARM200CF) of 80-200 KeV electron beam energy equipped with a cold field emission gun couple module. The hydrodynamic diameter distributions of the CdS-Dx/DOX QDs was performed on a dynamic light scattering (DLS, model Nanotrac Wave, Microtrac Inc., USA) The Fourier- Transform-Infrared spectroscopy (FTIR) is a method to determine the linkage of the DOX molecule on the CdS-Dx/QDs in the bioconjugation technique. The spectrum was recorded on a FTIR spectrometer (Model Nicolet 6700, ThermoScientific) and transmission bands in the range of 400-4000 cm-1 wavelengths with 180 sec scanner time.
Cell culture and cell viability assays:
HeLa (cervix adenocarcinoma) cell lines (ATCC, USA) were cultured in DMEM (Gibco, USA), with 10 % FBS (Gibco, USA) and 100 U/ml penicillin/100 μg/ ml streptomycin (Gibco, USA), in a humidified 5 % CO2 atmosphere at 37°. Cell viability assay measured cell proliferation rate and conversely, when metabolic events led to apoptosis or necrosis. HeLa cells were plated in a 96-well plate (10,000/well) and kept for 24 h at 37º and 5 % CO2. Medium was changed with fresh one complemented with different concentrations of QDs alone or bioconjugated with DOX (0.01, 0.1, 1, and 10 μg/ml) and kept alive for 24 h. After treatment, the medium was gently replaced with 20 μl methyl tetrazolium (MTT, 5 mg/ml) and 150 μl of medium and kept at 37o for 4 h. Medium was replaced by the addition of 200 μl DMSO and 25 μl Sorensen’s glycine buffer (glycine 0.1 M, NaCl 0.1 M, pH 10.5). Cell viability was determined by measuring optical absorbance on a microplate reader (Bio-Rad) at 590 nm [26]. Untreated cells served as control. The data showing the relative viability of cells vis-à-vis the untreated control were expressed as percent.
Cell cycle:
The growth and division during the cell cycle phases were analyzed using a FACS Calibur flow cytometer (Becton Dickinson) and CELLQuest software. For cell cycle analysis, 105 cells were treated with 1 μg/ml of CdS-Dx, DOX or CdS-Dx/DOX QDs during 24 h. After this period, cells were washed with PBS and fixed with 80 % ethanol for 24 h. Cells were washed again and re-suspended in 0.1 % Nonidet P40 and 10 μg/ml DNase-free RNase. Then cells were incubated with PI (5 mg/ml) for 12 h at 4o in the dark. On order to get images of cell cycle arrest, the cells were processed as described above.
Visualization of the fluorescence of CdS-Dx/DOX QDs in HeLa cells:
HeLa cells were employed to confirm the selective absorption of CdS-Dx/QDs alone as well as bioconjugated with DOX. The cells (50 000/well) were placed on a sterile coverslips in a 12-multiwell.
The cells were incubated for 24 h, rinsed with buffer solution and then treated with CdS-Dx/QDs (0.01, 0.1 and 1 μg/ml) for 24 h. After rinsing with cold buffer solution, the cells were set for 20 min in 200 μl of 4 % paraformaldehyde. Cells were later rinsed again with buffer solution. Set cells were protected with a glass slide with 50 % glycerol/PBS (v/v) and studied on a confocal microscope (Nikon Al, Nikon, Japan). QDs were stimulated with a 488 nm laser, and their waves were collected at 680 nm. In order to investigate the cellular absorption of CdS-Dx/DOX QDs, cells were observed under fluorescence microscopy.
Pharmacological effects of CdS-Dx QDs bioconjugated with DOX in HeLa cells:
HeLa were used to verify the selective uptake of CdSDx/ QDs alone and bioconjugated with DOX. The cells (1×10⁵) were seeded on 12 mm sterile coverslips in a 6-well plate. The cells were cultured for 24 h, washed thrice with PBS and then incubated with CdS-Dx/QDs (1 and 10 μg/ml) for 24 h. After washing thrice with cold PBS, the cells were fixed for 20 min in 200 μl of 4 % paraformaldehyde. After some time, the cells were washed again with PBS buffer. The coverslip with fixed cells was covered with a glass slide with a drop of 10 μl of 50 % glycerol/PBS (v/v) and placed above the objective on a confocal microscope. CdSDx/ QDs were stimulated with a 488 nm laser and their waves were collected at 680 nm. In order to measure the pharmacological effect of CdS-Dx/DOX QDs, the coverslip with fixed cells was observed under fluorescence microscopy and analyzed using the Image-Pro Insight 9 software (Media Cybernetics Inc.). For the analysis of cell cycle, 105 cells were treated with 1 μg/ml of CdS-Dx, DOX or CdS-Dx/DOX QDs during 24 h. After some time, cells were washed with PBS and fixed with 80 % ethanol for 24 h. Cells were washed again and re-suspended with Nonidet P40 (0.1 %) and DNase-free RNase (10 μg/ml). Then cells were incubated with PI (5 mg/ml) for 12 h at 4° in the dark. Cell cycle phases were analyzed using a FACS Calibur flow cytometer and CELLQuest software.
Statistical analysis:
Results were expressed as mean±standard deviation of 3 determinations. Results were statistically analyzed using the SPSS 10.0 program (SPSS Inc., Chicago, Ill., USA), the student t test, and ANOVA. Variances were considered significant if the P-value was less than 0.05.
Results and Discussion
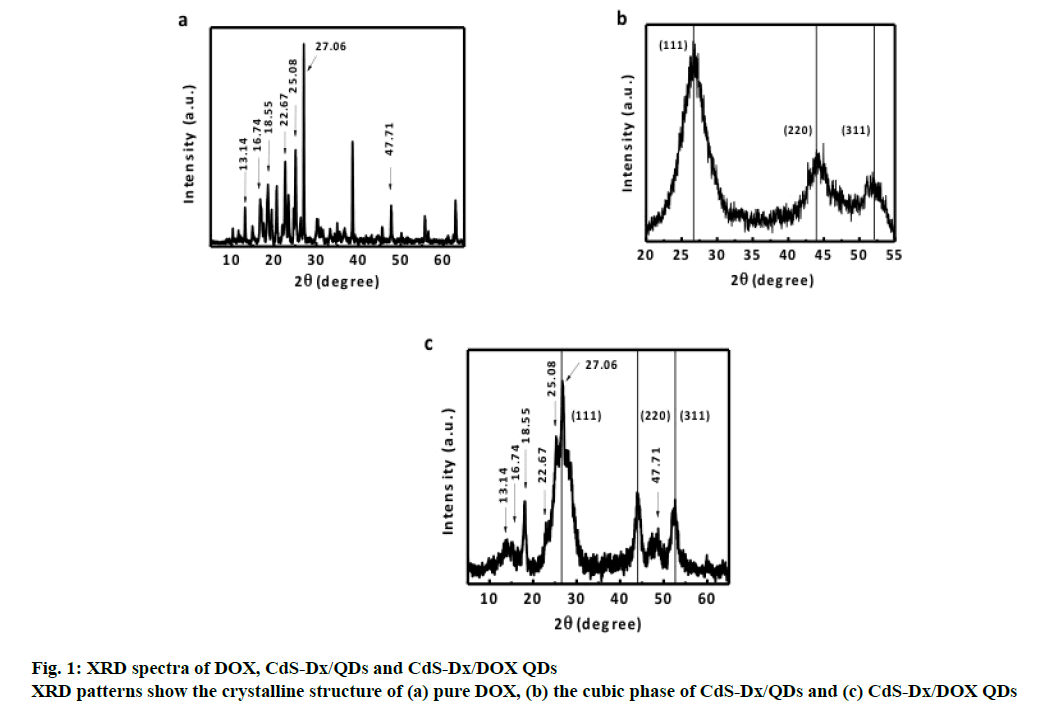
The XRD spectrum of pure DOX (figure. 1a) is characterized by sharp diffraction peaks at different values of 2θ, which could be indexed to scattering from different planes associated with the branched nature of DOX [15]. The XRD spectrum of the CdSDx/ QDs shown in figure. 1b, exhibited prominent broad peaks at 2θ values of 26.5º, 44º and 52.13º, which were consistent with the diffraction peaks of CdS planes in cubic phase. The same characteristic peaks can also be found in the spectrum of CdS-Dx/DOX QDs in fig. 1c. Semiconductor nanoparticle size can be quantitatively evaluated from the XRD data [24]. The average particle size CdS-Dx/DOX QDs from the diffraction peak (111) was found to be about 5 nm. It suggested that the crystalline structure of CdS nanoparticles is not altered after the conjugation of CdS-Dx/DOX QDs. The peaks corresponding to the reflection plane around 2θ=13.14°, 16.74°, 18.55°, 22.67°, 25.08°, 27.06° and 47.71° are predominantly attributed to the presence of DOX molecule. These XRD results provided evidence to the presence of DOX on CdS-Dx/QDs after conjugation.
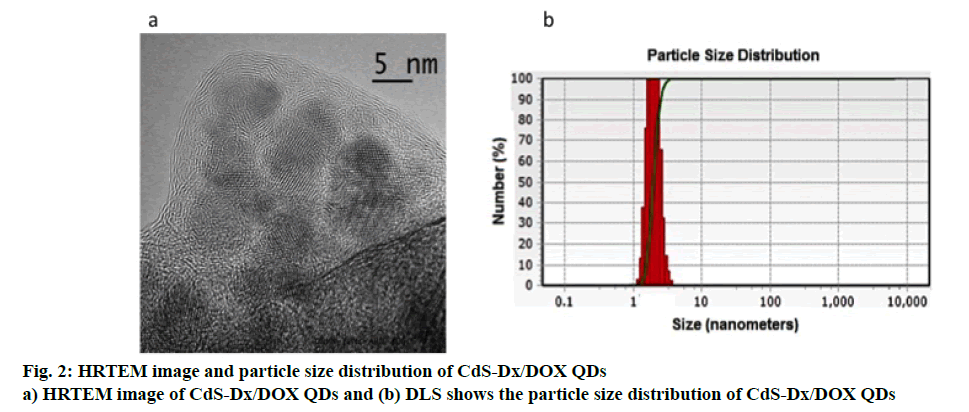
A typical HRTEM image of the CdS-Dx/DOX QDs is given in figure. 2a. The image clearly showed that the nanoparticles presented good uniformity in size and shape, in addition to revealing that the conjugated nanoparticles with DOX presented good dispersion, spherical morphology and that their average diameter was estimated to be in the range of 5 nm. Figure. 2b shows the hydrodynamic diameter distributions of CdS-Dx/ DOX QDs measured by DLS and depicts an average diameter of 5 nm with relatively narrow distribution, which is consistent with the findings from XRD and HRTEM.
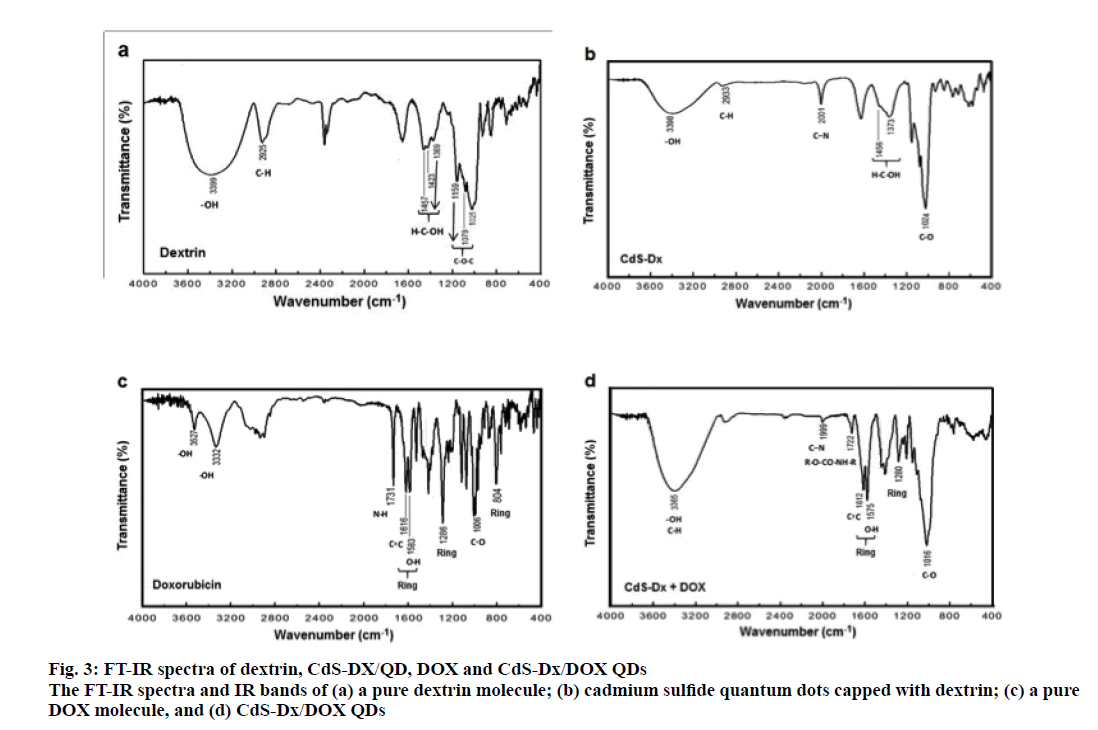
The FTIR spectrum of dextrin with the main peaks identified by arrows is shown in figure. 3a. For pure dextrin, the peak at 3399 cm-1 is due to the stretching vibrations of O-H; a small peak at 2925 cm-1 is attributed to the C-H stretching vibrations. The peaks at 1457, 1423 and 1369 cm-1 are associated to H-C-OH δ vibrations, and the bands at 1159, 1079 and 1025 cm-1 are assigned to C-O-C stretching vibrations. Similar results have been reported by Pedroi [27]. The FTIR spectrum of the CdSDx/ QDs (figure. 3b) exhibited the same line positions as in figure. 3a, except that there was an additional peak as compared to pure dextrin at 2001 cm-1 due to C-N stretching vibration as a consequence of the thiourea used in the synthesis of the CdS nanoparticles. The FTIR spectrum of pure DOX (figure. 3c) showed peaks at 3527 and 3332 cm-1 due to the O-H stretching vibrations. The absorption band at 1731 cm-1 is assigned to the N-H bending vibrations for the primary amine structure; bands at 1616 and 1583 cm-1 are designed to the stretching vibrations of 2 carbonyl groups of the anthracene ring; bands at 1286 and 804 cm-1 are due to the skeleton vibration of the DOX molecule [28,29]. The FTIR spectrum of CdS-Dx/DOX QDs (figure. 3d) showed a broad peak at 3365 cm-1 as a result of the O-H and C-H overlap stretching vibrations. The absorption band observed at 1722 cm-1, showed evidence CdS-Dx/ QDs modification during the bioconjugation process with DOX, as explained in the synthesis section; the peak at 2001 cm-1 in CdS-Dx/QDs decreases in intensity as compared to the conjugated CdS-Dx/QDs FTIR spectrum. These FTIR results suggested that the attachment of DOX to the CdS-Dx/QDs occurred via the interaction of amine groups of the DOX with the carbonyliimidazolide derived from primary amine activator in situ with a nucleophile such as OH groups of CdS-Dx/QDs, providing the corresponding carbamate. DOX is one of the most common therapeutic agents used as a research tool in cancer research. For this reason, it remains as one the most employed drugs to prepare conjugates with nanomaterials. Additionally, because it has the advantage of being easily monitored in the cells, its pharmacological effects can be quickly evaluated using in vitro models. Here, in order to evaluate the effect of CdS-Dx/DOX QDs, HeLa cells were treated at a concentration of 1 and 10 μg/ml of CdS-Dx QDs according to previous reports [24,30,31].
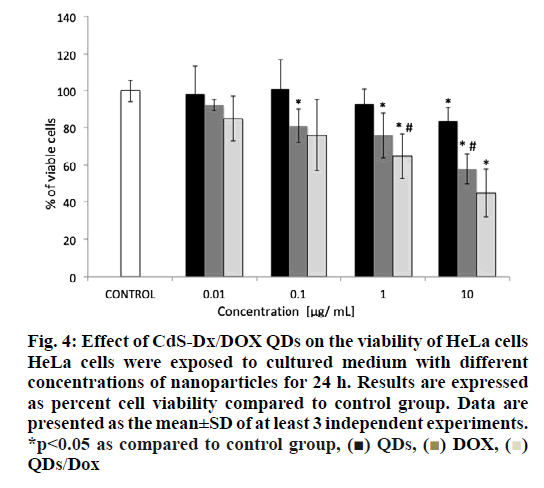
The analysis of cell viability showed that those cells treated with CdS-Dx/DOX QDs and DOX alone showed a high mortality at a dose of 1 μg/ml (figure. 4). It was found that cells treated with 1 μg/ml DOX reduced cell viability by 28 % whereas cells treated with CdS-Dx/DOX QDs reduced viability by 38 % (p<0.05). However, cells treated with DOX alone and the conjugate (10 μg/ml), cell viability was reduced by 42 and 55 %, respectively (p<0.05). Cells treated with non-conjugated QDs allowed for lower viability (17 %) with a 10 μg/ml concentration as compared to control cells, but this was not statistically significant.
Figure 4: Effect of CdS-Dx/DOX QDs on the viability of HeLa cells HeLa cells were exposed to cultured medium with different concentrations of nanoparticles for 24 h. Results are expressed as percent cell viability compared to control group. Data are presented as the mean±SD of at least 3 independent experiments. *p<0.05 as compared to control group, (■) QDs, (■) DOX, (■) QDs/Dox
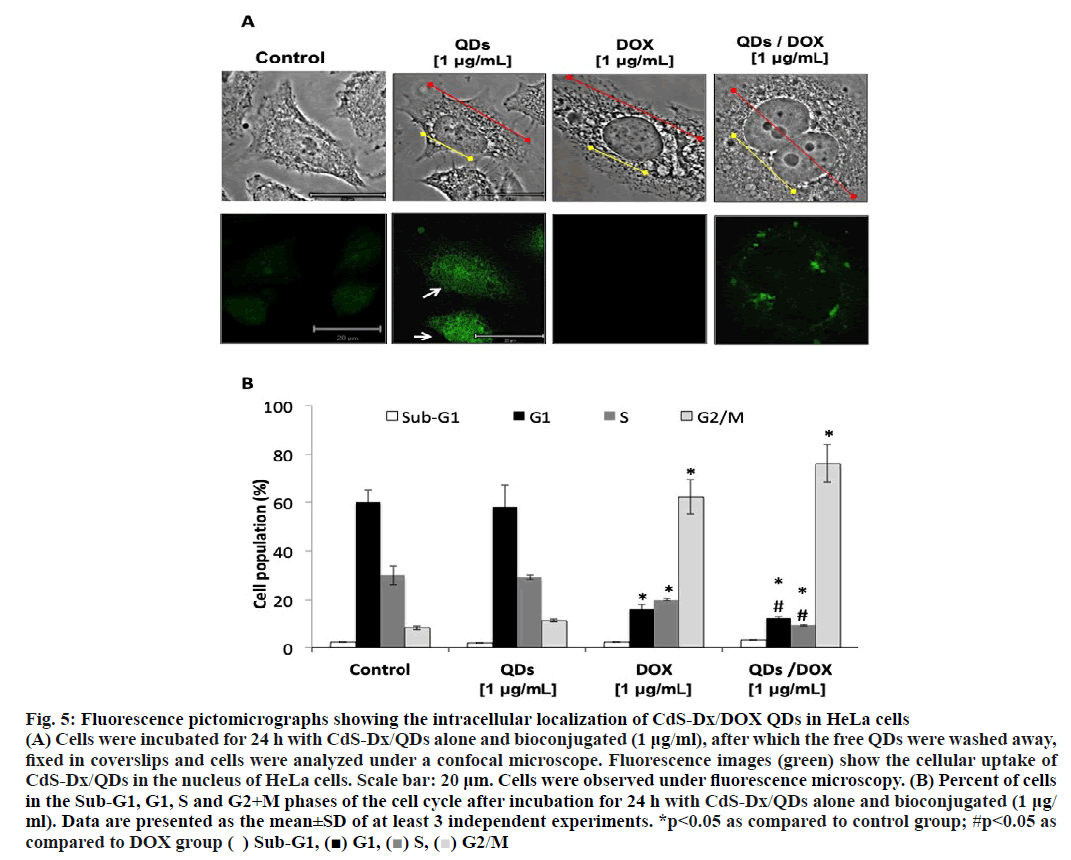
The fluorescence emission from CdS-Dx/QDs would allow observing the absorption and distribution of CdSDx/ DOX QDs directly in HeLa cells. CdS-Dx/QDs absorption and distribution experiments were visualized under a confocal laser fluorescent microscope. For this, cells were treated with 1 μg/ml concentration of CdSDx/ QDs or DOX or CdS-Dx/DOX QDs for 24 h and then rinsed to eliminate any free QDs in conditioned media. Figure. 5A showed that those cells treated with 1 μg/ml DOX and CdS-Dx/QDs conjugated with DOX increased in size, including cytoplasm and nucleus (shown by red and yellow arrows. Besides that, the presence of binucleated cells was also observed). The fluorescence signal was mostly seen in the nucleus in those cells treated only with CdS-Dx/QDs (white arrow). It was not observed in the case of HeLa cells treated with DOX. In cells treated with CdS-Dx/DOX QDs the fluorescence was observed mainly in cytoplasm and in lesser amounts, in nucleus. The changes in the morphology of those cells treated with DOX alone and CdS-Dx/DOX QDs was clearly evident. No apparent decrease in fluorescence brightness was observed under unceasing excitation over the span of 20 min, demonstrating the high photostability of CdS-Dx/QDs, both alone and conjugated.
Figure 5: Fluorescence pictomicrographs showing the intracellular localization of CdS-Dx/DOX QDs in HeLa cells
(A) Cells were incubated for 24 h with CdS-Dx/QDs alone and bioconjugated (1 μg/ml), after which the free QDs were washed away,
fixed in coverslips and cells were analyzed under a confocal microscope. Fluorescence images (green) show the cellular uptake of
CdS-Dx/QDs in the nucleus of HeLa cells. Scale bar: 20 μm. Cells were observed under fluorescence microscopy. (B) Percent of cells
in the Sub-G1, G1, S and G2+M phases of the cell cycle after incubation for 24 h with CdS-Dx/QDs alone and bioconjugated (1 μg/
ml). Data are presented as the mean±SD of at least 3 independent experiments. *p<0.05 as compared to control group; #p<0.05 as
compared to DOX group ( ) Sub-G1, (■) G1, (■) S, (■) G2/M
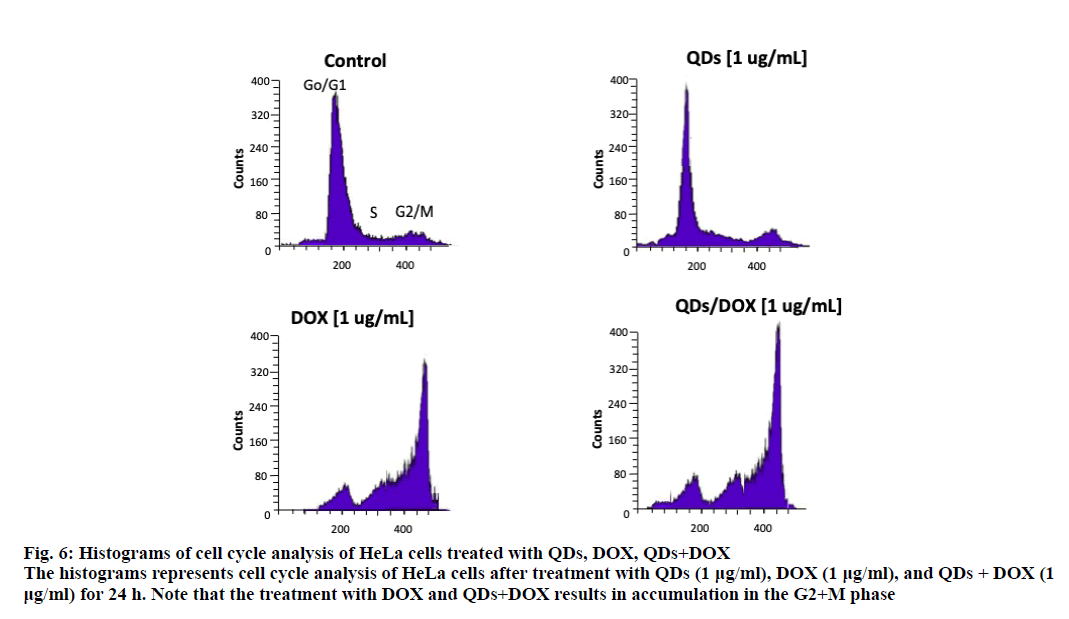
An analysis of the cell cycle revealed that CdS-Dx/ QDs (μg/ml) did not produce changes during any phase (figure. 5B and figure. 6). However, those cells treated with DOX showed arrest in the G2+M phase with a reduction in the G and S phases (p<0.05). A similar effect was observed in cells treated with CdS-Dx/DOX QDs; even the cell population in the G2+M phase was higher (p<0.05).
Figure 6: Histograms of cell cycle analysis of HeLa cells treated with QDs, DOX, QDs+DOX
The histograms represents cell cycle analysis of HeLa cells after treatment with QDs (1 μg/ml), DOX (1 μg/ml), and QDs + DOX (1
μg/ml) for 24 h. Note that the treatment with DOX and QDs+DOX results in accumulation in the G2+M phase
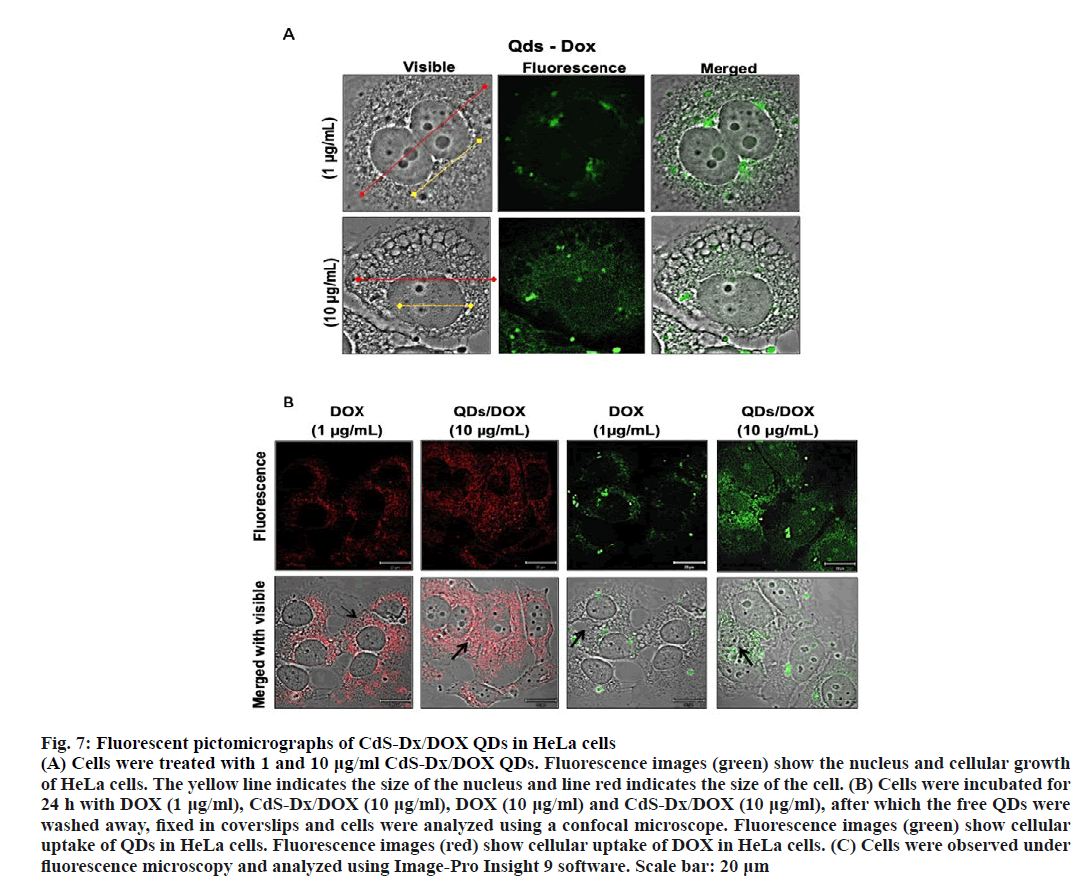
With a view to observe the pharmacological effects CdS-Dx/DOX QDs in HeLa cells the concentration of CdS-Dx/DOX QDs was increased. Cells treated with 10 μg/ml CdS-Dx/DOX QDs showed higher sizes (in cell and nucleus) and, in addition, there were multiple cells that showed membrane blebbing (figure. 7A). Fluorescence was more intense in these than those treated with 10 μg/ml of CdS-Dx/QDs and was even observed inside the nucleus. On one hand, the intense red emission of CdS-Dx/DOX QDs in the length 600-800 nm makes it appropriate for visualization and ensures cellular absorption of DOX. In figure. 7B the presence of DOX in the cells can be observed under light radiation at 680 nm. It was evident that the intensity of light emission was higher when the concentration of CdS-Dx/DOX QDs increased. Additionally, cells treated with CdSDx/ DOX QDs showed a distribution of DOX in both cytoplasm and nucleus, whereas in cells treated only with DOX showed concentrations mostly in cytoplasm and not in nucleus. Therefore, cells treated with 10 μg/ml of CdS-Dx/DOX QDs showed clear data of growth arrest and apoptosis. This study considered the benefits of the optical properties of CdS-Dx/QDs and their lack of toxicity at lower concentrations [24], along with the bioconjugation of these CdS-Dx/QDs with DOX to produce nanovehicles for drug distribution in HeLa cells.
Figure 7: Fluorescent pictomicrographs of CdS-Dx/DOX QDs in HeLa cells
(A) Cells were treated with 1 and 10 μg/ml CdS-Dx/DOX QDs. Fluorescence images (green) show the nucleus and cellular growth
of HeLa cells. The yellow line indicates the size of the nucleus and line red indicates the size of the cell. (B) Cells were incubated for
24 h with DOX (1 μg/ml), CdS-Dx/DOX (10 μg/ml), DOX (10 μg/ml) and CdS-Dx/DOX (10 μg/ml), after which the free QDs were
washed away, fixed in coverslips and cells were analyzed using a confocal microscope. Fluorescence images (green) show cellular
uptake of QDs in HeLa cells. Fluorescence images (red) show cellular uptake of DOX in HeLa cells. (C) Cells were observed under
fluorescence microscopy and analyzed using Image-Pro Insight 9 software. Scale bar: 20 μm
The cellular effects induced by DOX can be easily monitored because this molecule emits fluorescence in the red region. The cell distribution study under fluorescence microscopy monitored cell fluorescence in cells treated with DOX alone and those with CdSDx/ DOX QDs. The fluorescence emitted by DOX evidenced that this molecule located itself mostly in cytoplasm but not in nucleus (red fluorescence), whereas cells treated with CdS-Dx/DOX QDs showed distribution across cytoplasm and nucleus. Abdullahi- Kamba et al. observed something similar when treating osteosarcoma cells (MG63) with CaCO3 nanocrystals conjugated with DOX: strong fluorescence in the cytoplasm and nucleus, and a time-dependent cell distribution [15]. In this investigation incubation time was not modified, but augmentation of fluorescence was observed with increasing the concentration of CdSDx/ DOX QDs, which suggested that in order to reach the nucleus and exert a pharmacological effect; DOX concentration must be necessarily increased.
Contrary to that [32], HEK293 cells treated with DOX functionalized gold nanoparticles showed that when cells were treated with DOX alone, it concentrated only in the nucleus, while in cells treated with Au- DOX nanoparticles DOX was only distributed in the cytoplasm. These differences could be due to the fact that polymorphic nanoparticles were produced with a size ranging between 2 to 70 nm and perhaps the nanoparticle size and morphology could influence the entry of Au- DOX nanoparticles into the nucleus. In this study CdSDx/ DOX QDs used had an average size of 5 nm and intense fluorescence could be observed in the nucleus. Perhaps size facilitated the entry into the nucleus. Some reports using small nanoparticles have demonstrated successful entry of nanoparticles bioconjugated with DOX into different cells, even reaching the nucleus [33-37]. However, other studies that have employed larger nanoparticles conjugated with DOX use facilitators in order to help the drug penetrate more easily into the nucleus to induce pharmacological effects [37-39]. They can likewise modify the physicochemical properties of QDs to facilitate DOX release [40]. The present research demonstrated that CdS-Dx/DOX QDs exhibit advantageous physicochemical and optical properties (disperse, stable and small in size) as compared to other nanomaterials. These additionally have the potential to be employed as efficient nano transporters for drug delivery because they readily allow DOX release at the desired site, the nucleus.
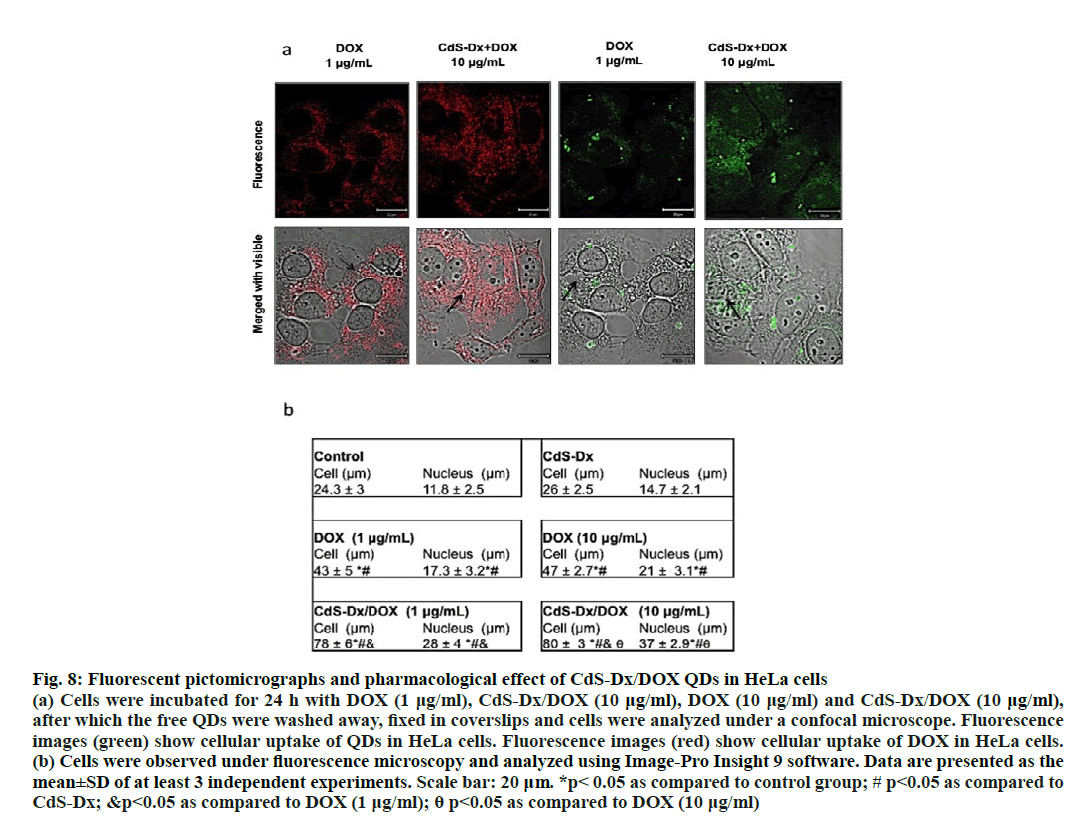
Present results showed that cells treated with CdSDx/ DOX QDs had an increase in size in both cell and nucleus and binucleated cells were also observed. One of the mechanisms of action of DOX is the induction of protein p53 expression, which in turn stops the cell cycle in phase G1 or G2/M. Arrest in those phases induces an increase in cell size because cells are stopped in their growth phases and this effect has been observed with nanoparticles conjugated with DOX [41,42]. It was shown in the current investigation that cells treated with DOX and CdS-Dx/DOX QDs were bigger as compared to control cells. This means that DOX probably induced cell cycle arrest. Interestingly, though, those cells treated with CdS-Dx/DOX QDs showed the typical characteristics of the onset of apoptosis (surface smoothing and surface blebbing, (figure. 7A). Previous studies using DOX-conjugated nanoparticles have shown that the cytotoxic effect of DOX is preserved and capable of inducing both apoptosis and necrosis in different cell lines [43-46]. On the other hand, other studies have explained that QDs-based distribution of DOX enabled cell expansion and as a consequence, yielded better pharmacological results [44]. Current results agreed with that, the presence of high fluorescence in those cells treated with CdS-Dx/DOX QDs showed an increased accumulation of intranuclear drug that was responsible for the morphological changes, due probably to the arrest of the cell cycle and an increased presence of apoptosis versus free DOX (figure. 8a and 8b).
Figure 8: Fluorescent pictomicrographs and pharmacological effect of CdS-Dx/DOX QDs in HeLa cells
(a) Cells were incubated for 24 h with DOX (1 μg/ml), CdS-Dx/DOX (10 μg/ml), DOX (10 μg/ml) and CdS-Dx/DOX (10 μg/ml),
after which the free QDs were washed away, fixed in coverslips and cells were analyzed under a confocal microscope. Fluorescence
images (green) show cellular uptake of QDs in HeLa cells. Fluorescence images (red) show cellular uptake of DOX in HeLa cells.
(b) Cells were observed under fluorescence microscopy and analyzed using Image-Pro Insight 9 software. Data are presented as the
mean±SD of at least 3 independent experiments. Scale bar: 20 μm. *p< 0.05 as compared to control group; # p<0.05 as compared to
CdS-Dx; &p<0.05 as compared to DOX (1 μg/ml); θ p<0.05 as compared to DOX (10 μg/ml)
In summary, CdS-Dx/DOX QDs were synthesized in aqueous solution and experimentally characterized using different optical techniques. The results demonstrated the crystalline structure of DOX and a good dispersion CdS-Dx/QDs with spherical shape and a 5 nm size. In addition, these could exert pharmacological effects in cells. In particular, high mortality was found for cells treated with relatively high concentration of CdS-Dx/ DOX QDs as compared to DOX alone. On the other hand, the intense fluorescence emission from these QDs allows to visualize how the CdS-Dx/DOX QDs are distributed in the cells and to observe the morphological effects. The cellular effects induced by DOX and CdS Dx/DOX QDs were monitored in HeLa cells under fluorescence microscopy with emission of green and red spectrum. In this work it was observed that HeLa cells treated with DOX and CdS-Dx/DOX QDs were larger in both cell size and nucleus as compared to control cells. However, DOX alone was only present in the cytoplasm while CdS-Dx/DOX QDs were found inside cytoplasm and nucleus. Binucleated cells and membrane blebbing were also observed. Consequently, CdS-Dx/ DOX QDs could be used as probes for simultaneous cell-cancer targeted fluorescence imaging, drug nano transportation that might facilitate drug delivery into the cell and the tracking and monitoring of cell viability with the advantage of improving the clinical effects of antineoplastic drugs with increased apoptosis.
Acknowledgments
GGC wishes to thank CONACYT under grant CB2015/254414 for its partial support. The authors also wish to thank Q.F.B. Xochitl Alvarado Affantranger at the National Laboratory of Advanced Microscopy, UNAM.
Competing interests:
The authors declare that they have no competing interests.
Financial interest/Funding:
This research was partially supported by the Consejo Nacional de Ciencia y Tecnología CB2015 (No. 254414 to G.G.).
References
- Vázquez-Hernández F, Granada-Ramírez DA, Arias-Cerón JS, Rodriguez-Fragoso P, Mendoza-Álvarez JG, Ramón-Gallegos E, et al. Use of nanostructured materials in drug delivery, Nanobiomaterials 2018;pp:503-49.
- Smith AM, Duan H, Mohs AM, Nie Sh. Bioconjugated quantum dots for in vivo molecular and cellular imaging, Adv Drug Deliv Rev 2008;60:1226-40.
- Valizadeh A, Mikaeili H, Samiei M, Mussa Farkhani S, Zarghami N, Kouhi M, et al. Quantum dots: synthesis, bioapplications, and toxicity, Nanoscale Res Lett 2012;7:480-94.
- Piktel E, Niemirowicz K, Wątek M, Wollny T, Deptuła P, Bucki R. Recent insights in nanotechnology-based drugs and formulations designed for effective anti-cancer therapy. J Nanobiotechnol 2016;14:39-62.
- Gutiérrez-Sancha I, Reyes-Esparza J, Rodríguez-Fragoso P, Rodríguez-Fragoso L. Pharmacokinetic of maltodextrin coated cadmium sulfide quantum dots in rats. J Nanomed Biother Discovery 2016;6:1-5.
- Hermanson, TG. Bioconjugate Techniques. 2nd ed. Illinois: Elsevier, 2008.
- Biju V, Mundayor S, Omkumar RV, Anas A, Ishikawa M. Bioconjugated quantum dots for cancer research: Present status, prospects and remaining issues. Biotechnol Adv 2010;28:199-213.
- Minotti G, Menna P, Salvatorelli E, Cairo G, Gianni L. Anthracyclines: molecular advances and pharmacologic developments in antitumor activity and cardiotoxicity. Pharmacol Rev 2004;56(2):185-229.
- Pommier Y, Leo E, Zhang H, Marchand C. DNA topoisomerases and their poisoning by anticancer and antibacterial drugs. Chem Biol 2010;17:421-33.
- Stojnev S, Ristić-Petrović A, Janković-Veličković L. Reactive oxygen species, apoptosis and cancer. Vojnosanit Pregl 2013;70:675-8.
- Chen H, Moore T, Qi B, Colvin DC, Helen EK, Hitchcock DA, et al. Monitoring pH-triggered drug release from radioluminescent nanocapsules with X-ray excited optical luminescence. ACS Nano 2013;7:1178-87.
- Starkewolf ZB, Miyachi L, Wong J, Guo T. X-ray triggered release of doxorubicin from nanoparticle drug carriers for cancer therapy. Chem Comm 2013;49:2545-7.
- Meng F, Zhong Y, Cheng R, Guo T. pH-sensitive polymeric nanoparticles for tumor targeting doxorubicin delivery: Concept and recent advances. Nanomedicine 2014;9:487-99.
- Bao Z, Liu X, Liu H, Zhao K. Near-infrared light responsive inorganic nanomaterials for photothermal therapy. Asian J Pharm Sci 2016;11:349-64.
- Abdullahi-Kamba S, Ismail M, Hussein-AL-Ali SH, Ibrahim TAT, Zakaria ZAB. In vitro delivery and controlled release of doxorubicin for targeting osteosarcoma bone cancer. Molecules 2013;18(9) :10580-98.
- Cai X, Luo Y, Zhang W, Du D, Lin Y. pH-sensitive ZnO quantum dots-doxorubicin nanoparticles for lung cancer targeted drug delivery. ACS Appl Mater Interfaces 2016;8:22442-50.
- Ranjbar-Navazi Z, Ezkandani M, Johari-Ahar M, Nemati A, Akbari H, Davaran S, et al. Doxorubicin-conjugated D-glucosamine- and folate- bi-functionalised InP/ZnS quantum dots for cancer cells imaging and therapy. J Drug Target 2018;26:267-77.
- Huang Y, Xie P, Yang Sh-H, Zhang X, Zeng G, Xin Q, et al. Carbon nanoparticles suspension injection for the delivery of doxorubicin: Comparable efficacy and reduced toxicity. Mater Sci Eng C 2018;92:416-23.
- Sangtani A, Petryayeva E, Wu M, Susumu K, Oh E, Huston A L, et al. Intracellularly actuated quantum dot−peptide−Doxorubicin nanobioconjugates for controlled drug delivery via the endocytic pathway. Bioconjugate Chem 2018;29:136-48.
- Wang Y, Wang L, Yan M, Cai A, Dong Sh, Hao J. Plasmonic microgels of Au nanorods: Self-assembly and applications in chemophotothermo-synergistic cancer therapy. J Colloid Interface Sci2019;536:728-36.
- Oliveira E, Santos HM, Jorge S, Rodriguez-Gonzalez B, Novio F, Lorenzo J, et al. Sustainable synthesis of luminescent CdTe quantum dots coated with modified silica mesoporous nanoparticles: Towards new protein scavengers and smart drug delivery carries. Dyes and Pigments 2019;161:360-9.
- Rajkumar S, Prabaharan M. Multi-functional core-shell Fe3O4@Au nanoparticles for cancer diagnosis and therapy. Colloids Surf B Biointerfaces 2019;174:252-9.
- Zhang K, Zhao Q, Qin Sh, Fu Y, Liu R, Zhi J, et al. Nanodiamonds conjugated upconversion nanoparticles for bio-imaging and drug delivery. J Colloid Interface Sci 2019;537:316-24.
- Reyes-Esparza J, Martínez-Mena A, Gutiérrez-Sancha I, Rodriguez-Fragoso P, Gonzalez de la Cruz G, Mondragon R, et al. Synthesis, characterization and biocompatibility of cadmium sulfide nanoparticles capped with dextrin for in vivo and in vitro application. J Nanobiotechnol 2015;13:83.
- Granada-Ramírez DA, Arias-Cerón JS, Rodríguez-Fragoso P, Vazquez-Hernandez F, Luna-Arias JP, Herrera-Perez JL, et al. Quantum Dots for biomedical applications. In: Narayan R (ed) Nanobiomaterials, 1st ed. Elsevier Ltd, 2018. p. 411-36.
- Wang H-Z, Chang Ch-H, Lin Ch-P, Lin Ch-P, Tsai M-Ch, Using MTT viability assay to test the cytotoxicity of antibiotics and steroid to cultured porcine corneal endothelial cells. J Ocul Pharmacol Ther 1996;12:35-43.
- Predoi D. A study in iron oxide nanoparticles coated with dextrin obtained by coprecipitation. Dig J Nanomater Biostruct 2007;2:169-73.
- Li S, Ma Y, Yue X, Cao Z, Dai Z. One-pot construction of doxorubicin conjugated magnetic silica nanoparticles. New J Chem 2009;33:2414-8.
- Das G, Nicastri A, Coluccio MA, Gentile F, Candeloro P, Cojoc G, et al. FTIR, Raman, RRS measurements and DFT calculation for doxorubicin. Microsc Res Tech 2010;73:991-5.
- Zhang P, Kong J. Doxorubicin-tethered fluorescent silica nanoparticles for pH-responsive anticancer drug delivery. Talanta 2015;134:501-7.
- Kumar R, Kulkarni A, Nagesha DK, Sridhar S. In vitro evaluation of theranostic polymeric micelles for imaging and drug delivery in cancer. Theranostics 2012;2:714-22.
- Kumar SA, Peter YA, Nadeau JL. Facile biosynthesis, separation and conjugation of gold nanoparticles to doxorubicin . Nanotechnology2008;19:495101.
- Srivastava A, Amreddy N, Babu A, Panneerselvam J, Mehta M, Muralidharan R, et al. Nanosomes carrying doxorubicin exhibit potent anticancer activity against human lung cancer cells. Sci Rep 2016;6:38541.
- Pi F, Zhang H, Li H, Thiviyanathan V, Gorenstein DG, Sood AK, et al. RNA nanoparticles harboring annexin A2 aptamer can target ovarian cancer for tumor-specific doxorubicin delivery. Nanomedicine 2017;13:1183-93.
- Li JM, Wang YY, Zhao MX, Tan CP, Li YQ, Le XY, et al. Multifunctional QD-based co-delivery of siRNA and doxorubicin to HeLa cells for reversal of multidrug resistance and real-time tracking. Biomaterials2012;33:2780-90.
- Rana S, Shetake NG, Barick KC, Pandey BN, Salunke HG, Hassan PA. Folic acid conjugated Fe3O4 magnetic nanoparticles for targeted delivery of doxorubicin. Dalton Trans 2016;45:17401-8.
- Ma HL, Jiang Q, Han S, Wu Y, Tomshine JC, Wang D, et al. Multicellular tumor spheroids as an in vivo- like tumor model for three-dimensional imaging of chemotherapeutic and nano material cellular penetration. Mol Imagin2012;11:487-98.
- Li J, Liu F, Shao Q, Min Y, Costa M, Yeow EK, et al. Enzyme-responsive cell-penetrating peptide conjugated mesoporous silica quantum dot nanocarriers for controlled release of nucleus-targeted drug molecules and real-time intracellular fluorescence imaging of tumor cells. Adv Healthc Mater 2014;3:1230-9.
- Du W, Yuan Y, Wang L, Cui Y, Wang H, Xu H, et al. Multifunctional bioconjugate for cancer cell-targeted theranostics. Bioconjug Chem . 2015;26:2571-2578.
- Bajwa N, Kumar Mehra N, Jain K, Kumar Jain N. Targeted anticancer drug delivery through anthracycline antibiotic bearing functionalized quantum dots. Artif Cells Nanomed Biotechnol 2016;44:1774-82.
- Augustin E, Czubek B, Nowicka AM, Kowalczyk A, Stojek Z, Mazerska Z. Improved cytotoxicity and preserved level of cell death induced in colon cancer cells by doxorubicin after its conjugation with iron-oxide magnetic nanoparticles. Toxicol In Vitro. 2016;33:45-53.
- Rudnick-Glick S, Corem-Salkmon E, Grinberg I, Margel S. Targeted drug delivery of near IR fluorescent doxorubicin-conjugated poly (ethylene glycol) bisphosphonate nanoparticles for diagnosis and therapy of primary and metastatic bone cancer in a mouse model. J Nanobiotechnol 2016;14:80.
- Zhang M, Xiao B, Wang H, Han MK, Zhang Z, Viennois E, et al. Edible Ginger-derived Nano-lipids Loaded with Doxorubicin as a Novel Drug-delivery Approach for Colon Cancer Therapy. Mol Ther 2016;24:1783-96.
- Vyas D, Lopez-Hisijos N, Gandhi S, El-Dakdouki M, Basson MD, Walsh MF, et al. Doxorubicin-Hyaluronan Conjugated Super-Paramagnetic Iron Oxide Nanoparticles (DOX-HA-SPION) Enhanced Cytoplasmic Uptake of Doxorubicin and Modulated Apoptosis, IL-6 Release and NF-kappaB Activity in Human MDA-MB-231 Breast Cancer Cells. J Nanosci Nanotechnol 2015;15:6413-22.
- Ma H, Liu Y, Shi M, Shao X, Zhong W, Liao W, et al. Theranostic, pH-responsive, doxorubicin-loaded nanoparticles inducing active targeting and apoptosis for advanced gastric cancer. Biomacromolecules 2015;16:4022-31.
- Li M, Liu P, Gao G, Deng J, Pan Z, Wu X, et al. Smac therapeutic peptide nanoparticles inducing apoptosis of cancer cells for combination chemotherapy with doxorubicin. ACS Appl Mater Interfaces. 2015;7:8005-12.
