- *Corresponding Author:
- C. Ma
Department of Gastroenterology, Gastrointestinal Rehabilitation Center, Beijing Rehabilitation Hospital Affiliated to Capital Medical University, Shijingshan, Beijing 100144, China
E-mail: mysicwal@sina.com
| Date of Received | 25 November 2022 |
| Date of Revision | 14 August 2023 |
| Date of Acceptance | 24 January 2024 |
| Indian J Pharm Sci 2024;86(1):100-109 |
This is an open access article distributed under the terms of the Creative Commons Attribution-NonCommercial-ShareAlike 3.0 License, which allows others to remix, tweak, and build upon the work non-commercially, as long as the author is credited and the new creations are licensed under the identical terms
Abstract
Colorectal cancer is a frequent malignancy, so its corresponding behaviors are essential to be understood deeply. This work was developed to explore the impacts of Livin on proliferation, migration, invasion, and epithelial-mesenchymal transition of HT-29 colorectal cancer cells. Colorectal cancer cells were extracted from pathological specimens collected from 80 colorectal cancer patients treated at our institution from June 2017 to June 2022. HT-29 human colorectal cancer cells were undertaken as the research materials. Real-time immunofluorescence polymerase chain reaction, Western blot, cell counting kit-8 experiments, cell scratch assays, and Transwell experiments were performed to assess the proliferation, migration, invasion, and epithelial-mesenchymal transition-related markers of the colorectal cancer cells. Livin expression in colorectal cancer cells increased greatly in contrast to that in healthy cells (p<0.05). Compared to normal HT-29, the overexpression of Livin promoted the proliferation, migration, and invasion abilities of colorectal cancer cells, exhibiting great differences (p<0.05). Moreover, levels of matrix metalloproteinase 2, vimentin, slug, and snail in colorectal cancer cells were sharply upregulated (p<0.05), while that of E-cadherin was remarkably downregulated (p<0.05) in contrast to the conditions in normal cells. The findings in this work revealed the crucial role of Livin in HT-29 colorectal cancer cells, suggesting its potential to be a target for colorectal cancer treatment.
Keywords
Livin, human colorectal cancer cells, HT-29 cells, migration, invasion, epithelial-mesenchymal transition
Colorectal Cancer (CRC) is a frequently seen malignancy of the digestive system, with hundreds of thousands of new cases reported globally each year. It is the second most fatal cancer[1]. Statistics indicate that CRC exhibits an increasing incidence these years, especially in some developed countries and regions such as Europe, North America, and East Asia, where CRC has become a prevalent cancer type, affecting approximately 4 % to 5 % of the population. Research shows that the risk of developing CRC in individuals aged 40 and above increases to 7.7 % to 8.5 %[2]. With the advancement of medical technology, clinical treatment of cancer mainly involves surgery, chemotherapy, and radiotherapy, which can significantly impact the health and well-beings of patients. Long-term chemotherapy can lead to drug resistance, making cancer treatment more complex. Therefore, researchers in the field of cancer treatment have been delving into targeted therapies, and the search for new targets has become a critical aspect of cancer treatment[3,4]. CRC often presents with subtle clinical symptoms in its early stages, leading to a late-stage diagnosis in most patients, resulting in poorer treatment outcomes and higher mortality rates. Hence, researching the etiology of CRC and treatment strategies is of significant importance.
The apoptosis-inhibiting protein Livin is expressed at high levels in various malignancies. Studies have shown that overexpression of Livin can affect cell apoptosis. In CRC patients treated with 5-Fluorouracil (5-FU) and oxaliplatin (FOLFOX), the expression of Livin significantly increases[5]. Livin can also promote the development of malignant tumors by inhibiting the caspase Signaling Pathway (SPW) and the Nuclear Factor- Kappa B (NF-κB) SPW, which regulates the invasion of tumor cells[6]. Additionally, Livin is associated with multiple SPWs, such as the Mitogen Activated Protein Kinase (MAPK)/Extracellular- Signal-Regulated Kinase (ERK) SPW and the Phosphoinositide 3-Kinase (PI3K)/Protein Kinase B (AKT) SPW, and can modulate the proliferation and migration of tumor cells. Research has unveiled that in breast cancer, Livin can regulate drug resistance and promote Epithelial-Mesenchymal Transition (EMT) through the MAPK/ERK and PI3K/AKT SPWs[7]. Therefore, for the treatment of various malignancies, including CRC, it is essential to investigate the regulatory mechanisms of Livin-related SPWs and develop targeted treatment strategies aimed at Livin. This research aims to make more positive advancements in cancer treatment and prevention.
EMT is a series of transformative processes through which epithelial cells change into fibroblast-like or myofibroblasts-like cells with mesenchymal characteristics, such as muscle and connective tissue. EMT exerts a crucial effect onto different physiological and pathological processes, including, organ formation, wound healing, and inflammatory responses. In recent years, research has revealed the involvement of EMT in cancer cell migration, invasion, and drug resistance[8,9]. EMT in cancer cells is highly heterogeneous and dynamic[10]. During the EMT process in cancer cells, changes in cell phenotype include alterations in cell morphology, basement membrane degradation, detachment, and infiltration. This equips cancer cells with enhanced mobility and invasive capabilities, allowing them to easily penetrate the basement membrane and enter blood vessels, lymphatic vessels, and other tissues, enabling distant metastasis and spread[11]. This propensity can lead to local recurrence and distant metastasis in postoperative malignant tumors, posing greater challenges for clinical treatment.
In conclusion, Livin, as an apoptosis-inhibiting protein, was explored in this work through in vitro research to investigate its effects on the proliferation, migration, invasion, and EMT of CRC cells, employing the human CRC cell line HT-29 as the study subject. HT-29 cells exhibit high invasive and migratory capabilities and are widely used in CRC research. This research suggests that Livin may serve as a possible target to treat CRC, offering new insights and approaches for knowing the development mechanisms of CRC and developing relevant treatment strategies.
Materials and Methods
Research materials:
CRC cells were extracted from pathological specimens saved from 80 CRC patients at our institution from June 2017 to June 2022. Human CRC cell line HT-29 was selected as the research material, which were supplied by the Cell Bank of the Chinese Academy of Sciences, catalog number SCSP-5032, with STR profiles available. Normal Human Intestinal Epithelial Cells (HIEC) were purchased from Mingzhou Biology, catalog number MZ-0792.
HIEC and HT-29 cells were shipped in a revived state. Upon receiving the cells in T25 culture flasks, the flask exteriors were disinfected. Subsequently, fresh 1640 medium containing 10 % Fetal Bovine Serum (FBS) was position on T25 culture flasks within a laminar flow cabinet. The cells were then placed in a cell culture incubator and maintained for 24 h at 37° with 5 % Carbon dioxide (CO2) so that the cells can be recovered. After this, they were collected and transferred to centrifuge tubes, and subjected to a 10 min centrifugation at 1600 rpm to primarily separate any cell fragments from the transport culture. The separated cell fragments and the collected cell pellets were cultured separately. When passaging, 1:3 ratio was followed.
Construction of the Livin overexpression vector:
When establishing the Livin overexpression vector, the complementary Deoxyribonucleic Acid (cDNA) sequence of the Livin gene was obtained by querying the National Center for Biotechnology Information (NCBI) database. Primers were designed based on this sequence, as shown in Table 1. The Livin overexpression vector constructed in this study contains HindIII and BamHI restriction enzyme sites at both ends of the cDNA sequence. This cDNA sequence was then inserted into the pcDNA3.1 plasmid. Polymerase Chain Reaction (PCR) amplification was described as follows; the upstream and downstream primers were both diluted to a concentration of 10 μM, and 1 μl of each was added to the PCR tube. Subsequently, 2.5 mmol/l dNTP (4.0 μl), 2×Taq PCR Mastermix (10 μl), and double distilled Water (ddH2O) (4 μl) were added sequentially, resulting in 20 μl reaction volume.
| Livin primer | Sequence |
|---|---|
| F primer | GCGAAGCTTATGGGACCTA AAGACAGT |
| R primer | ATAGGATCCATAGGACAGGAAGGTGC |
Table 1: Livin Primers and the Sequences
The PCR program consisted of an initial denaturation at 95° for 20 s, followed by annealing at 55° for 60 s, and extension at 72° for 45 s. This cycle was repeated 30 times, with a final extension of 5 min. Gel electrophoresis was performed on a subset of samples, and the remaining samples were stored under freezing conditions.
After completing the PCR amplification of the target fragment, it was purified using the PureLink™ PCR purification kit (catalog number-K310001; Thermo Fisher supplier) following the instructions meticulously. Once the purified target fragment was obtained, TA cloning was performed. In an Eppendorf (EP) tube, 1 μl of pUM-T vector, 0.3 pmol, insert DNA, and 5 μl of buffer were combined, and then ddH2O was mixed so that the volume reached 10 μl. Subsequently, 1 μl of T4 DNA ligase was further blended with the mixture for a reaction at 22° for 30 min. The acquired blended substance was introduced into DH5 Alpha (DH5α) competent cells on ice and then heatshocked at 42° for 2 min. Following this, 800 μl of Super Optimal Broth with Catabolite Repression (SOC) medium was dropped, and cell incubation was allowed on a shaker for 1 h. Subsequently, the culture was transferred to agar medium for growth, and single clones were picked. The Livin gene was connected to Bio Teke for labeling the selected single clone. Sequencing was performed by Genewiz BioTech (Shanghai) Co., Ltd.
Subsequently, T-Livin was extracted using a plasmid extraction kit, specifically the PureLink™ 96 HQ Plasmid DNA Purification Miniprep Kit (catalog number-K210096; Thermo Fisher supplier).
T-Livin was then recombined with pcDNA3.1+. To achieve this, a double enzyme digestion was performed based on the HindIII and BamHI restriction enzyme sites. The digested fragments from T-Livin and pcDNA3.1+ were recovered, and the target gene was ligated into pcDNA3.1+ to create the pcDNA3.1+Livin plasmid. The pcDNA3.1+Livin plasmid was transfected into DH5α competent cells, following same method as previously described. The transfected DH5α competent cells containing the pcDNA3.1+Livin plasmid were cultured on amp-solid medium. Single colonies were selected, and their fragment lengths were identified through enzyme digestion to confirm positive clones. These positive clones were denoted as pcDNA3.1-Livin, and the sequencing of the experiment was determined.
Design of Livin shRNA interference fragment:
Blast analysis was employed to exclude off-target effects for the Livin gene. The designed and control short hairpin Ribonuclic Acid (shRNA) sequence for Livin were 5'- GATCCCCGGTGAGGTGCTTCTTCTGCTTCAA GAGAGCAGAAGAAGCACCTCACCTTTTT-3’ and 5’- GATCCCCTTCTCCGAACGTG. "TCACG TTTCAAGAGAACGTGACACGTTCGGAG AATTTTT-3’, respectively.
Cell transfection:
The pcDNA3.1 blank vector plasmid and Livin overexpression plasmid were separately transfected into HT-29 cells employing Lipofectamine 2000 reagent. These were designated as pcDNA3.1 and pcDNA3.1-Livin, respectively. Additionally, the control shRNA and Livin shRNA interference fragments were transfected into HT-29 cells using the same transfection procedure as described above. They were labeled as control shRNA and Livin shRNA.
Cell grouping:
The cells were grouped into five; blank HT- 29 cells, pcDNA3.1 blank vector-transfected cells (pcDNA3.1), cells transfected with Livin overexpression vector (pcDNA3.1-Livin), blank control cells for interference fragments (control shRNA), and cells with Livin shRNA interference (Livin shRNA).
Cell proliferation capability assessment:
The Cell Counting Kit-8 (CCK-8) assay was employed for assessing proliferation activity. Cells from the HT-29, pcDNA3.1, and pcDNA3.1-Livin groups were digested and then cell counting was performed. Cells were plated in a 96-well plate with a density of 4000 cells per well, using 100 μl of medium. Each group had five replicate wells. Following incubation for 0, 24, 48, 72, and 96 h, CCK-8 reagent was introduced into for a 30 min reaction at room temperature. Subsequently, an Enzyme-Linked Immunosorbent Assay (ELISA) reader was utilized to determine the absorbance at 450 nm wavelength. The readings were taken every 20 s for a total of four measurements.
Cell invasion assay:
Cell invasion was assessed by adopting the cell migration and invasion assay kit (catalog number-G4740; Manufacturer: Solarbio). Transwell chambers were removed from the 6-well plate, and Matrigel gel was evenly applied to the filter membrane on the upper chamber of the Transwell. Subsequently, 105 cells from each group (HT-29, pcDNA3.1, pcDNA3.1-Livin, control shRNA, and Livin shRNA) were positioned in the upper Transwell chambers to incubate in a cell culture incubator. Following a 48 h incubation period, the plate was taken out, and the cells that had migrated to the lower chamber were fixed using 4 % paraformaldehyde and subsequently stained with crystal violet. Utilizing an inverted microscope, the cells in the lower chamber of the Transwell plate were observed and counted to assess their invasive ability based on the cell count.
Cell migration assay:
The HT-29, pcDNA3.1, pcDNA3.1-Livin, control shRNA, and Livin shRNA cells were seeded using a 6-well plate for adherent culture. Following 48 h of cultivation, the medium was aspirated, and lines were drawn. The cell surface was rinsed with serum-free medium to remove cell debris. Observations were made under an inverted microscope, photographs were taken, and the positions of the scratch boundaries were recorded. Following this, serum-free medium was added for further cultivation. After another 48 h of incubation, observations and photography were conducted under the inverted microscope to record the positions of cell migration. The migration distances of the cells in each group were calculated.
Real-Time PCR (RT-PCR) to measure the messenger RNA (mRNA) levels in relevant proteins:
RT-PCR was adopted to measure the Livin mRNA levels in the HT-29, pcDNA3.1, pcDNA3.1- Livin, control shRNA, and Livin shRNA groups. Additionally, levels of Matrix Metalloproteinase 2 (MMP2) mRNA were determined in the HT-29, pcDNA3.1, and pcDNA3.1-Livin groups.
After culturing the cells transfected with plasmids or infected with fragments for 3 d, the cells were collected from all groups for an extraction of total RNA employing the PureLink™ RNA mini kit (catalog number-12183018A; Thermo Fisher supplier). The experimental procedures were strictly followed according to the manual.
RNAs after extraction were then reversely transcribed into cDNA using the following primers; the Livin F and P primers were 5’-CAGTTCCTGCTCCGGTCAA-3’ and 5 ’ - G G G C T C A A G A A C C C A C C A C - 3 ’ , respectively; while the MMP2 F and P primers were 5’-TGCTGAAGGACACACTAAAG-3’ and 5’-GTAGCCAATGATCCTGTATGT-3’, respectively. The PCR process was the same as described above. Gel electrophoresis was conducted in parallel, with 10 μl of each completed PCR sample loaded. Following gel electrophoresis, the analysis was performed using the 2-ΔΔct method.
Western Blot (WB) assay:
In this work, WB was applied to quantify levels of relevant proteins in cells from different groups. After successful transfection, HT-29, pcDNA3.1, and pcDNA3.1-Livin cells were cultured for 72 h, followed by lysing, and total protein in them was extracted to assess the levels of Livin, MMP2, E-cadherin, vimentin, and transcription factors (e.g., slug and snail).
The collected cells were lysed using Radioimmunoprecipitation Assay (RIPA) buffer containing protease inhibitors. The reaction tubes were positioned on an ultrasound machine and vigorously shaken, and the supernatant was collected after centrifugation to obtain the protein solution. Protein concentration was quantified adopting Bicinchoninic Acid (BCA) kit (catalog number-PC0020; Supplier: Solarbio). Subsequently, 20 μg of protein solution was subjected to Sodium Dodecyl Sulphate- Polyacrylamide Gel Electrophoresis (SDS-PAGE) with β-actin as an internal reference. This was followed by membrane transfer, primary antibody incubation, and secondary antibody incubation. Band grayscale values were observed and analyzed using a gel infrared imaging system.
Statistical analysis:
Data were analyzed utilizing Statistical Package for the Social Sciences (SPSS) 22.0 and were expressed as mean±standard deviation and compared employing t-test. Statistical significance was considered when p<0.05.
Results and Discussion
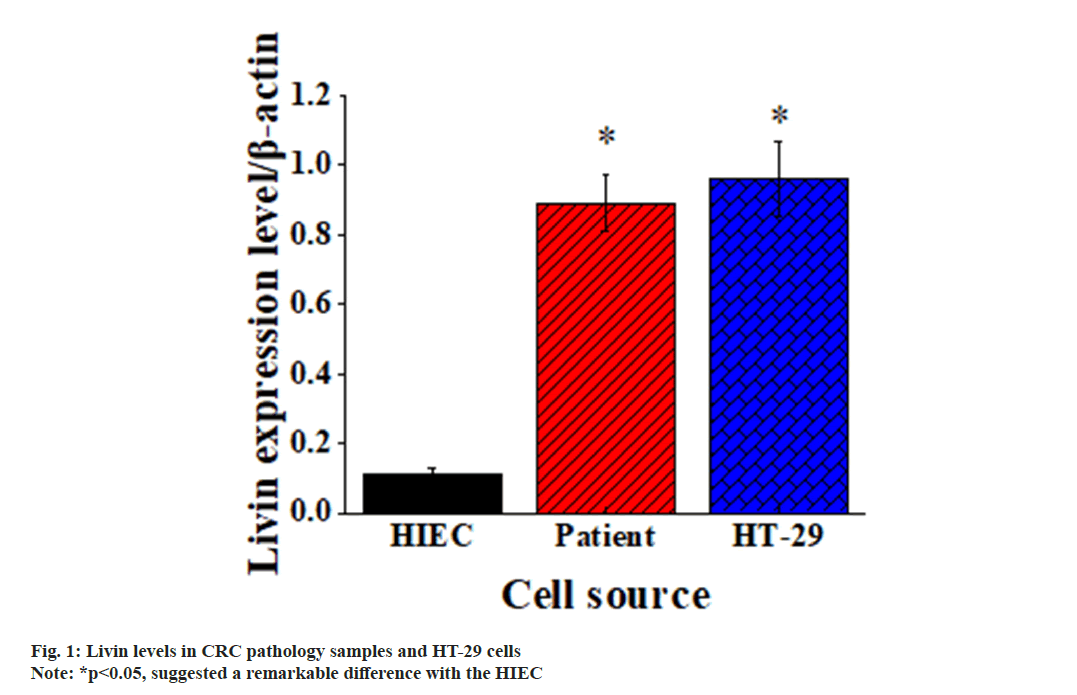
Based on the extraction of CRC cells from patient pathological specimens, it was evident that Livin level in CRC cells was much higher in contrast to that in normal cells. Furthermore, it was evident that the Livin level in CRC HT-29 cells was similar to that in CRC cells of patients. The above results were detailed in fig. 1.
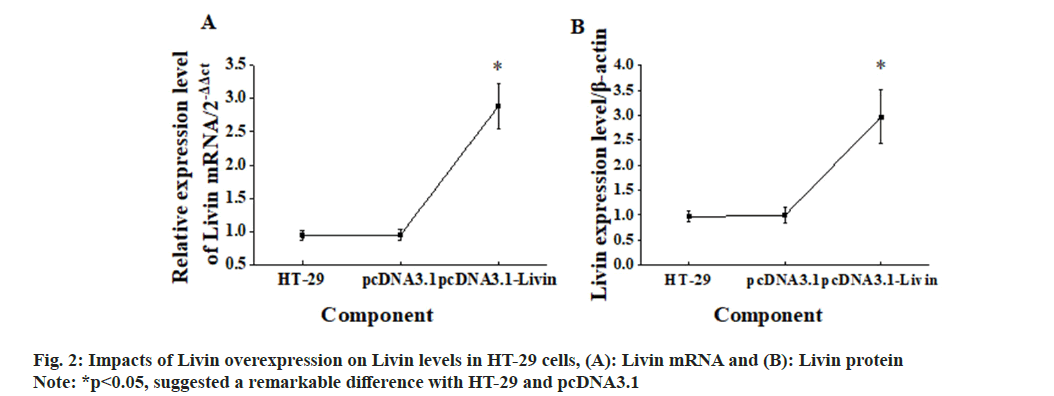
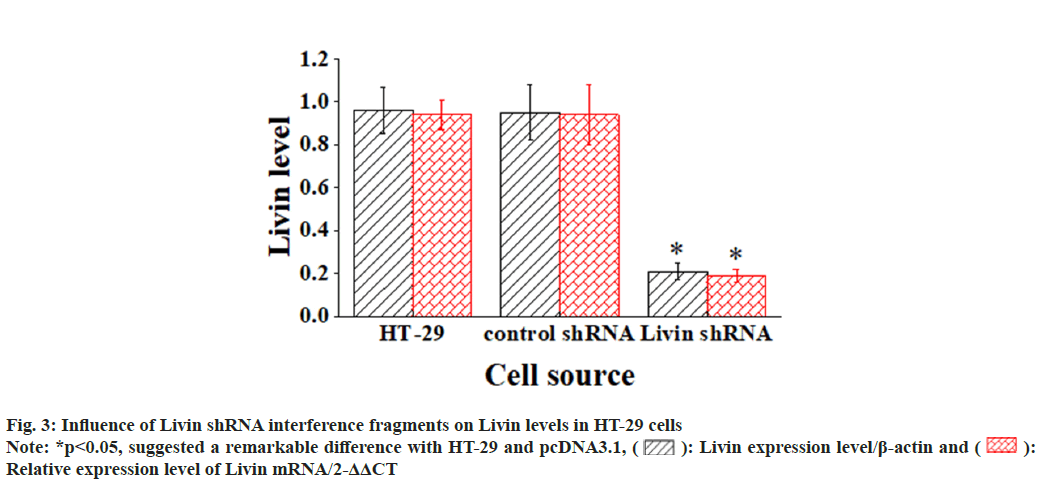
The blank vector and pcDNA3.1-Livin vector were transfected into HT-29 cells, and corresponding observations were demonstrated in fig. 2. After 72 h of cultivation, Livin mRNA and protein levels were assessed in the blank HT-29 cells, pcDNA3.1 blank vector cells, and pcDNA3.1 - Livin vector cells. In addition, the Livin mRNA and protein levels in blank HT-29 cells and pcDNA3.1 blank vector cells were similar, so the difference was not obvious (p>0.05). However, in pcDNA3.1-Livin cells, they were considerably higher in comparison to those in HT-29 and pcDNA3.1 (p<0.05), indicating a statistically visible difference. The Livin levels in HT-29 cells after transfection with the Livin interference fragment were examined, as illustrated in fig. 3. The results explicated that the Livin mRNA and protein in blank HT-29 cells exhibited similar levels to those in control shRNA cells (p>0.05), with no observable difference. However, in Livin shRNA cells, the Livin mRNA and protein levels were greatly lower and demonstrated remarkable differences compared to those in HT-29 and control shRNA cells (p<0.05).
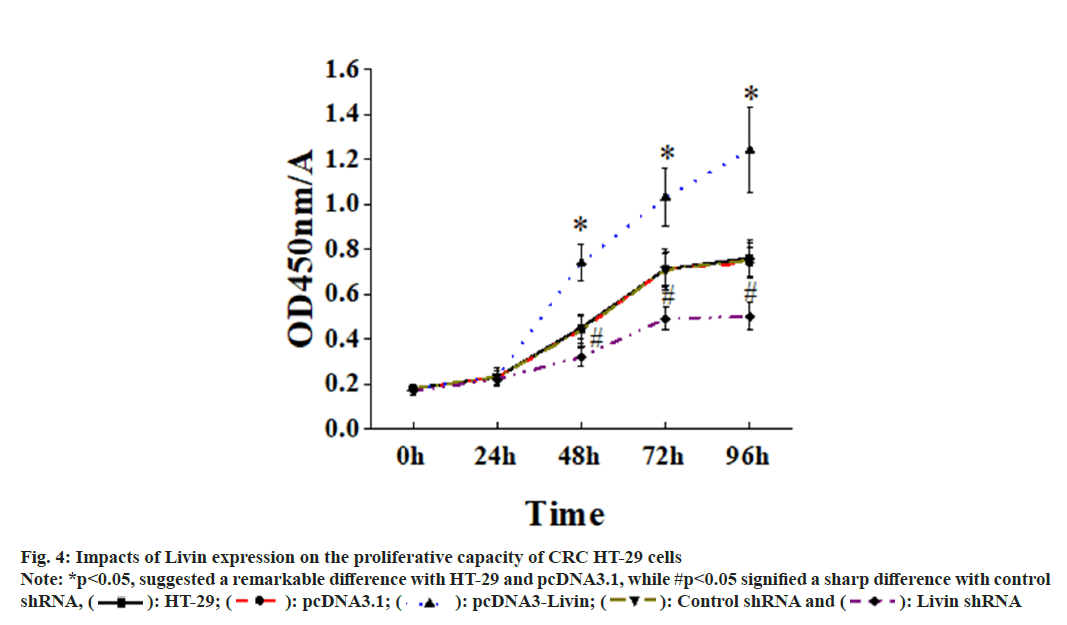
Fig. 4 illustrated the impacts of Livin expression on the proliferative capacity of CRC HT-29 cells. It revealed that adding CCK-8 at 0 and 24 h exerted no critical impact on the proliferation of blank HT- 29 cells, pcDNA3.1 blank vector cells, pcDNA3.1- Livin cells, control shRNA cells, and Livin shRNA cells (P>0.05). However, at 48, 72, and 96 h of cultivation, proliferation pcDNA3.1-Livin cells was more obvious when comparing with that in blank HT-29 and pcDNA3.1 blank vector cells (p<0.05). On the other hand, silencing the Livin gene resulted in a sharp lower proliferation rate in Livin shRNA cells in comparison to blank HT- 29 and control shRNA cells, showing substantial differences (p<0.05).
Fig. 4: Impacts of Livin expression on the proliferative capacity of CRC HT-29 cells Note: *p<0.05, suggested a remarkable difference with HT-29 and pcDNA3.1, while #p<0.05 signified a sharp difference with control
shRNA, ( ): HT-29; (
 ): pcDNA3.1; (
 ): pcDNA3-Livin; (
 ): Control shRNA and (
 ): Livin shRNA
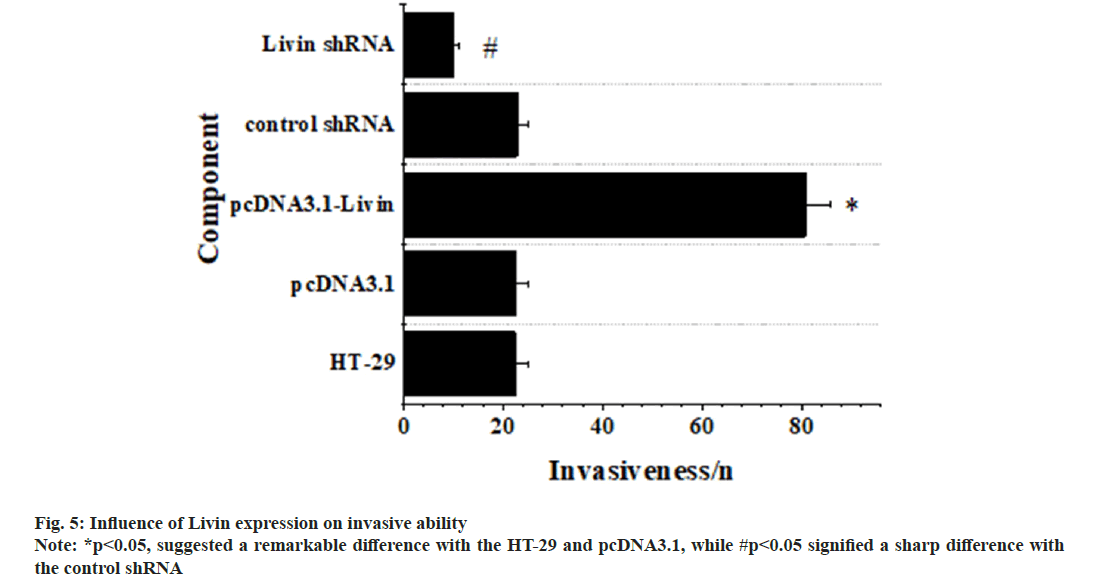
Fig. 5 displayed a comprehensive overview on influence of Livin expression on invasion. It revealed no significant distinctions in the invasiveness of blank HT-29 cells, pcDNA3.1 blank vector cells, and control shRNA cells, so p>0.05 was applicable. Conversely, the pcDNA3.1-Livin cells displayed a notably heightened invasiveness in comparison to blank HT-29 and pcDNA3.1 blank vector cells (p<0.05), demonstrating obvious significance. In contrast, Livin shRNA cells exhibited a remarkably diminished invasiveness when compared to blank HT-29 and control shRNA cells (p<0.05).
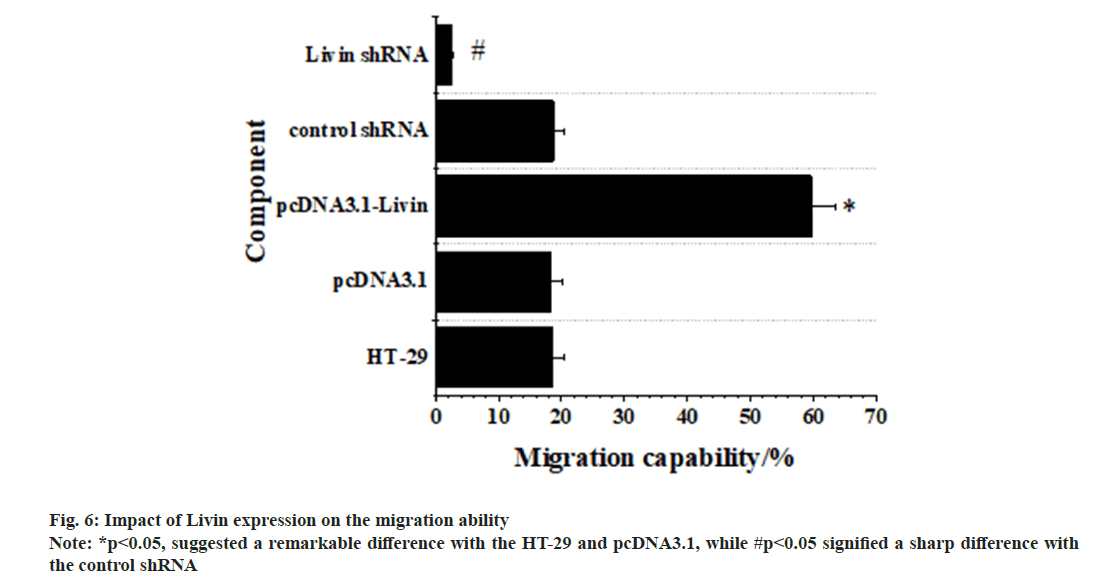
Fig. 6 below demonstrated the results for impacts of Livin expression on migration of CRC HT-29 cells. As it revealed, no visible difference was observed in the migration of blank HT-29 cells, pcDNA3.1 blank vector cells, and control shRNA cells (p>0.05), with no significance. However, the migration ability of pcDNA3.1-Livin cells was remarkably higher in contrast to the ability of blank HT-29 and pcDNA3.1 blank vector cells (p<0.05), indicating obvious significance. Conversely, Livin shRNA cells exhibited a considerably weaker migration ability when comparing to blank HT-29 and control shRNA cells (p<0.05).
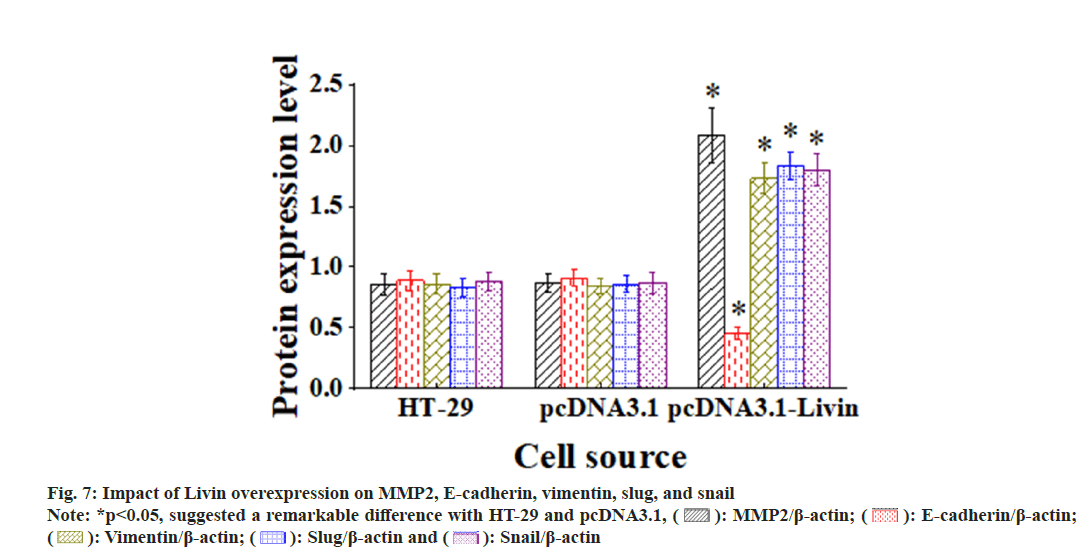
Livin overexpression can affect the various proteins, as demonstrated in fig. 7. There existed no visible alterations in levels of MMP2, E-cadherin, vimentin, slug, and snail among blank HT-29 cells, pcDNA3.1 blank vector cells, and control shRNA cells (p>0.05). Conversely, compared to those in blank HT-29 and pcDNA3.1 blank vector cells, above proteins exhibited substantial increases and visible differences in the pcDNA3.1-Livin cells (p<0.05), while E-cadherin expression was sharply lower (p<0.05).
Surgical treatment remains the primary choice in clinical practice. However, if the malignant tumor is not completely resected, it can lead to cancer recurrence or metastasis, significantly affecting the patient's survival. Moreover, chemotherapy has noticeable side effects and can severely impact the overall health of patients. Prolonged chemotherapy may also lead to drug resistance[12,13]. Tumor cells develop due to genetic mutations or abnormalities in processes like DNA methylation, which impart characteristics such as uncontrolled proliferation and increased mobility. Research suggests that the development of CRC may be linked to the activation of proto-oncogenes in epithelial cells and the inactivation of tumor suppressor genes. Therefore, studying genes and proteins related to CRC is crucial in providing new approaches to CRC treatment[14,15].
The outcomes of this work suggested that Livin overexpression is tightly associated with the proliferation, migration, invasion, and EMT of HT-29 cells. Livin level was greatly elevated in CRC cells from the pathological specimens of patients compared to normal cells. This indicates that Livin may exert a specific role in CRC. Previous research has demonstrated that elevated Livin in ovarian cancer cells promotes their proliferation[16]. Additionally, upregulated Livin has been linked to reduced patient survival rates, and that in bladder cancer influences cancer cell proliferation[17]. In addition, this work indicated that upregulation of Livin may be linked to CRC. Transfection with the pcDNA3.1-Livin vector resulted in Livin overexpression in HT-29 cells, leading to a remarkable increase in Livin mRNA and protein levels. This was compared to silencing the Livin gene. The results further signified that Livin overexpression enhances the proliferation, invasion, and migration of CRC cells, suggesting its overexpression is linked to cell proliferation, invasion, and migration abilities. This implies that Livin may promote tumor growth and spread in CRC. Studies have proved significant upregulation of Livin gene expression in CRC samples[18]. In endometrial cancer patients, Livin/BIRC7 gene expression was upshifted greatly[19]. Moreover, it has been proposed that Livin is a possible target for microRNA (miR)-214-3p, and upregulation of miR-214-3p inhibits Livin protein level, suppressing the activation of the NF-κB SPW, thus potentially affecting the progression of CRC[20]. In this work, it was also observed that the Livin overexpression was linked with changes in levels of MMP2, E-cadherin, vimentin, and transcription factors slug and snail. MMPs have been linked to the microenvironment of cancer cell metastasis, where they are secreted proteases associated to neutrophil extracellular traps, thereby enhancing migration and invasion of cancer cells, directly exacerbating tumor invasiveness[21]. Additionally, this work reflected that promoting the Livin overexpression elevates MMP2, suggesting that Livin enhances tumor cell migration and invasion, promoting cancer cell metastasis. In the course of EMT within epithelial cells, there is a reduction in the expression of the epithelial marker protein E-Cadherin, accompanied by an elevation in the expression of the mesenchymal marker vimentin[22]. Moreover, Livin overexpression was consistent with this pattern, indicating that Livin overexpression promotes EMT in CRC cells, triggering a reduced cell polarity and enhanced migration and invasion abilities.
In conclusion, the results acquired in this work strongly suggested that Livin exerted a key role in CRC and may facilitate tumor proliferation, invasion, and metastasis. The upregulation of Livin in colorectal cells of CRC patients contributes to Livin overexpression, which in turn likely regulates the proliferation of CRC cells, while also promoting the expression of MMP2, vimentin, slug, and snail, as well as suppressing E-cadherin expression in CRC cells. This enhances EMT capabilities of CRC cells, ultimately promoting their migration and invasion abilities.
This work unveiled the significant role of Livin in the human CRC cell line HT-29. Livin overexpression promoted cell proliferation, migration, invasion, and induced the cells to undergo EMT. These findings suggested that Livin could potentially serve as a target in treating CRC. By modulating the level or function of Livin, it may be possible to inhibit the development and spread of CRC. This research yielded crucial insights into the molecular mechanisms of CRC and offered valuable information for the development of potential treatment strategies.
Conflict of interests:
The authors declared no conflict of interests.
References
- Samir G. Screening for colorectal cancer. Hematol Oncol Clin North Am 2022;36(3):393-414.
- Sullivan BA, Noujaim M, Roper J. Cause, epidemiology, and histology of polyps and pathways to colorectal cancer. Gastrointest Endosc Clin N Am 2022;32(2):177-94.
[Crossref] [Google Scholar] [PubMed]
- Barot S, Patel H, Yadav A, Ban I. Recent advancement in targeted therapy and role of emerging technologies to treat cancer. Med Oncol 2023;40(11):324.
[Crossref] [Google Scholar] [PubMed]
- Hari SK, Gauba A, Shrivastava N, Tripathi RM, Jain SK, Pandey AK. Polymeric micelles and cancer therapy: An ingenious multimodal tumor-targeted drug delivery system. Drug Deliv Transl Res 2023;13(1):135-63.
[Crossref] [Google Scholar] [PubMed]
- Faruk M, Ibrahim S, Aminu SM, Adamu A, Abdullahi A, Suleiman AM, et al. Prognostic significance of BIRC7/Livin, Bcl-2, p53, Annexin V, PD-L1, DARC, MSH2 and PMS2 in colorectal cancer treated with FOLFOX chemotherapy with or without aspirin. PLos One 2021;16(1):e0245581.
[Crossref] [Google Scholar] [PubMed]
- Chen F, Yang D, Wang S, Che X, Wang J, Li X, et al. Livin regulates prostate cancer cell invasion by impacting the NF-κB signaling pathway and the expression of FN and CXCR4. IUBMB Life 2012;64(3):274-83.
[Crossref] [Google Scholar] [PubMed]
- Li F, Zhang L, Feng F, Zheng K, Li Y, Wang T, et al. Livin participates in resistance to trastuzumab therapy for breast cancer through ERK1/2 and AKT pathways and promotes EMT-like phenotype. RSC Adv 2018;8(50):28588-601.
- Zhang R, Chen X, Miao C, Chen Y, Li Y, Shen J, et al. Tumor-associated macrophage-derived exosomal miR-513b-5p is a target of jianpi yangzheng decoction for inhibiting gastric cancer. J Ethnopharmacol 2024;318:117013.
[Crossref] [Google Scholar] [PubMed]
- Wang L, Li S, Luo H, Lu Q, Yu S. PCSK9 promotes the progression and metastasis of colon cancer cells through regulation of EMT and PI3K/AKT signaling in tumor cells and phenotypic polarization of macrophages. J Exp Clin Cancer Res 2022;41(1):303.
[Crossref] [Google Scholar] [PubMed]
- Huang Y, Hong W, Wei X. The molecular mechanisms and therapeutic strategies of EMT in tumor progression and metastasis. J Hematol Oncol 2022;15(1):129.
[Crossref] [Google Scholar] [PubMed]
- Sadrkhanloo M, Entezari M, Orouei S, Ghollasi M, Rezaei S, Hejazi ES, et al. STAT3-EMT axis in tumors: Modulation of cancer metastasis, stemness and therapy response. Pharmacol Res 2022;182:106311.
[Crossref] [Google Scholar] [PubMed]
- Davodabadi F, Sajjadi SF, Sarhadi M, Mirghasemi S, Hezaveh MN, Khosravi S, et al. Cancer chemotherapy resistance: Mechanisms and recent breakthrough in targeted drug delivery. Eur J Pharmacol 2023;958:176013.
[Crossref] [Google Scholar] [PubMed]
- Fu A, Yao B, Dong T, Cai S. Emerging roles of intratumor microbiota in cancer metastasis. Trends Cell Biol 2023;33(7):583-93.
[Crossref] [Google Scholar] [PubMed]
- Alketbi L, Al-Ali A, Talaat IM, Hamid Q, Bajbouj K. The role of ATP-binding cassette subfamily a in colorectal cancer progression and resistance. Int J Mol Sci 2023;24(2):1344.
- Yuan W, Chen Y, Zhuang D, Zeng H, Lin X, Hong S, et al. UHPLC-MS/MS-based central carbon metabolism unveils the biomarkers related to colon cancer. Cell Mol Biol 2023;69(9):167-71.
[Crossref] [Google Scholar] [PubMed]
- Xu X, Yu S, Liu X, Feng Y. Ultrasound-targeted microbubble destruction-mediated inhibition of livin expression accelerates ovarian cancer cell apoptosis. Genet Res 2021;2021:7624346.
[Crossref] [Google Scholar] [PubMed]
- Li X, Fu C, Li G, He H. RNA-seq reveals novel mechanistic targets of Livin in bladder cancer. BMC Urol 2023;23(1):26.
[Crossref] [Google Scholar] [PubMed]
- Zhang Z, Zhang Y, Lao S, Qiu J, Pan Z, Feng X. The clinicopathological and prognostic significances of IGF-1R and Livin expression in patients with colorectal cancer. BMC Cancer 2022;22(1):855.
[Crossref] [Google Scholar] [PubMed]
- Elmekkawy BK, Shoaib RM, Seleem AK, Shalaan D, Saad EA. Livin/BIRC7 gene expression as a possible diagnostic biomarker for endometrial hyperplasia and carcinoma. J Genet Eng Biotechnol 2021;19(1):141.
[Crossref] [Google Scholar] [PubMed]
- Han B, Ge Y, Cui J, Liu B. Down-regulation of lncRNA DNAJC3-AS1 inhibits colon cancer via regulating miR-214-3p/LIVIN axis. Bioengineered 2020;11(1):524-35.
[Crossref] [Google Scholar] [PubMed]
- Demkow U. Neutrophil Extracellular Traps (NETs) in cancer invasion, evasion and metastasis. Cancers 2021;13(17):4495.
[Crossref] [Google Scholar] [PubMed]
- Liang L, Kaufmann AM. The significance of cancer stem cells and epithelial–mesenchymal transition in metastasis and anti-cancer therapy. Int J Mol Sci 2023;24(3):2555.
[Crossref] [Google Scholar] [PubMed]
 ): Livin expression level/β-actin and (