- *Corresponding Author:
- S. N. Gaikwad
Department of Pharmaceutical Sciences, Rashtrasant Tukadoji Maharaj Nagpur University, University Campus, Amravati Road, Nagpur-440033, 1Indian Institute of Technology, Delhi-110016, India
E-mail: sanj410@gmail.com
| Date of Received | 14 December 2019 |
| Date of Revision | 17 January 2020 |
| Date of Acceptance | 02 February 2020 |
| Indian J Pharm Sci 2020;82(2):282-290 |
This is an open access article distributed under the terms of the Creative Commons Attribution-NonCommercial-ShareAlike 3.0 License, which allows others to remix, tweak, and build upon the work non-commercially, as long as the author is credited and the new creations are licensed under the identical terms
Abstract
In the present study artemether and lumefantrine self-nano emulsifying drug delivery system formulations were prepared using combination of these drugs with Capmul medical countermeasure, oleic acid and Tween 80. The particle size and zeta potential of these formulations was found to be 15.2 nm and −22.8 mV. The solubility and in vitro dissolution performance of both drugs in self-nano emulsifying drug delivery system formulations was improved significantly as compared to pure drugs and marketed product and the in vivo studies confirmed it. In vivo studies in rats revealed that there was an increase in bioavailability of self-nano emulsifying drug delivery system formulations compared to pure drugs with the area under the curve of artemether from formulation was 598.89±114.33 in comparison to that of pure artemether 190.82±36.57 and the area under the curve for lumefantrine from the formulations was 190.82±36.57 in comparison to that of the pure lumefantrine 68.71±18.63. The Cmax was enhanced for artemether from 13.11±2.22 to 110.31±40.88 and for lumefantrine from 2.39±1.61 to 18.22±2.32.
Keywords
Artemether, lumefantrine, malaria, nanotechnology, solubility, in-vivo bioavailability
Approximately 40-70% of new therapeutic molecules studied in recent years belong to class II or Class IV of Biopharmaceutical Classification System (BCS), exhibiting low solubility that restricts absorption from gastrointestinal (GI) system after oral administration[1,2]. There are many possible factors for poor or erratic bioavailability. In order to achieve high bioavailability and low variability for oral pharmaceutical products, API must be dissolvable and stable in GI lumen to get absorbed adequately. The bioavailability of these candidates can be enhanced by lipid based drug delivery system along with nanotechnology, which provides additive effect on bioavailability[3,4]. Several techniques have been used to improve the bioavailability of poorly soluble therapeutic compound such as particle size reduction, liposomes, nano-micelles and selfemulsifying drug delivery system[5-8].
One of the promising approaches amongst these are selfnano emulsifying drug delivery system (SNEDDS), a homogeneous mixtures of oils, drugs, surfactants and co surfactants, which are anhydrous in nature and have emerged as a promising approach in nano emulsions for oral drug delivery. Oil-in-Water (O/W) nano emulsions will be spontaneously formed when SNEDDS is exposed to GI fluids. The physicochemical properties of drugs encapsulated in nano emulsions significantly change and overcome the multiple bio-barriers in GI tract leading to improved oral bioavailability[9-12] .
Malaria is a life-threatening disease caused by Plasmodium parasites that are, transmitted to people through the bites of infected Anopheles mosquitoes. The massive antimalarial market is largely made up of poor people, making it less pleasing to pharmaceutical companies and consequently their investment in antimalarial research is declining[13] and also increasing resistance to existing drugs coupled with the scarcity of new drugs/drug combinations, the onus of malaria control lies largely on wise use of available antimalarials through the design of nanotechnology based drug delivery systems and combination therapy. Antimalarial combination therapy, which has been widely explored involves simultaneous use of two or more blood schizontocidal drugs with independent modes of action against distinct biochemical targets in the malarial parasite. Among the developed combinations, WHO has banned monotherapy and recommend few rational combinations and artemether lumefantrine combination is one of them. The rationale for combining these two antimalarials with different modes of action was to couple the synergistic fast onset of action of artemether with the long duration of action of lumefantrine. Artemether is essential for rapid clearance of parasitaemia and rapid resolution of symptoms. Artemether is effective against drug resistant malaria and additionally it reduces gametocyte carriage. However the drug exhibits a short half-life of 2-3 h. It was therefore combined with lumefantrine, which acts slowly and has a longer half-life. The long-acting effect of lumefantrine may prevent recrudescence and development of resistance[14,15].
Artemether, a BCS Class II drug exhibits low aqueous solubility with higher permeability and quickly metabolized in GIT, while lumefantrine has low solubility and low permeability (BCS Class IV). Thus, it was planned to design an oral formulation which enhances the solubility of both the drugs and also overcomes the metabolism of artemether in the GIT with enhanced permeability of lumefantrine. These biopharmaceutical challenges are removed by versatile formulation approaches to retain the physicochemical properties of the drugs while simultaneously overcoming the biopharmaceutical challenges. Thus, the present work is focused on development of lipid-based drug delivery systems of artemether and lumefantrine in combination to increase the solubility, facilitate absorption of both these drugs and to overcome the drawback of inconsistent bioavailability[16-19].
Materials and Methods
Artemether was procured as a gift sample from Ipca Laboratories Ltd., Mumbai, India. Lumefantrine and magnesium aluminum silicate (CAS No: 1327-43-1) were procured as gift samples from Zim Laboratories, Nagpur, India. Tween 80 (CAS No-9005-65-6) and Oleic acid (CAS No: 112-80-1) was purchased from Merck India Ltd, Mumbai, India. Capmul MCM (CAS No: 26402-22-2) was obtained from Abitec Corporation, USA. All the other chemicals used in this study were of AR grade.
Determination of saturation solubility of artemether and lumefantrine in different systems:
The solubility of artemether and lumefantrine in various oils, surfactants, co-surfactants and co-solvents was determined by dissolving an excess amount of each drug in 2 ml of each selected solvent systems in 5-ml stoppered vials separately (Table 1). The contents of the vials were mixed on a vortex mixer and further stirred on an orbital shaker at 37±1º for 72 h to reach equilibrium. The samples were then centrifuged at 3000 rpm for 15 min, supernatants were filtered through a membrane. The concentration of artemether and lumefantrine in different solvent systems was determined using a HPLC (Shimadzu LC2100 at 214 nm, reversed phase C18, 4.6×250 mm, 10 μm particle size) at 25º, employing a mobile phase containing acetonitrile:double distilled water:glacial acetic acid (75:25:0.2) at a flow rate of 1 ml/min. The retention time for artemether and lumefantrine were found to be 9.0 and 11.2 min, respectively[15].
| Oils/surfactants/co-solvents | Solubility of artemether (mg/ml) | Solubility of lumefantrine (mg/ml) |
|---|---|---|
| Castor oil | 32.3±0.52 | 10.31± 0.86 |
| Arachis oil | 41.23±0.32 | 32.85± 0.21 |
| Corn oil | 11.34±0.12 | 23.91± 0.87 |
| Oleic acid | 17.90±0.67 | 597.85±0.34 |
| Captex 300 | 35.45±0.23 | 12.31±56 |
| Capmul MCM | 315.34±0.07 | 16.39±0.48 |
| Gelucire | 32.45±0.32 | 19.32±0.21 |
| Isopropyl myristate | 18.54±0.87 | 50.11±0.32 |
| Acconon MC8 | 8.22±0.43 | 15.22±0.67 |
| Tween 80 | 233.08±0.98 | 110.87±43 |
| Tween 20 | 4.67±0.13 | 10.18±0.13 |
| Span 80 | 9.88±0.90 | 5.67±0.38 |
| Cremophore EL | 232.40±0.29 | 45.52 ±0.29 |
| Cremophore RH 40 | 21.45±0.21 | 53.32±0.34 |
Table 1: Solubility of Artemether and Lumefantrine in Different Oils and Surfactants
Construction of ternary phase diagram for identification of micro emulsions zone:
On the basis of solubility studies, components of emulsions such as oils, surfactants and co surfactants with greater solubility for artemether and lumefantrine were selected. The blends of surfactants and co surfactants (Smix) were prepared then mixed with the oily phase by adding small amounts with constant stirring. The varied proportions of oil:Smix were titrated with distilled water with stirring to produce clear and transparent solutions. From these observations, the ternary phase diagram was constructed[20].
Formulation of liquid SNEDDS of artemether and lumefantrine:
Liquid SNEDDS were prepared by dispersing the required quantity of artemether and lumefantrine in 20 % w/w Capmul MCM (co-surfactant). The mixture was homogenized and oil:surfactant blend (oleic Acid 20 % w/w:Tween 80 60 % w/w) was added in small portions with constant stirring. The blends were mixed thoroughly on a magnetic stirrer to obtain resultant emulsion[21].
Characterization of liquid SNEDDS:
The droplet size distributions and Zeta potential of the resultant emulsions were determined using a particle size analyzer (Nanosizer SZ-100)[22]. The percent drug content of artemether and lumefantrine in SNEDDS was estimated by the dissolving SNEDDS equivalent to 120 mg of artemether and 20 mg lumefantrine in the mobile phase and analyzing the drug content using HPLC.
Preparation and characterization of solid SNEDDS:
The liquid SNEDDS was adsorbed on the carrier by physical mixing to form solid SNEDDS (S-SNEEDS) using the adsorption method with Neusilin US2 as a carrier mixed in the ratio of 1:1. A free flowing powder of S-SNEDDS was obtained[20,23]. The physical properties of S-SNEDDS such as angle of repose, bulk and tapped density were determined using reported methods. Hausner’s ratio, and Carr’s index was determined to understand the flow properties of S-SNEDDS[23].
Particle size and the zeta potential of the prepared S-SNEDDS were determined by diluting with 100 ml distilled water and sonicating to form droplets. The droplet size distributions and zeta potential of the resultant emulsion was determined on a particle size analyzer. Percent drug content of artemether and lumefantrine in S-SNEDDS was determined using HPLC.
In vitro drug release:
In vitro dissolution studies were performed using the USP XXII type II apparatus at 50 rpm, 37±0.5º in order to ensure quick release of the drug in to the dissolution medium (900 ml of pH 7.2 phosphate buffer containing 1 % w/v sodium lauryl sulphate] for S-SNEDDS, pure artemether and lumefantrine and the marketed formulation Lumither®. Aliquots were withdrawn at predetermined intervals and analyzed using HPLC to determine cumulative percent drug release[24].
Differential scanning calorimetry (DSC) and Fourier-transform infrared spectroscopy (FTIR):
The drugs and formulation were exposed in standard aluminum pan and scanned at a speed of 10o/min and heat flow from 0 to 200º on a DSC (Netzsch STA 409) and crystal transformation and thermal behavior was studied. FTIR (Bruker Vertex 70) spectra of artemether, lumefantrine and formulation were run by preparing a pellet of potassium bromide and analysed over a range 4000-400 cm-1.The spectra were recorded and the functional groups were determined.
Scanning electron microscopy (SEM) and X-ray diffractometry (XRD):
The surface morphology of artemether, lumefantrine and formulation was studied using SEM (Phenom G2 pure) by sprinkling S-SNEDDS powder on a double adhesive plate stuck on an aluminum stub, further coated with platinum 10oA thick under high vacuum. XRD was used for determining structure of crystals based on pattern of diffraction and was carried on a X-ray Diffractometer (Rigaku Mini Flex 600). X-ray scattering measurements of artemether, lumefantrine and formulation were carried out at a voltage of 40 kV and current of 25 mA using Cr as a tube anode material. Artemether, lumefantrine and formulations were exposed at angles of 10-70° to Cu –Kα radiation[25].
Bioavailability studies:
Animal experiments were performed as per the guidelines of the Institutional Animal Ethical Committee, Zydus Research Centre Zydus Cadila, Ahmedabad, India (AEC Approval no: ZRC/TOX/ NP/093/12-2K13). Male Sprague Dawley rats (170- 200 g) were kept in air-conditioned animal quarters at a temperature of 22±2o and a relative humidity of 50±10 % under fasting conditions were used. The rats were allowed to acclimatize for 7 d and then fasted but with free access to water for 8 h prior to the experiment. All rats were divided in to groups of 5 animals and administered orally doses of 3.6 mg/kg of artemether (group 1), 21.6 mg/kg of lumefantrine (group 2) marketed formulation of artemether and lumefantrine (Lumither®, group 3) and the optimized formulation of S-SNEDDS containing artemether and lumefantrine (group 4). All formulations were dispersed in pure water containing 0.5 % sodium carboxymethyl cellulose, and immediately administered by oral gavage. Rats were anesthetized and blood samples were collected at desired time intervals from the tip of the tail into heparinized glass capillary tubes and centrifuged. Protein from plasma aliquot was removed by acetonitrile precipitation. The supernatant was filtered and injected into HPLC for analysis of artemether and lumefantrine in plasma. Mobile phase used was a binary gradient of methanol and 0.025M ammonium acetate, pH-3.8, flow rate 1 ml/min, monitored at 216 nm in a UV detector. For the analysis of data kinetics software was used[26].
The formulation was filled in capsules (size 00) and stability studies were carried out according to ICH guidelines at accelerated conditions of 40±2° and 75±5 % RH in a stability chamber and at the end of 1, 3, 6 months drug content was determined .
Results and Discussion
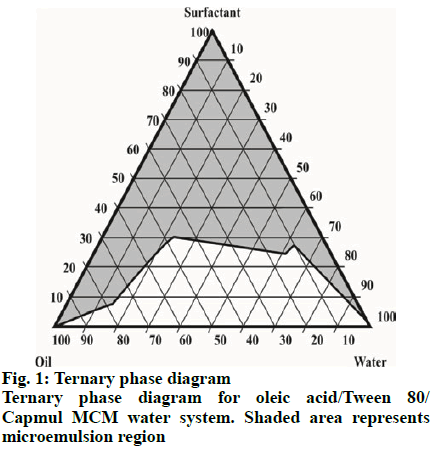
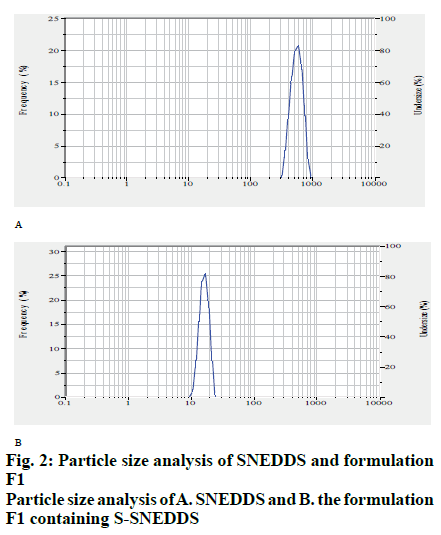
Different oils, surfactants and co surfactants were used to find out the solubility of artemether and lumefantrine. Among the oil phases studied, saturation solubility of artemether was found to be superior in Capmul MCM and for lumefantrine, oleic acid showed maximum solubility. The saturation solubility of artemether and lumefantrine was found to be higher in Tween 80 out of the surfactants tested (Table 1). For the development of liquid SNEDDS, the compositions of micro emulsion zones from phase diagram (fig. 1) were selected, which were, Tween 80, oleic acid and Capmul MCM. The droplet size of SNEDDS (15.6 nm) indicated the formation of SNEDDS precisely as shown in fig. 2. The observed value of zeta potential was found to be - 17.3 mV. The drug content of the SNEDDS formulations suggested uniform distribution of artemether and lumefantrine. Artemether content of the formulation was found to be 98.32±0.76 % and that of lumefantrine was found to be 98.56±0.36 %.
The S-SNEDDS formulation F1 indicated good flow properties and complied with powder characteristics such as bulk density of 0.402±0.0024 cm3, tapped density of 0.459±0.0030 cm3 with Carr’s index 12.41±0.813, Hausner’s ratio 1.14±0.010 and angle of repose of 28[23]. The size of F1 formulation was found to be 15.2 nm as shown in fig. 2. Particle size of S-SNEDDS seemed to be less affected by solidification of liquid SNEDDS providing additive effect on bioavailability and zeta potential was found to be -22.8 mV. The artemether and lumefantrine contents of S-SNEDDS were virtually identical with those obtained for liquid SNEDDS. In the formulation the content of artemether was found to be 98.87±0.34 % and that of lumefantrine was found to be 97.08±0.24%.
SNEDDS formulation showed highest cumulative drug release (96.34±0.65%) followed by Lumither® (72.56±0.12%) and pure artemether (24.34±0.96%) in 60 min of the study. Similarly SNEDDS formulation showed highest cumulative drug release (95.64±0.06%) followed by Lumither® (92.83±0.09%) and pure lumefantrine (15.94±0.02) in 120 min of the study as shown in Tables 2 and 3. Self emulsification and dissolution in SNEDDS was observed which was enhanced due complexation and prevention of drug precipitation. Thus, from dissolution studies it can be concluded that aqueous solubility and dissolution rate of drugs were significantly enhanced.
| Time (min) | CDR pure artemether (%) | CDR SNEDDS (%) |
CDR Lumither® (%) |
|---|---|---|---|
| 0 | 0 | 0 | 0 |
| 10 | 4.56±0.39 | 64.32±0.76 | 22.45±0.08 |
| 20 | 5.34±0.98 | 72.03±0.01 | 29.34±0.40 |
| 30 | 6.23±0.77 | 79.21±0.99 | 40.43±0.45 |
| 40 | 12.35±0.76 | 88.66±0.63 | 52.56±0.87 |
| 50 | 19.76±0.23 | 93.72±0.29 | 64.74±0.62 |
| 60 | 24.34±0.96 | 96.34±0.65 | 72.56±0.12 |
CDR is cumulative drug release, Mean±SD, n=3
Table 2: Cumulative Drug Release from Snedds, Lumither® and Pure Artemether
| Time (min) | CDR pure lumefantrine (%) | CDR SNEDDS (%) |
CDR Lumither® (%) |
|---|---|---|---|
| 0 | 0 | 0 | 0 |
| 10 | 2.46±0.56 | 63.67±0.24 | 21.87±0.71 |
| 20 | 4.23±0.76 | 69.67±0.40 | 27.67±0.44 |
| 30 | 5.56±0.05 | 73.65±0.43 | 38.56±0.54 |
| 40 | 5.76±0.09 | 82.54±0.45 | 49.56±0.09 |
| 50 | 6.44±0.21 | 89.65±0.67 | 62.54±0.76 |
| 60 | 7.94±0.12 | 92.78±0.09 | 70.78±0.83 |
| 70 | 8.62±0.08 | 94.56±0.70 | 74.45±0.86 |
| 80 | 9.13±0.72 | 94.18±0.32 | 78.43±0.49 |
| 90 | 10.94±0.87 | 94.71±0.45 | 80.43±0.05 |
| 100 | 11.89±0.21 | 95.15±0.91 | 85.44±0.09 |
| 110 | 13.74±0.98 | 95.39±0.21 | 88.74±0.12 |
| 120 | 15.94±0.02 | 95.64±0.06 | 92.83±0.09 |
CDR is cumulative drug release, Mean±SD, n=3
Table 3: Cumulative Drug Release of Snedds, Lumither® and Pure Lumefantrine
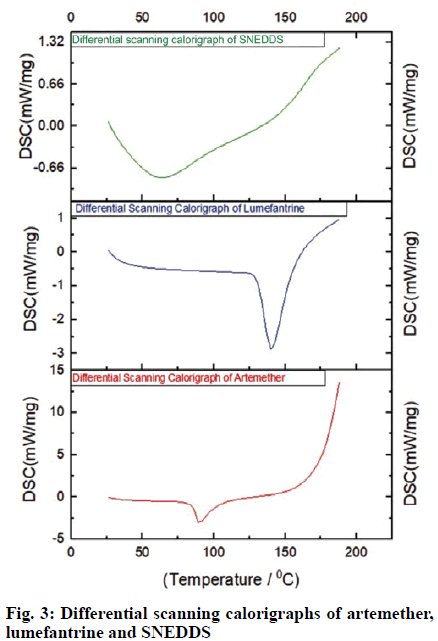
The DSC thermogram of artemether showed typical characteristics of a crystalline substance indicated sharp endothermic peak at 89.7º whereas, lumefantrine showed a sharp endothermal peak at 140.1º and onset at 131.1º, which were identical to the reported value. SNEDDS represented no such peak, which indicated that the change in melting behavior of drug and inhibition of crystallization. The disappearance of the melting endotherm in the DSC scan of SNEDDS of artemether and lumefantrine suggested that the crystalline drug was converted to the amorphous state. DSC scans of artemether, lumefantrine and SNEDDS are shown in fig. 3.
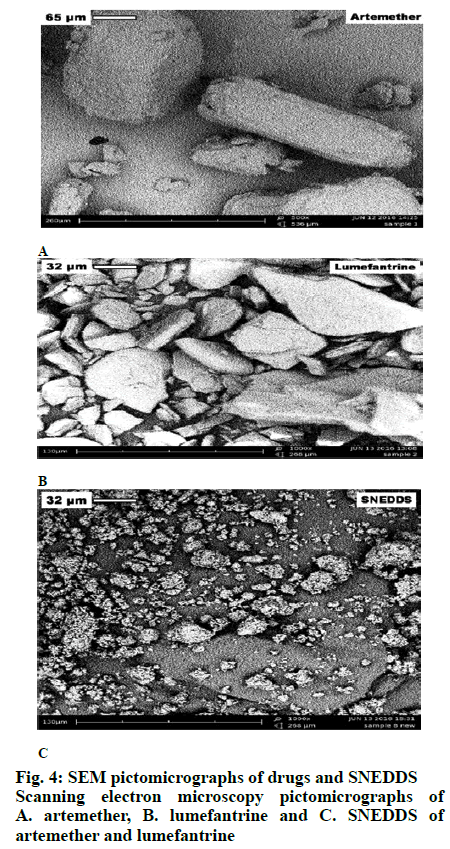
Artemether was characterized by crystals of bigger size and regular shape with an apparently smooth surface. SEM micrographs of lumefantrine revealed large crystalline blocks characterizing its identity and crystalline character. The photomicrograph of S-SNEDDS indicated uniform surface. Artemether and lumefantrine crystals adhered on the surface of Neusilin US2 suggested that the entire drug was distributed on the adsorbent uniformly over the carrier mass and well-separated particles with no agglomeration. The reduced crystallinity of artemether and lumefantrine in formulation was further confirmed from the results of XRD and DSC studies. SEM photonicrographs of artemether, lumefantrine and S_SNEDDS is shown in fig. 4.
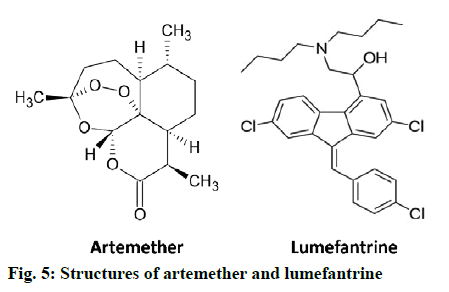
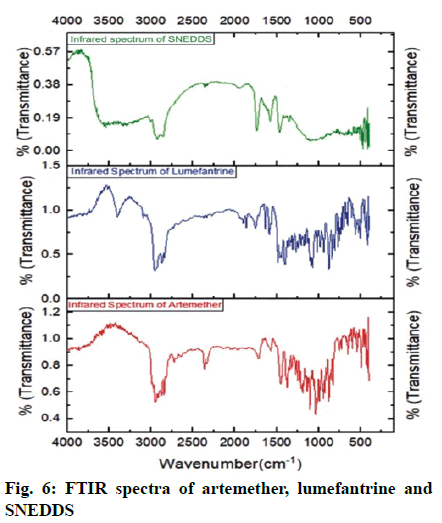
FTIR was carried out to evaluate the drug excipient compatibility. The FTIR spectra of artemether and lumefantrine revealed the presence of major functional groups present in structure supporting their identity (Table 4). FTIR spectrum of S-SNEDDS revealed that there was no considerable change in major peaks when compared to FTIR of pure drugs and excipient. which confirmed that there was no modification or interaction between drugs and excipients (Table 5). Thus, there was no chemical interference of functional groups and properties of drugs, respectively. Structure of artemether and lumefantrine is shown in fig. 5 and the FTIR Spectra of artemether, lumefantrine and S-SNEDDS are shown in fig. 6.
| Drugs | Group | Wavenumber (cm-1) | Stretching/deformation |
|---|---|---|---|
| Artemether | -CH2 , -CH3 | 2949.30 | Stretching aliphatic |
| C-O-C | 1157.3 | Stretching (ether linkage) | |
| -CH2 , -CH3 | 1375.38-1450.77 | Bending vibrations | |
| =C–H | 651.22 | Bending | |
| Lumefantrine | O-H | 3402.70 | Aromatic stretching |
| C-O | 1155.86 | Stretching | |
| C-H | 2955.75 | Aliphatic stretching | |
| C-H | 3094 | Aromatic stretching |
Table 4: Interpretation of Ftir Spectra of Artemether and Lumefantrine
| Drugs | Group | Wavenumber (cm-1) | Stretching/deformation |
|---|---|---|---|
| Artemether | -CH2,-CH3 | 2927.54 | Aliphatic stretching |
| C-O-C | 1157.3 | Ether stretching | |
| -CH2,-CH3 | 1351.43-1464.84 | Bending vibrations | |
| =CH-H | 956.98 | Alkene bending | |
| Lumefantrine | C-H | 3009.570 | Aromatic stretching |
| C-O | 1139.22 | Stretching | |
| C-H | 2855.07 | Aliphatic stretching | |
| C=C | 1575.43 | Aromatic stretching |
Table 5: Interpretation of Ftir Spectrum of Artemether and Lumefantrine in Snedds
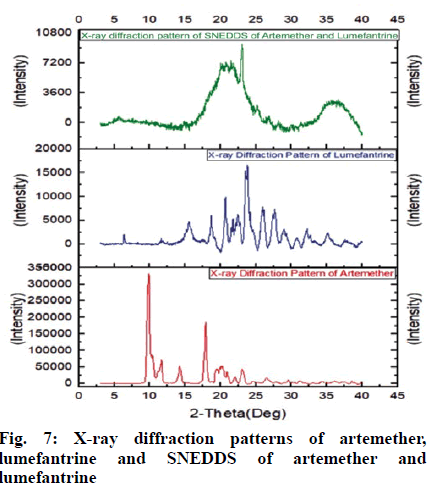
The X-ray diffractogram of artemether verified the physical nature of artemether; which represented numerous intense and sharp multiple peaks corresponding to the crystalline nature of the drug. The XRD patterns of artemether showed very strong characteristic diffraction peaks at 2θ of 9.88°, 17.64º, 18.04º and 19.68º. It signified that artemether is purely a crystalline compound. The XRD of lumefantrine indicated specific peaks of crystallinity at 2θ of 6.9º, 8.5º, 10.5º, 12.91º, 13.64º, 18.12º, 19.21º, 20.72º, 21.6º and 32.14º also indicating its crystalline nature.
X-ray diffraction pattern of S-SNEDDS of artemether and lumefantrine verified the physical state of these drug in S-SNEDDS. Pure drugs gave sharp peaks, which indicated highly crystalline nature, whereas formulation did not showed significant crystalline peaks of these drugs and prepared SNEDDS exhibited a reduction in both number and intensity of peaks. The conversion of crystalline drugs in to amorphous state was confirmed due to diffused pattern observed in X-ray crystallography of SNEDDS. Hence, it was confirmed that the molecularly dispersed state of artemether and lumefantrine in the formulation and its effective solubilization. X-ray crystallographs of artemether, lumefantrine and S-SNEDDS is shown in fig. 7.
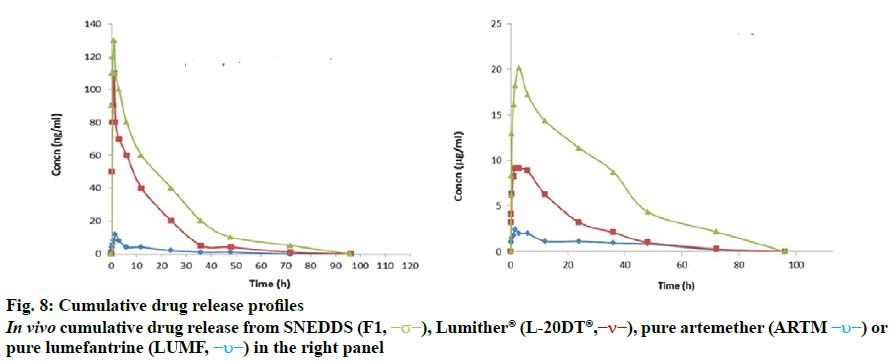
In vivo bioavailability study of artemether and lumefantrine, S-SNEDDS and marketed formulation was performed to obtain the AUC (area under the plasma concentration time curve up to the last quantifiable concentration) and Cmax (observed maximum plasma concentration) following oral administration and is depicted in fig. 8. Formulation SNEDDS F1, artemether, lumefantrine and marketed formulation Lumither® were used in this study. The tmax values of artemether and lumefantrine were statistically similar across the formulation groups. The Cmax and AUC value of drugs following oral administration of SNEDDS were significantly higher than that of the Lumither® and artemether and lumefantrine. In vivo drug release study of SNEDDS, Lumither® and pure drug Artemether and Lumefantrine is shown in Table 6.
| Formulation/drugs | Parameters | ||||
|---|---|---|---|---|---|
| Cmax (mg/ml) | Tmax (h) | AUC0-72h | t1/2 (h) | ||
| Artemether | Artemether | 13.11±2.22 | 3.1±1.92 | 192.11±98.22 | 2.21±2.01 |
| Lumither® | 110.31±40.88 | 92.9±1.82 | 390.66±132.44 | 2.26±1.89 | |
| SNEDDS | 110.31±40.88 | 2.9±1.45 | 598.89±114.33 | 2.52±1.42 | |
| Lumefantrine | Lumefantrine | 2.39±1.61 | 6.1±1.51 | 68.71±18.63 | 114.16±2.21 |
| Lumither® | 8.12±2.16 | 5.8±1.4 | 93.51±13.22 | 115.38±3.98 | |
| SNEDDS | 18.22±2.32 | 6.3±1.54 | 190.82±36.57 | 116.61±3.66 | |
Mean±SD, n=5
Table 6: Pharmacokinetic Parametersof Snedds (F1), Lumither®, Artemether and Lumefantrine
It was found that during the first 1 h artemether released from the SNEDDS was the highest as compared to pure artemether and Lumither® and it was the highest till 72 h. Thus, it can be concluded that there was tenfold increase in bioavailability of artemether from SNEDDS formulation as compared to pure artemether and its marketed formulation Lumither®. It was observed that during the first 1 h lumefantrine release from the SNEDDS was the highest as compared to pure lumefantrine and Lumither® and showed high till 72 h. Thus, there was ten-fold increase in bioavailability of lumefantrine from the SNEDDS formulation as compared to pure lumefantrine. These studies indicated that drug diffused at a faster rate from the SNEDDS as compared to the pure drug and marketed formulation due to smaller particle size of micro emulsion and enhanced solubility of drug and thereby resulted in increased bioavailability.
The solid SNEDDS produced showed beneficial characteristics of self-emulsifying system due to enhanced surface area with formation of nano particles, which enhanced diffusion, surfactants enhanced mucosal permeability and absorptivity in lymphatic fluid[27]. Results of stability studies of capsules containing S-SNEDDS at 40±2º and 75±5 % RH indicated stability of formulation. The percent drug content was found to be 98.78±0.81, 97.04±0.43, and 97.32±0.21% for artemether and 98.53±0.33, 98.32±0.61, and 97.65±0.76% for lumefantrine at the end of 1, 3 and 6 months, respectively. It may be concluded that the liquid and S-SNEDDS of artemether and lumefantrine were successfully formulated using components which imparted higher thermodynamic stability due to its small particles size leading to higher drug release.
Accurate drug loading into system imparted easy reproducibility and justified its applicability. Thus, the problem of efficiently delivering poorly water soluble drugs could be rectified by innovative lipid-based drug delivery system to increase solubility and in turn bioavailability. Hence, solid self-nano emulsifying system is a useful technology for oral delivery of artemether and lumefantrine.
Acknowledgements
The authors are thank Zims, Abitec, BASF and Merck for providing gift samples. Authors are grateful to Drs. Naresh Gaikwad, Anwar Daud and Rajesh Bahekar for providing research facilities and to the UGC for providing financial assistance during the research project.
References
- Sanghai B, Aggarwal G, Harikumar S. Solid self microemulsifying drug delivery system: A review. J Drug Deliv Ther 2013;3:168-74.
- Gupta E, Barends DM, Yamashita E, Lentz KA, Harmsze AM, Shah VP, et al. Review of global regulations concerning biowaivers for immediate release solid oral dosage forms. Eur J Pharm Sci 2006;29: 315-24.
- Yeung P, Hubbard J, Korchinski E, Midha, K. Pharmacokinetics of chlorpromazine and key metabolites. Eur J Clin Pharmacol 1993;45:563-9.
- Kassem A, Mohsen M, Ahmed S, Essam M. Self-nanoemulsifying drug delivery system (SNEDDS) with enhanced solubilization of nystatin for treatment of oral candidiasis: Design, optimization, in vitro and in vivo evaluation. J Mol Liq 2016;218:219-32.
- Hou J, Sun E, Zhang Z, Wang J, Yang L, Cui L, et al. Improved oral absorption and anti-lung cancer activity of paclitaxel-loaded mixed micelles. Drug Deliv 2017;24(1):261-9.
- Zhang B, Xue A et al. Bile salt liposomes for enhanced lymphatic transport and oral bioavailability of paclitaxel. Pharmazie 2016;71(6):320-6.
- Zhang T, Luo J, Fu Y, Li H, Ding R, Gong T et al. Novel oral administrated paclitaxel micelles with enhanced bioavailability and antitumor efficacy for resistant breast cancer. Colloid Surf B Biointerfaces 2016;150:89-97.
- Pooja D, Kulhari H, Kuncha M, Rachamalla SS, Adams DJ, Bansal V, et al. Improving efficacy, oral bioavailability, and delivery of Paclitaxel using protein-grafted solid lipid nanoparticles. Mol Pharmaceut 2016;13(11):3903-12.
- Ding D, Sun B, Cui W, Chen Q, Zhang X, Zhang H, et al. Integration of phospholipid-drug complex into self-nanoemulsifying drug delivery system to facilitate oral delivery of Paclitaxel Asian J Pharm Sci 2019;14(5):552-8.
- Baloch J, Sohail MF, Sarwar HS, Kiani MH, Khan GM, Jahan S et al. Self-Nanoemulsifying Drug Delivery System (SNEDDS) for Improved Oral Bioavailability of Chlorpromazine: In Vitro and In Vivo Evaluation. Medicina 2019;55(5):210.
- Xue X, Cao M, Ren L, Qian Y, Chen G. Preparation and Optimization of Rivaroxaban by Self-Nanoemulsifying Drug Delivery System (SNEDDS) for Enhanced Oral Bioavailability, AAPS PharmSciTech 2018;19;1847-59.
- Majed A, Mohsin K, Fars A.Novel oral dosage regimen based on self nanoemulsifying drug delivery systems for codelivery of phytochemicals Curcumin and Thymoquinone. Saudi J of Pharma Sci 2019;27(6):866-76.
- Craft C. Challenges facing drug development for malaria. Curr Opin Microbiol 2008;1:428-33.
- Ojurongbe O, Lawal O. Efficacy of Artemisinin combination therapy for the treatment of uncomplicated falciparum malaria in Nigerian children. J Infect Dev Ctries 2016;7:975-82.
- Patil S, Suryavanshi S, Pathak S, Sharma S, Patravale V. Evaluation of novel lipid based formulation of β-Artemether and Lumefantrine in murine malaria model. Int J Pharm 2013;455: 229-34.
- Quique Bassat. The Use of Artemether-Lumefantrine for the Treatment of Uncomplicated Plasmodium vivax Malaria .PLoS Negl Trop Dis 2011;5(12):e1325.
- Prado GRLD, García CH, Cea LM, Espinilla VF, Moreno MMF, Márquez AD, et al. Malaria in developing contries. J Infect Dev Ctries 2014;8(1):1-4.
- Lissinda S, Katya G, Paolo D. In vivo efficacy and bioavailability of Lumefantrine: Evaluating the application of Pheroid technology. Eur J Pharm Biopharm 2015:97; 68-77.
- Schinazom A et al. Formulation design, in vitro Characterization and antimalarial investigations of Artemether and Lumefantrine entrapped solid lipid Microparticles. Drug develop Ind Pharm 2016:42.
- Bandivadikar M, Pancholi S. Preparation and characterization of solid SMEDDS by adsorbent technique to improve dissolution profile of poorly aqueous soluble drug Ramipril. IJPR 2011;2(6):85-90.
- Sheikh S, Faiyez S. Development and bioavailability assessment of Ramipril nano emulsion formulation. Eur J Pharm Biopharm 2007;66(2):227-43.
- Patel K, Sharma V, Vavia P. Design and evaluation of Lumefantrine-Oleic acid self-nanoemulsifying ionic complex for enhanced dissolution. Daru 2013;21(1):27.
- Kumari A, Kumar A, Kumari H. Development, Characterization and evaluation of solid dispersions of Artemether and Lumefantrine by solvent evaporation method using hydrophilic polymers. Int J of Pharm and Pharma Sci 2014;6(2):180-5.
- Rawat M, Jain A, Singh S. Studies on binary lipid matrix based solid lipid nanoparticles of Repaglinide: In vitro and in vivo evaluation. J Pharm Sci 2011;100: 2366-78.
- Hussain A, Shakeel F, Singh SK, Alsarra IA, Faruk A, Alanazi FK, et al. Solidified SNEDDS for the oral delivery of Rifampicin: Evaluation, proof of concept, in vivo kinetics, and in silico GastroPlus simulation. Int J Pharm 2019:566;203-17.
- Fule R, Dhamecha D. Development of hot melt co-formulated antimalarial solid dispersion system in fixed dose form (ARLUMELT): Evaluating amorphous state and in vivo performance. Int J Pharm 2015;496:137-56.
