- *Corresponding Author:
- N. Sharma
National Institute of Pharmaceutical Education and Research-Ahmedabad (Ministry of Chemicals and Fertilizers, Government of India), Gandhinagar, Gujarat 382355, India
E-mail: nitish.sharma@niperahm.res.in
| Date of Received | 20 May 2022 |
| Date of Revision | 13 February 2023 |
| Date of Acceptance | 14 July 2023 |
| Indian J Pharm Sci 2023; 85(4):1068-1076 |
This is an open access article distributed under the terms of the Creative Commons Attribution-NonCommercial-ShareAlike 3.0 License, which allows others to remix, tweak, and build upon the work non-commercially, as long as the author is credited and the new creations are licensed under the identical terms
Abstract
Method development for synthetic peptide molecules is often a challenging task as peptides get easily degraded in mild stress conditions and also offer chromatographic challenges like carryover, peptide loss during chromatographic run and adsorption of the drug onto the walls of the storage container. This article presents an easy, accurate and reproducible stability-indicating, mass compatible Reverse Phase-Liquid Chromatographic method for the detection of liraglutide in bulk active pharmaceutical ingredient. The stress conditions chosen for the study (hydrolytic, oxidative, photolytic and thermal) were as per the International Council for Harmonization guideline. Chromatographic separation of liraglutide from its degradation products was achieved on a bioZen™ 2.6 μm Peptide XB-C18 100 Å, liquid chromatography column 150×4.6 mm, using ammonium formate buffer (pH 3.0) and acetonitrile (0.1 % formic acid) as the mobile phase in gradient elution mode. The elution was carried out at a flow rate of 0.7 ml/min. Detection of liraglutide and its degradants were monitored at 215 nm. Liraglutide was found to degrade significantly in hydrolytic, oxidative and thermal stress conditions. Apart from stress testing, adsorption study for liraglutide was performed using 5 different types of containers. Also, several buffers/diluents were screened to reduce the carryover of active pharmaceutical ingredient in subsequent chromatographic runs.
Keywords
Reversed-phase liquid chromatography, stress study, liraglutide, degradation, stability indicating purity method
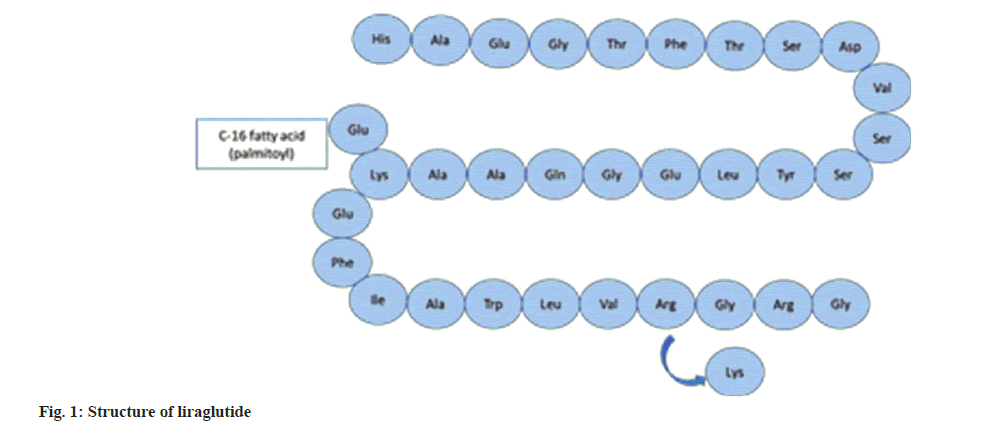
Liraglutide is a recombinant Deoxyribonucleic Acid (DNA)-based polypeptide analog of Glucagon-Like Peptide-1 (GLP-1) used in the treatment of type 2 diabetes mellitus, obesity and chronic weight management. The amino acid sequence of liraglutide is 97 % similar to that of GLP-1 with the replacement of lysine residue at position 27 with arginine and addition of a fatty acid chain to remaining lysine through a glutamic acid spacer. Liraglutide is commercially marketed as victoza which is a subcutaneous injection prescribed once daily[1,2]. The structure of liraglutide is depicted in fig. 1.
Peptide molecules are moving up in the list of most explored molecules as they provide better safety and less toxicity due to their uniqueness, like their structural similarities as that of the endogenous peptides/proteins which minimizes the chances of hypersensitivity reactions[3,4]. But at the same time, they are more susceptible to environmental stress condition. Therefore, development of stability indicating purity method plays an important role in maintaining the quality and safety aspect of peptides. Stability testing is used to determine how the quality of a drug substance changes over time as a result of different environmental factors such as temperature, humidity and light and it also aids in the formulation of appropriate storage settings and shelf life recommendations[5,6]. The overall degradation pattern of protein/peptide depends on the sequence of amino acids and other functional groups. Stress testing of peptides are generally initiated from milder conditions as compared to small molecules because peptides are more sensitive to environmental stress like hydrolytic oxidative, thermal stress etc[7,8].
Present work was designed to develop and validate a simple and precise stability indicating method on Reverse Phase-High Performance Liquid Chromatography (RP-HPLC) which exhibits minimum carryover effect. A literature survey for Liraglutide revealed that there is no stability indicating method reported till now. Also, suitable container closure system was suggested for the storage of drug solution to reduce adsorption of Active pharmaceutical ingredient (API) onto the walls of the container.
Materials and Methods
Reagents and solvents:
Liraglutide, API was obtained as a gift sample from Slayback Pharma (India). High Performance Liquid Chromatography (HPLC) grade Acetonitrile (ACN), Hydrochloric acid (HCl), tris base (Hydroxymethyl aminomethane) and Hydrogen peroxide (H2O2) solution (30 %) were purchased from Thermo Fisher scientific. Ammonium formate and sodium hydroxide (NaOH) were purchased from (Sigma Aldrich). Formic acid was purchased from Merck life Science Pvt. Ltd. The ultra-pure water used for the experiments was generated in-house with a Merck Millipore Milli-Q (Synergy UV) system (Massachusetts, U.S).
Instrumentation and chromatographic condition:
Accurate weighing of API and buffer for mobile phase was done using Mettler Toledo weighing balance (XS205). pH of the mobile phase buffer was adjusted through calibrated Eutech Scientific pH meter (pH 510). For samples to be kept at 25°/60 % RH, stability chamber from Thermolab Scientific (TH 200/G) was used at controlled temperature and humidity. For samples to be kept at 2-8°, refrigerator from VestFrost Solutions (R134a) was used at a controlled temperature. A photostability chamber by Newtronics Lifecare Pvt. (NLPSH8SI) Ltd equipped with Ultraviolet (UV) and visible light sources at regulated temperature and humidity was used for the photolytic stress study. Other minor equipments used during study were sonicator from Antech, vortex shaker from Spinix and micro-pipettes from Eppendorf. The sample analysis through HPLC for degradation study was performed on an Agilent 1260 Infinity II equipped with a quaternary pump (DEAEU02368), autosampler (DEAEQ40962), and a Diode-Array Detector (DAD) (DEAC614413) with Phenomenex Biozen peptide XB-C18 column (150×4.6mm, 2.6 μm, Pore size-100 Å). The mobile phase-A consisted of 10 mm ammonium formate adjusted to pH 3.0 with formic acid and the mobile phase-B consisted of 0.1 % formic acid in ACN. The desired chromatographic separation was achieved using following gradient program (Time(min)/Solvent % B): 0/5, 5/10, 25/30, 55/50, 60/60, 65/70, 75/90, 75.10/5 and 85/5. The flow rate was set at 0.7 ml/ min, the injection volume was 10 μl and 215 nm wavelength was chosen for the detection with the PDA scan from 190 nm-400 nm. Table 1 depicts the final chromatographic conditions for the study.
| HPLC system | Agilent 1260 Infinity II |
|---|---|
| Column | Biozen peptide XB-C18 (150×4.6 mm, 2.6 μm, Pore size-100 Å) |
| Mobile phase | A: 10 mM Ammonium Formate Buffer (pH 3.0) |
| B: Acetonitrile (0.1 % Formic acid) | |
| Flow rate | 0.7 ml/min |
| Detector wavelength | 215 nm |
| Column oven temperature | 35° |
| Injection volume | 10 µl |
| Elution | Gradient |
| Diluent | Water |
| Carryover solution | Tris buffer |
Table 1: Final Chromatographic Condition
Methodology for stress degradation study:
A forced degradation study was performed on liraglutide standard solution in presence of hydrolytic, oxidative, photolytic and thermal stress as per the ICH guideline Q1A (R2) (ICH Q1A(R2), 2003)[9]. The stress conditions were optimized to get optimum degradation (5 %-20 %). The stock solution of liraglutide (2 mg/ml) was diluted with the stressor to obtain a final concentration of 1 mg/ml. The entire study was performed with solution phase samples. For HPLC analysis, stressed samples were withdrawn at zero time point and at the end the study and were analysed through the developed RP-HPLC method.
Preparation of 10 mm ammonium formate buffer (pH 3.0):
For the preparation of 10mM ammonium formate buffer, 630 mg of ammonium formate was accurately weighed and transferred to 1000 ml volumetric flask. Volume was made up with milli-Q water and pH was adjusted to 3.0 using formic acid (previously diluted to 10 times using milli-Q water). The buffer solution was then filtered through 0.2 μm filter paper.
Preparation of standard stock solution:
Standard stock solution of liraglutide was prepared by dissolving 20 mg of liraglutide in 10 ml of milli-Q water producing final concentration of 2 mg/ml for routine analysis.
Preparation of 6 % H2O2 solution for oxidative stress study:
From the marketed H2O2 solution (30 %), 1 ml was transferred into a 5 ml volumetric flask and volume was made up using Milli-Q water.
Preparation of 100 mM tris buffer (pH 8.1):
120 mg of tris buffer was accurately weighed and transferred to 10 ml of volumetric flask. Volume was made up with Milli-Q water and pH was adjusted to 8.1[10] using HCl solution (10 times diluted).
Hydrolytic degradation:
For hydrolysis, 1 ml of standard stock solution was taken into a 2 ml volumetric flask. The volume was made up with 0.2 M hydrochloric acid for acid hydrolysis, and with 0.02 M sodium hydroxide solution for base hydrolysis. The solutions were prepared in duplicate. One of the sets was kept at 25°/75 % RH for 3 d and the other was kept at 2-8° for 7 d.
For neutral samples, same procedure was followed with Milli-Q water as diluent. The solutions were prepared in duplicate. One of the sets was kept at 25°/75 % RH for 5 d and the other was kept at 2-8° for 7 d.
Oxidative degradation:
For oxidative stress, 1 ml of standard stock solution was taken into 2 ml volumetric flask and volume was made up with previously prepared hydrogen peroxide solution (section 2.3.3). The solutions were prepared in duplicate. One of the sets was kept at 25°/75 % RH for 2 d and the other was kept at 2-8° for 7 d.
Photolytic degradation:
For UV photolytic stress, 1 ml of standard stock solution was taken in duplicate in two separate watch glass dishes (65 mm). One of the watch dishes was covered with aluminium foil (control) and the other was kept uncovered in the photostability chamber. Both the watch glasses were subjected to UV irradiation of 200 Wh/s for 7 d. For visible exposure, same preparation procedure was followed and all the samples were subjected to visible irradiation of 1.2 million lux h for 7 d. After the specified time interval, the solution was diluted with water to obtain a final concentration of 1 mg/ml.
Thermal degradation:
For thermal stress, 1 ml of standard stock solution was taken into a 2 ml volumetric flask and volume was made up with milli-Q water to obtain final concentrations of 1 mg/ml. These samples were then exposed to dry heat (40°) in an oven for 24 h.
Adsorption and carryover study:
For the adsorption study, five different types of containers were selected i.e., volumetric flask (type A glass and type B glass), micro centrifuge tube (polypropylene), radioimmunoassay tube (polystyrene) and HPLC vial (type A glass). In each of these containers, about 1 ml of 2000 ppm freshly prepared liraglutide solution was added. Simultaneously from the same 2000 ppm freshly prepared stock solution, 5 μl sample was injected into the HPLC system and the data was recorded as the 0 time point sample.
The samples in the containers were then analyzed by HPLC at different time interval, i.e., 1 h, 12 h, 24 h and 48 h and area response of liraglutide peak at each time point was observed and compared with that the response at zero time point. The containers whose sample depicted a reduction in area were selected, and into them 100 μl of 0.9 % NaCl solution was added in order to extract the adsorbed liraglutide. These samples were reanalysed again and increase in the area indicates the recovery of adsorbed drug back into the diluent.
During the method development, it was observed that subsequent runs depicted variability in the peak area. It was suspected that it could be due to the carryover of the active substance. Hence, to eliminate the carryover effect, different strategies were tried like adding 30 % ACN or 10 % methanol to the sample diluent (water). Also, solutions of 10 mM phosphate buffer (pH 7.2) and 100 mM tris buffer (pH 8.1) were tried by injecting them separately after the sample injection. 100 μl of the carryover solution was injected in triplicate following the sample analysis and the carryover effect was determined by running blank solution.
Validation of stability indicating method:
The developed stability indicating analytical method for GLP-1 analog, Liraglutide was validated for system suitability along with linearity, precision, accuracy and robustness as per the ICH guideline.
Validation parameters:
The system's suitability was tested by injecting five replicates of 1000 ppm solution of liraglutide. Linearity was performed by making six different dilutions containing different concentrations of Liraglutide. For linearity, samples of 10 ppm, 50 ppm, 100 ppm, 250 ppm, 500 ppm and 1000 ppm were prepared, area response at each concentration was recorded and slope, intercept and correlation coefficient were calculated. Precision was performed by injecting six injections of 500 ppm, the area at every replicate was recorded and relative percentage deviation was calculated. When a method is applied repeatedly for many samplings of a homogenous sample, the precision of the method is the degree of agreement among individual test findings. Accuracy was carried out at three concentrations, i.e., 250 ppm, 500 ppm and 750 ppm. Three replicates of each concentration were injected, the area response of every replicate was recorded and relative percent deviation and percent recovery were calculated. The robustness study was carried out by slight deviation in column compartment temperature (35°±2°), flow rate (0.7 ml/min±0.07 ml/min) and pH of the mobile phase buffer (3.0±0.2). The relative percent deviation was calculated to see the capacity of the method to remain unaffected by small but deliberate changes in method parameters so that it can show method reliability during normal usage.
Results and Discussion
ASuitable liquid chromatography coupled with diode array detection method was developed with an objective to separate liraglutide from its major degradation peaks. Liraglutide and its degradation products were analyzed with bioZen™ 2.6 μm Peptide XB-C18 100 Å, LC Column 150×4.6 mm column. Among the different mobile phases tried, 10 mM ammonium formate buffer (pH 3) and 0.1 % formic acid in acetonitrile showed optimum separation of liraglutide and its degradation products. As liraglutide has an isoelectric point of 4.87, mobile phase pH of 3 was selected so as to maintain sufficient charge on peptide and to enhance the retention of peptide onto the stationary phase. The BiozenTM column selected has pH stability in the range of 1.5 to 12. The absorbance of liraglutide was recorded in the range of 190 to 400 nm and 215 nm was selected for detection because the highest UV absorbance of liraglutide was observed at this wavelength. The flow rate of 0.7 ml/min and injection volume of 10 μl were found to be suitable for separation. The active peak was eluted between the retention time of 58- 64 min. Among various trials for chromatographic method development, this method was found to be better for analysis. The method development trials are summarized in Table 2.
| S No. | Column used | Mobile phase | Diluent | Observation | Result |
|---|---|---|---|---|---|
| 1 | Peptide column C18,300 Å | 0.1 % FA in Water: 0.1 % FA in ACN | Water | Peak shape and resolution were not optimum | Method rejected |
| 2 | Biozen peptide C18,100 Å | 0.1 % FA in water: 0.1 % FA in ACN | Water | Peak shape improved but resolution was not optimum | Method rejected |
| 3 | Biozen peptide C18,100 Å | Disodium phosphate buffer: 0.1 % FA in ACN | Water | Overall chromatogram was not appropriate | Method rejected |
| 4 | Biozen peptide C18,100 Å | Ammonium formate: 0.1 % FA in ACN (pH unadjusted) | Water | Peak shape was not good | Method rejected |
| 5 | Biozen peptide C18,100 Å | Ammonium formate: 0.1 % FA in ACN (pH 3) | Disodium phosphate buffer | Resolution did not improve | Method rejected |
| 6 | Biozen peptide C18,100 Å | Ammonium formate: 0.1 % FA in ACN (pH 3) | Water+10 % ACN | Significant tailing was observed | Method rejected |
| 7 | Biozen peptide C18,100 Å | Ammonium formate: 0.1 % FA in ACN (pH unadjusted) with 10 % methanol | Water | Peak shape was not improved | Method rejected |
| 8 | Biozen peptide C18,100 Å | Ammonium formate: 0.1 % FA in ACN (pH adjusted-3) with 0.1 % FA | Water | Peak shape was good and chromatogram was well resolved | Method accepted |
Table 2: Method Development Trials
The conditions shown in the final RP-HPLC method were used to analyze the liraglutide samples which were subjected to various stress conditions such as hydrolysis, oxidative stress, photolytic conditions and thermal degradation. The results of degradation studies are discussed below.
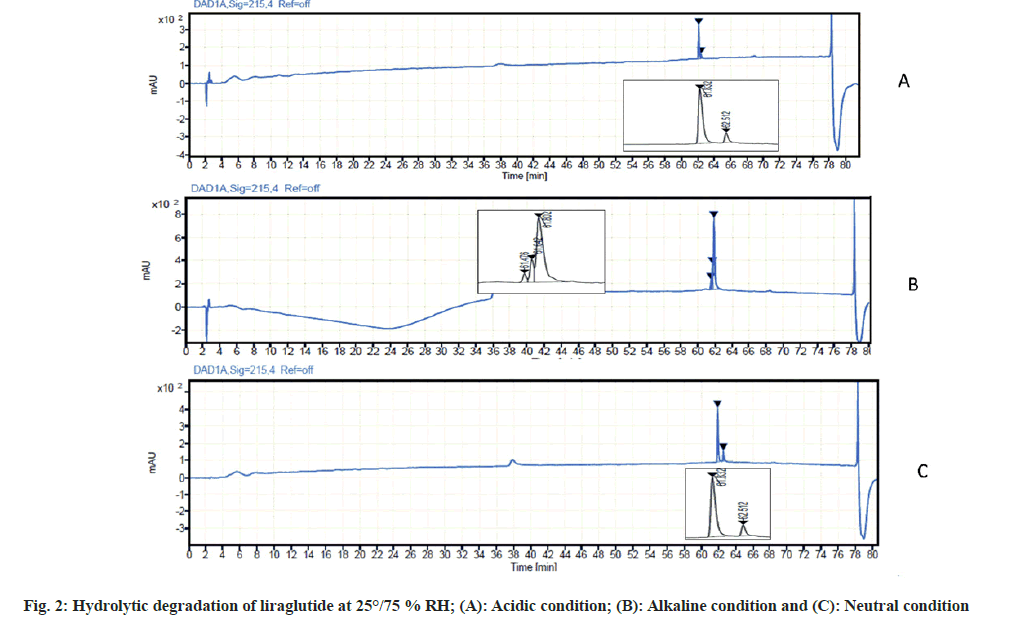
Liraglutide hydrolysis in acidic condition was slower as compared to alkaline conditions. In 0.01 M of HCl, no degradant peaks were observed. When the concentration of HCl was increased up to 0.1 M HCl, 12 % degradation of the drug was observed in samples kept at 25° for 3 d.
Liraglutide is somewhat more sensitive to alkaline hydrolysis. In a solution of 0.01 M sodium hydroxide, two degradant peaks were observed in samples kept at 25°/75 % RH for 3 d which resulted in overall degradation of 16 %.
At neutral condition, i.e., in presence of water as a stressor, a higher rate of hydrolysis was observed resulting in overall degradation of 20 % in samples kept at 25°/75 %RH for 5 d. The result of hydrolytic degradation is depicted in fig. 2.
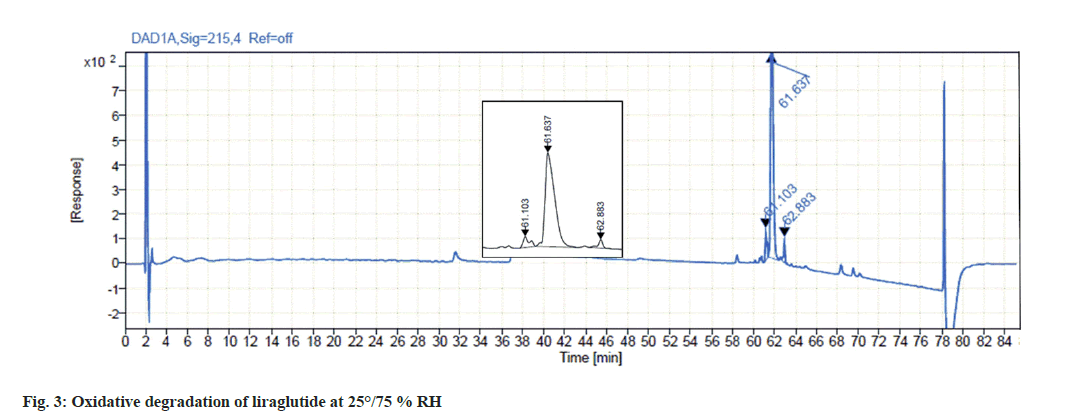
Liraglutide was found to get highly degraded by 3 % hydrogen peroxide solution. Analysis of the stressed sample indicates the formation of two major degradation products in 2 d which summed up to approximately 15 % degradation which is depicted in fig. 3.
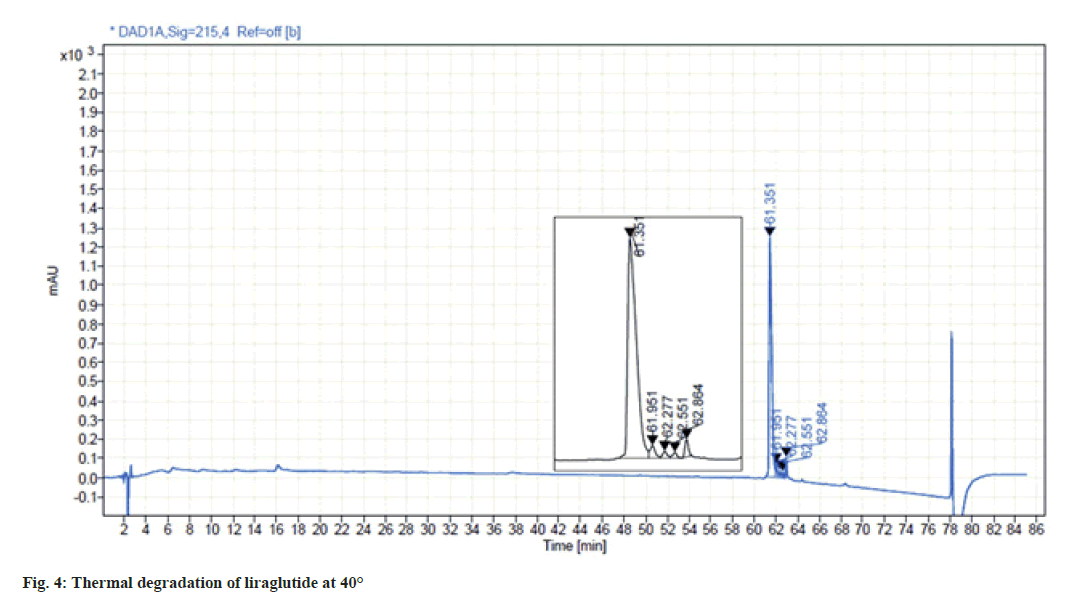
Liraglutide solution was found to be highly sensitive to thermal stress. When the sample solution was subjected to stress at 40° for 24 h, four degradants were observed resulting in 14 % of total degradation. The chromatogram for thermal degradation is shown in fig. 4.
Liraglutide was found to be stable in both UV and visible light exposure. A similar chromatogram was observed for both the control sample as well test sample which indicates no degradation in photolytic condition in 7 d (6 cycles of UV and 1.5 cycles of visible). Table 3 depicts the stress condition for the study and the corresponding results.
| Stress condition | Stressor | Temperature | Time duration | Observation |
|---|---|---|---|---|
| Acidic Hydrolysis | 0.1 M HCl | 25° | 3 d | 12 % DP |
| Alkaline Hydrolysis | 0.01 M NaOH | 25° | 3 d | 16 % DP |
| Neutral Hydrolysis | Water | 25° | 5 d | 20 %DP |
| Oxidative condition | 3 % H2O2 | 25° | 2 d | 15 % DP |
| Thermal condition | Temperature | 40° | 1 d | 14 % DP |
| Photolytic conditions | UV and visible light | 25° | 7 d | No degradation was found |
Table 3: Stress Conditions and Results for the Study
The adsorption study was carried out using five different containers. It was observed at the end of the study (after 48 h) that samples stored in plastic container (Radioimmunoassay (RIA) tubes and (Mitocryptide) MCT tubes) showed a significant reduction in response of active peak indicating adsorption of drug onto the plastic surface. To recover the adsorbed liraglutide back into the solution, 100 μl of 0.9 % NaCl solution was added in RIA tube and MCT. These samples were reanalysed by the same chromatographic method. A linear increase in area was observed as per the concentration of the solution which indicates NaCl solution helps in the recovery of liraglutide from the surface of the plastic container. Also, more adsorption was observed with polystyrene as compared to that with polypropylene. The result summary for adsorption study is depicted in Table 4. During the carryover study, when 100 μl volume of tris buffer was injected in triplicate after the sample injection, a significant reduction in carryover was observed in subsequent blank runs.
| Glassware/plastic wares | Material of construction | Area at 0 interval (mAU) | Area after 48 (mAU) | Result | Area after addition of sodium chloride (mAU) |
|---|---|---|---|---|---|
| Volumetric flask A | Type A glass | 21164.699 | 21025.321 | No adsorption | Not Applicable |
| Volumetric flask B | Type B glass | 20987.213 | No adsorption | Not Applicable | |
| RIA vials | polystyrene | 13390.38 | Adsorption | 18719.187 | |
| Micro centrifuge tube | polypropylene | 15303.564 | Adsorption | 19089.021 | |
| HPLC Vials | Type A glass | 21131.215 | No adsorption | Not Applicable |
Table 4: Results of Adsorption Study
The percent relative standard deviation (% RSD) from five replicate injections of standard preparation was found to be 1.77 %, tailing factor for liraglutide peak was 1.2 (should be ≤2.0) and theoretical plates obtained was 1176140(should be ≥10000).
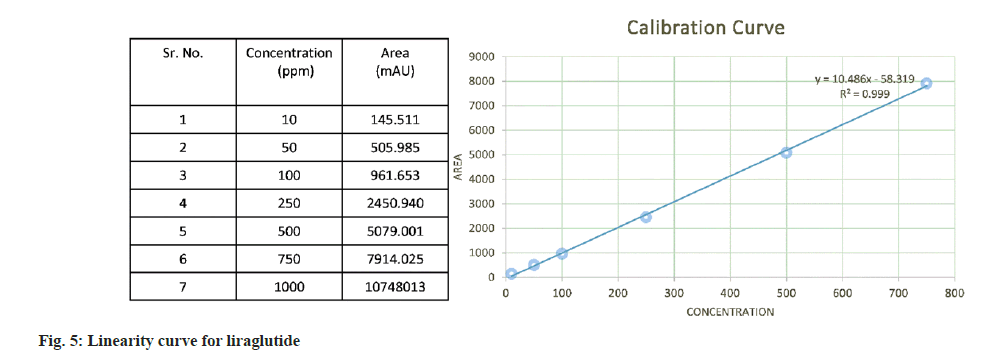
The calibration curve showed good linearity in the range of 10 ppm to 1000 ppm with regression coefficient of 0.999. The area vs. concentration values and the calibration curve are depicted in fig. 5.
Precision was determined by 6 replicate injections of fixed concentration (500 ppm) of liraglutide and the area response of each replicate was recorded. The relative standard deviation calculated was 1.77 %. The results of precision study are summarized in Table 5.
| S No. | Area (mAU) | Concentration (ppm) |
|---|---|---|
| 1 | 4779 | 500 |
| 2 | 4857 | 500 |
| 3 | 4791 | 500 |
| 4 | 4799 | 500 |
| 5 | 4982 | 500 |
| 6 | 4740 | 500 |
| Average | 4824.66 | |
| Standard deviation | 85.84 | |
| % Relative standard deviation | 1.77 % | |
Table 5: Precision Data For Proposed Rp-Hplc Method
The accuracy of the method was determined at 3 concentrations (250 ppm, 500 ppm and 750 ppm). The mean recovery for 250 ppm, 500 ppm and 750 ppm solution was found to be 97.98 %, 99.39 % and 103.27 % respectively. The percent RSD for 250 ppm, 500 ppm and 750 ppm solution was calculated to be 0.17 %, 1.85 % and 1.95 % respectively. The results of accuracy are summarized in Table 6.
| Injected concentration (ppm) | Replicates | Recovery(ppm) | Mean recovery (%) | RSD (%) |
|---|---|---|---|---|
| 250 PPM | 1 | 244.83 | 97.98 | 0.17 |
| 2 | 245.51 | |||
| 3 | 244.54 | |||
| 500 PPM | 1 | 487.14 | 99.39 | 1.85 |
| 2 | 505.03 | |||
| 3 | 498.78 | |||
| 750 PPM | 1 | 763.13 | 103.27 | 1.95 |
| 2 | 782.28 | |||
| 3 | 793.26 |
Table 6: Accuracy Results for Proposed Rp-Hplc Method
Slight deliberate changes in column compartment temperature, flow rate and pH of buffer solution were made to evaluate the impact of change on the method. The results of robustness study for slight change in column temperature, flow rate and pH, was found to be well within the limit which is depicted in Table 7.
| Parameters | Optimized value | Changed parameters | Retention time of API (min) | USP theoretical plates | USP tailing factor |
|---|---|---|---|---|---|
| Flow rate | 0.7 ml/min | 0.63 ml/min | 61.91 | 1172145 | 1.7 |
| 0.70 ml/min | 61.21 | 1177975 | 1.2 | ||
| 0.77 ml/min | 60.9 | 1152189 | 1.1 | ||
| Column oven Temperature | 35° | 33° | 61.41 | 1102769 | 1.7 |
| 35° | 61.22 | 1172145 | 1.2 | ||
| 37° | 61.13 | 1133769 | 1.2 | ||
| pH of mobile phase | 3 | 2.8 | 61.21 | 1162456 | 2 |
| 3 | 61.22 | 1177975 | 1.2 | ||
| 3.2 | 61.31 | 1132041 | 1.3 |
Table 7: Robustness Results for the Proposed Method
Thus, in the proposed research, a simple accurate and reproducible stability indicating purity method was developed for liraglutide. The method was validated as per ICH guideline. Adsorption study was performed using 5 different container closure system. Several diluents were screened to reduce carryover and it was found that 3 replicates of 100 μl injection of Tris buffer can significantly reduce carryover in subsequent runs. For the storage of liraglutide solution, Type A glass material should be used as it offers negligible adsorption of the active
Acknowledgement:
We would like to express our sincere gratitude towards National Institute of Pharmaceutical Education and Research, Ahmedabad (NIPER-A) and Ministry of Chemicals and Fertilizers, Government of India for their support and encouragement for the completion of the research.
Conflict of interest:
There are no conflicts of interest.
References
- VICTOZA® (liraglutide) injection, for subcutaneous use Initial U.S. Approval: 2010.
- Knudsen LB. Inventing liraglutide, a glucagon-like peptide-1 analogue, for the treatment of diabetes and obesity. ACS Pharmacol Transl Sci 2019;2(6):468-84.
[Crossref] [Google Scholar] [PubMed]
- Uhlig T, Kyprianou T, Martinelli FG, Oppici CA, Heiligers D, Hills D et al. The emergence of peptides in the pharmaceutical business: From exploration to exploitation. EuPA Open Proteom 2014;4:58-69.
- Kaspar AA, Reichert JM. Future directions for peptide therapeutics development. Drug Discov Today 2013;18(17-18):807-17.
[Crossref] [Google Scholar] [PubMed]
- Zapadka KL, Becher FJ, Gomes dos Santos AL, Jackson SE. Factors affecting the physical stability (aggregation) of peptide therapeutics. Interface focus 2017;7(6):20170030.
- Liraglutide mechanism of action. Drug Bank. 2022.
- Sharma N, Kukreja D, Giri T, Kumar S, Shah RP. Synthetic pharmaceutical peptides characterization by chromatography principles and method development. J Sep Sci 2022;45(13):2200-16.
[Crossref] [Google Scholar] [PubMed]
- Carr D. A guide to the analysis and purification of proteins and peptides by reversed-phase HPLC. Adv Chromatogr Technol 2016:1-24.
- Rignall A. ICHQ1A (R2) stability testing of new drug substance and product and ICHQ1C stability testing of new dosage forms. ICH quality guidelines: An implementation guide. 2017:3-44.
- Wang Y, Lomakin A, Kanai S, Alex R, Benedek GB. Transformation of oligomers of lipidated peptide induced by change in pH. Mol Pharm 2015;12(2):411-9.
[Crossref] [Google Scholar] [PubMed]
