- *Corresponding Author:
- V. Bukkapatnam
Department of Pharmaceutical Analysis & Quality Assurance, GITAM Institute of Pharmacy, GITAM University, Visakhapatnam 530045, India
E-mail: venki.b11@gmail.com
| Date of Received | 05 April 2020 |
| Date of Revision | 03 February 2021 |
| Date of Acceptance | 30 May 2021 |
| Indian J Pharm Sci 2021;83(3):523-534 |
This is an open access article distributed under the terms of the Creative Commons Attribution-NonCommercial-ShareAlike 3.0 License, which allows others to remix, tweak, and build upon the work non-commercially, as long as the author is credited and the new creations are licensed under the identical terms
Abstract
A liquid chromatographic method has been established for the separation of metformin, glipizide, gliclazide, glibenclamide and glimepiride using experimental design. The main intention of this method is to optimize suitable chromatographic conditions for the proper elution of the drug molecules with minimal analysis time. The relationship between the individual and combined effect of critical process parameters and chromatographic efficiency was made clear and was achieved with the aid of experimental design methodology. Waters Sunfire C18 type column (150×4.6 mm, 5 µm particle size) was employed and 0.1 % acetic acid in water: acetonitrile mixture was adopted as mobile phase (flow rate: 0.469 ml/min) for the separation of analytes. The developed method was validated and has been extended for the assay of marketed formulations.
Keywords
Anti-diabetic drugs, design of experiments, quality by design, liquid chromatographic method, International Council on Harmonisation guidelines
Diabetes has developed as a common disease now a days and Type II diabetes (non-insulin-dependent) is majorly a result of interaction between genetic, behavioural risk and environmental factors. The combination of metformin (MFM) with second generation sulfonylureas is very common now a days in the available marketed formulations for the treatment of Type II diabetes[1,2]. MFM, a plagiaristic biguanide is a hypoglycemic agent. MFM is chemically known as 3-(diaminomethylidene)-1,1-dimethyl guanidine (C4H11N5; Molecular weight: 129.16 g/mol). Glipizide (GPZ) is a short-acting, 2nd generation plagiaristic sulfonylurea with hypoglycemic activity. It is chemically N-(2-{4-[(Cyclohexylcarbamoyl) sulfamoyl] phenyl} ethyl)-5-methyl-2-pyrazinecarboxamide (C21H27N5O4S; Molecular weight: 445.54 g/mol). Gliclazide (GCZ) is a second generation sulfonylurea plagiaristic with hypoglycemic activity. It is chemic ally, 1-(3,3a,4,5,6,6ahexahydro- 1H-cyclopenta[c]pyrrol-2-yl )-3- (4-methylphenyl)sulfonylurea (C15H21N3O3S; Molecular weight: 323.41 g/mol). Glibenclamide (GBM) is a plagiaristic sulfonylurea used as an anti-hyperglycemic agent. It is chemically known as 5-chloro-N-[2- [4-(cyclohexylcarbamoylsulfamoyl)phenyl]ethyl]-2-methoxybenzamide (C23H28ClN3O5S; Molecular weight: 494.00 g/mol). Glimepiride (GMP) is a third generation sulfonylurea with hypoglycemic activity and is a very potent drug that has reported a longer duration of action in comparison with other generations of sulfonylurea compounds. Chemically it is known as 4-ethyl-3-methyl-N-[2-[4-[(4-methylcyclohexyl) carbamoylsulfamoyl]phenyl]ethyl]-5-oxo-2H-pyrrole- 1-carboxamide (C24H34N4O5S; Molecular weight: 490.62 g/mol). The structures are illustrated on fig. 1.

Figure 1: Structural representation of (a) MFM, (b) GPZ, (c) GCZ, (d) GBM and (e) GMP
The optimization of chromatographic methods is often very complex while dealing with combination of compounds due to different variables. The chromatographic separations are mostly based on trial and error procedures. This traditional approach involves the study of the influence of corresponding variables by changing one variable at a time (OVAT) while keeping the other variables constant. The major disability of these methods is time consuming as it requires a greater number of trial experiments with no predicted conditions and therefore unable to predict the conceivable interactions within the factors on the responses.
In such separations, the method can be optimized at its best by employing quality by design (QbD) which is a systematized approach for the development of an analytical method that incorporates multifaceted combinations of independent variables and their interactions by applying design of experiments (DoE), to obtain optimal experimental conditions. DoE also provides an inference on possibility of understanding and also to mark the variables which majorly affects the method performance. As reported by International Council on Harmonisation (ICH) guideline Q8(R2)[3], the QbD approach is a de?ned optimization approach combining the DoE and Design Space (DS). As per the guidelines DS is de?ned as the multidimensional combination and interaction of input variables (e.g. material attributes) and process parameters that have been demonstrated to provide assurance of quality. Both graphical (overlay contour plots and three-dimensional (3D) plots) and mathematical (Derringer’s desirability function) functions are involved in the approach of better method optimization[4-8].
Few methods have been proclaimed in the literature for the determination of various combinations of antidiabetic drugs in human plasma and pharmaceutical dosage forms which include thin layer chromatography (TLC)[9], high performance liquid chromatography (HPLC)[10-15] and liquid chromatography-tandem mass spectrometry (LC-MS/MS)[16]. No method with the aid of DoE, has been developed till now for the simultaneous determination of MFM, GPZ, GCZ, GBM and GMP. Therefore, the authors have made an attempt to develop a validated chromatographic method with the help of Central Composite Design (CCD), as a model for DoE and to apply the same for the assay of available marketed combined dosage formulations in India.
Materials and Methods
Instrumentation and chromatographic conditions:
HPLC system: Ultra-Fast Liquid Chromatograph (UFLC) Shimadzu Prominence system (CBM-20Alite) model; SPD M20A detector (Photodiode-Array (PDA))
Stationary Phase: Waters Sunfire C18-type column (150×4.6 mm; 5 μm particle size)
Mobile Phase: 0.1 % acetic acid in water and acetonitrile (ACN) (32.9:67.1, % v/v) (Isocratic mode)
Flow rate: 0.469 ml/min
Injection volume: 20 μl
Ultraviolet/visible light (UV) detection
Wavelength: 230 nm
Temperature: Ambient (about 25°)
Software and data pre-handling:
The data management software Shimadzu’s LC Solutions v1.25 (Kyoto, Japan) was used to monitor, integrating and processes the chromatographic responses. For the experimental designs and the selection of the runs, Design Expert 10.0.2.0 trial version (Stat-Ease Inc., Minneapolis, MN, USA) has been used. The statistical interpretation for the optimization of the analytical method and effects of parameters were studied and calculated
Materials and reagents:
Reference standards of MFM (>99.1 %), GPZ (>98 %), GCZ (>98.5 %), GBM (>98.5 %) and GMP (>99 %) were gratefully provided by Sun pharmaceutical Industries Ltd., India as gift samples.
The available marketed formulations Glipimet Forte tab® (label claim: 500 mg/5 mg MFM/GPZ) (Sun Pharma Laboratories Ltd., India), Diaglip-M tab® (label claim: 500 mg/5 mg MFM/GPZ) (Cipla Ltd., India), Glygard-M tab® (label claim: 500 mg/80 mg MFM/ GCZ) (Cipla Ltd., India), Azukon-M tab ® (label claim: 500 mg/80 mg MFM/GCZ) (Torrent Pharmaceuticals Ltd., India), Glinil-M tab® (label claim: 500 mg/5 mg MFM/GBM) (Cipla Ltd., India), Glucored Forte tab ® (label claim: 500 mg/5 mg MFM/GBM) (Sun Pharma Laboratories Ltd., India), Azulix-MF tab ® (label claim: 500 mg/2 mg MFM/GMP) (Torrent Pharmaceuticals Ltd., India) and Gemer-2 tab® (label claim: 500 mg/2 mg MFM/GMP) (Sun Pharma Laboratories Ltd., India) are procured from the local pharmacy and utilised for the assay of the above mentioned drugs. All chemicals were procured from Merck, India (analytical reagent- AR) and used as received. Acetic acid solution (0.1 %) was prepared from glacial acetic acid using HPLC grade water, sonicated for half an hour and filtered.
All the stock solutions of MFM, GPZ, GCZ, GBM and GMP were prepared separately by transferring accurately 25 mg of each into different 25 ml volumetric flasks in ACN (1000 μg/ml) and dilutions were made with mobile phase and finally filtered through 0.45 μm nylon membrane filter before injecting into the HPLC system.
Validation:
The method was validated as per the ICH guidelines[17]. For linearity study a series of drug solutions (0.01- 400 μg/ml) were prepared from their respective stock solutions of the raw materials, scanned and analysed. The precision studies were performed by analysing each drug solution at different levels (5, 10 and 20 μg/ml) at different intervals on the same day (intra-day) and on three different days (inter-day) respectively. Accuracy studies were conducted by calculating the percentage recovery for the solutions prepared by spiking with pre-analysed samples for all the five drugs. Robustness study was performed (10 μg/ml) by modifying slightly the chromatographic conditions such as flow rate, mobile phase ratio and detection wavelength. The solution stability was performed for 24 h, by storing the stock solution in a tightly capped volumetric ?ask at 4-8°. Mobile phase bench top stability was assessed by assaying the freshly prepared sample solutions against freshly prepared reference standard solutions at regular intervals up to 24 h.
Assay of marketed formulations:
Twenty tablets from each brand of the five drugs were procured from the local pharmacy store and extracted the drugs with mobile phase and the percentage recovery was calculated.
Results and Discussion
Method development and optimization is carried out and the main aim of developing the reverse phase high performance liquid chromatography (RP-HPLC) method is to determine simultaneously MFM, GPZ, GCZ, GBM and GMP in bulk and as well as in pharmaceutical dosage forms which were separated from each other with good resolution (RS>2.0) due to modified critical HPLC parameters. It is necessary to identify the crucial factors that can affect the separation of these drugs. During the preliminary screening different columns, several mobile phase compositions, flow rate etc. were screened in different combinations. Waters Sunfire C18 (150×4.6 mm, 5 μm) column was able to show proper resolution of the drugs. From this, percentage of organic phase and flow rate were identified as critical variables on the chromatographic response of these five drugs with least noise. The overlay UV absorption spectrum (fig. 2) shows that the 230 nm is the suitable wavelength at which all the five drugs can be detected satisfactorily.

Figure 2: Overlay UV absorption spectrum of MFM, GPZ, GCZ, GBM and GMP (10 μg/ml each)
In the present study for the optimisation of liquid chromatographic method, the authors have chosen CCD, which is one of the models of response surface methodology in the experimental design. Independent variables i.e., ratio of organic phase and flow rate, each at three levels were mentioned in Table 1. The levels for each factor were selected based on initial preliminary trials.
| Variables | Levels | ||
|---|---|---|---|
| -1 (Low) | 0 (Medium) | 1 (High) | |
| Independent | |||
| A- % Organic phase (% ACN) | 60 | 65 | 70 |
| B- Flow rate (ml/min) | 0.4 | 0.5 | 0.6 |
| Dependent | |||
| RS(MFM-GPZ) | =Resolution of GPZ | ||
| Rs(GPZ-GCZ) | =Resolution of GCZ | ||
| Rs(GCZ-GBM) | =Resolution of GBM | ||
| Rs(GBM-GMP) | =Resolution of GMP | ||
| TMFM | =Tailing factor of MFM | ||
| TGPZ | =Tailing factor of GPZ | ||
| TGCZ | =Tailing factor of GCZ | ||
| TGBM | =Tailing factor of GBM | ||
| TGMP | =Tailing factor of GMP | ||
| Rt(MFM) | =Retention time of MFM (min) | ||
| Total analysis time | =Total run time (min) | ||
Table 1: Experimental Variables and Coded Levels Used In the Ccd
The method was fully optimized using thirteen experimental runs. The design was composed of two levels factorial design with additional centre points located at the centre of the experimental region. The influence of the above said variables on the chromatographic responses (resolution of GPZ [Rs(MFM−GPZ)], resolution of GCZ [Rs(GPZ−GCZ)], resolution of GBM [Rs(GCZ−GBM)], resolution of GMP [Rs(GBM−GMP)], tailing factor of MFM [TMFM], tailing factor of GPZ [TGPZ], tailing factor of GCZ [TGCZ], tailing factor of GBM [TGBM], tailing factor of GMP [TGMP], retention time of MFM (min) [Rt(MFM)] and total run time (min) [total analysis time]) were investigated and shown in Table 2. The chromatograms of these trials are given in fig. S1.
| Run | Factors | Responses | |||||||||||
|---|---|---|---|---|---|---|---|---|---|---|---|---|---|
| A | B | RS(MFM-GPZ) | Rs(GPZ-GCZ) | Rs(GCZ-GBM) | Rs(GBM-GMP) | TMFM | TGPZ | TGCZ | TGBM | TGMP | Rt(MFM) | Total analysis time | |
| 1 | 60 | 0.6 | 11.676 | 10.091 | 4.828 | 3.052 | 0.969 | 1.103 | 1.184 | 1.095 | 1.07 | 1.641 | 10.237 |
| 2 | 65 | 0.641 | 9.49 | 8.495 | 3.054 | 2.474 | 0.984 | 1.112 | 1.23 | 1.123 | 1.094 | 1.54 | 7.169 |
| 3 | 57.9 | 0.5 | 12.846 | 11.166 | 5.778 | 3.215 | 0.904 | 1.103 | 1.207 | 1.094 | 1.07 | 1.988 | 14.15 |
| 4 | 65 | 0.5 | 9.881 | 8.932 | 3.193 | 2.604 | 0.949 | 1.137 | 1.231 | 1.126 | 1.1 | 1.962 | 9.137 |
| 5 | 70 | 0.4 | 8.158 | 7.408 | 1.929 | 2.269 | 0.951 | 1.223 | 1.584 | 1.178 | 1.141 | 2.463 | 8.995 |
| 6 | 70 | 0.6 | 7.854 | 6.855 | 1.842 | 2.112 | 0.95 | 1.156 | 1.387 | 1.166 | 1.116 | 1.638 | 6.058 |
| 7 | 72.1 | 0.5 | 7.631 | 6.578 | 1.522 | 2.055 | 0.909 | 1.209 | 1.31 | 1.264 | 1.126 | 1.973 | 6.563 |
| 8 | 65 | 0.359 | 10.111 | 9.169 | 3.174 | 2.705 | 1.02 | 1.194 | 1.277 | 1.173 | 1.135 | 2.729 | 12.545 |
| 9 | 60 | 0.4 | 11.872 | 10.555 | 4.827 | 3.043 | 0.944 | 1.107 | 1.238 | 1.127 | 1.096 | 2.0469 | 15.176 |
Table 2: Conducted Experiments and Measured Response Values for Ccd Involving Three Variables At Three Levels
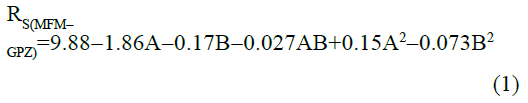
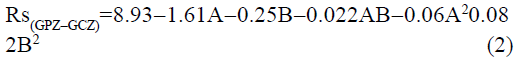
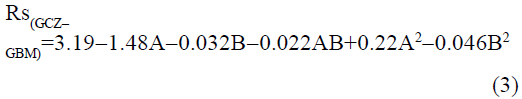
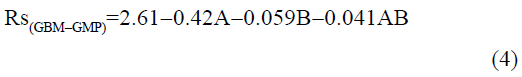
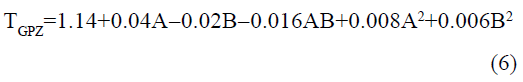
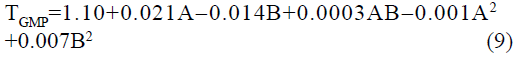
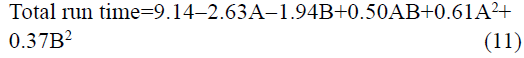
The statistical parameters from the analysis of variance (ANOVA) were listed in Table 3. The probability p<0.03 for all the chromatographic responses implies that the models are highly significant. The model has provided the high values of correlation coefficient (R2) and adjusted R2 indicating a close relation between the experimental and the predicted values of the responses. The adequate precision measures the signal to noise ratio which was found to be >4 indicating that the model can be used for the prediction of perfect chromatographic conditions. The polynomial equations are given below (Eq. (1-11)) in which A: % organic phase (% ACN) and B: flow rate (ml/min).
TMFM=0.95-0.0006A-0.003B-0.007AB-0.021A2+0.026B2 (5)


| Variables | RS(MFM-GPZ) | Rs(GPZ-GCZ) | Rs(GCZ-GBM) | Rs(GBM-GMP) | TMFM | TGPZ | TGCZ | TGBM | TGMP | Rt(MFM) | Total analysis time | ||||||||||||
|---|---|---|---|---|---|---|---|---|---|---|---|---|---|---|---|---|---|---|---|---|---|---|---|
| F | p | F | p | F | p | F | p | F | p | F | p | F | p | F | p | F | p | F | p | F | p | ||
| Model | 714.25 | <0.0001 | 919.36 | <0.0001 | 7222.16 | <0.0001 | 583.82 | <0.0001 | 17.65 | 0.0008 | 63.91 | <0.0001 | 5.83 | 0.021 | 15.04 | 0.0010 | 301.88 | <0.0001 | 36.82 | <0.0001 | 5851.89 | <0.0001 | |
| A | 3514.41 | <0.0001 | 4477.62 | <0.0001 | 35326.53 | <0.0001 | 1708.90 | <0.0001 | 0.03 | 0.8721 | 217.52 | <0.0001 | 9.64 | 0.0112 | 27.35 | 0.0004 | 995.69 | <0.0001 | 1.3 | 0.2800 | 18131.30 | <0.0001 | |
| B | 30.00 | 0.0009 | 104.91 | <0.0001 | 16.29 | 0.0050 | 34.18 | 0.0002 | 0.84 | 0.3905 | 74.73 | <0.0001 | 2.02 | 0.1855 | 2.73 | 0.1292 | 408.30 | <0.0001 | 72.34 | <0.0001 | 9766.94 | <0.0001 | |
| AB | 0.37 | 0.5629 | 0.4300 | 0.5338 | 3.8600 | 0.0901 | 8.3700 | 0.0178 | 1.58 | 0.2495 | 16.98 | 0.0045 | 0.07 | 0.8007 | 326.75 | <0.0001 | |||||||
| A2 | 18.95 | 0.0033 | 5.5600 | 0.0505 | 685.6300 | <0.0001 | 29.95 | 0.0009 | 7.05 | 0.0327 | 2.46 | 0.1605 | 848.95 | <0.0001 | |||||||||
| B2 | 4.62 | 0.0686 | 9.9800 | 0.0159 | 28.6600 | 0.0011 | 44.77 | 0.0003 | 4.56 | 0.0700 | 97.01 | <0.0001 | 299.92 | <0.0001 | |||||||||
| R2 | 0.998 | 0.9985 | 0.9998 | 0.9949 | 0.9265 | 0.9786 | 0.5383 | 0.7505 | 0.9954 | 0.8804 | 0.9998 | ||||||||||||
| Adjusted R2 | 0.9966 | 0.9974 | 0.9997 | 0.9932 | 0.8740 | 0.9633 | 0.446 | 0.7006 | 0.9921 | 0.8565 | 0.9996 | ||||||||||||
| Adequate Precision | 87.4390 | 98.6970 | 277.2240 | 74.6770 | 14.3750 | 25.776 | 6.656 | 10.9090 | 56.4050 | 17.679 | 242.8810 | ||||||||||||
Table 3: Anova for the Screened Chromatographic Responses
The positive value indicates the favourable response and negative value indicates the inverse effect between the variable and the response in the equation. From these equations it is clear that the buffer strength (A) has positive effect on TGPZ, TGCZ, TGBM, TGMP and Rt(MFM), % organic phase (B) shows negative effect on all the responses.
It is evident that the relation between the independent variables for RS(MFM−GPZ), Rs(GPZ−GCZ), Rs(GCZ−GBM), TMFM, TGPZ, TGMP and total analysis time is quadratic. Whereas, it is linear in case of TGCZ, TGBM, Rt(MFM) and 2FI model for Rs(GBM−GMP).
The perturbation plots are represented in fig. S2 which describes the effect of the independent variables on specific response with all other variables held constant at a reference point. 3D response surface plots (fig. 3) and Contour plots (fig. S3), portray the combined effect of both organic phase and flow rate on the responses, which were very much useful for studying the interaction effect of variables on the responses. From these it is evident that most of the responses are very much sensitive towards variable A, showing negative effect for Rs(MFM−GPZ), Rs(GPZ−GCZ), Rs(GCZ−GBM), Rs(GBM−GMP) and total run time indicating that increasing levels of A results in decreased response, on the other hand TGPZ, TGCZ, TGBM, TGMP responded positively for increasing levels of A. In case of TMFM, both increasing and decreasing levels of variable A shows negative effect, showing maximum response at the reference point. Increasing levels of Variable B shows negative effect on TGPZ, TGBM, TMFM and total run time. In case of TMFM, both the higher and lower levels of variable B show increased response, while other responses were no much effected.

Figure 3: Response surface plots depicting the influence of the combined effect of % Organic phase (% ACN) (A) and flow rate (ml/ min) (B) on (a) Rs(MFM−GPZ), (b) Rs(GPZ−GCZ), (c) Rs(GCZ−GBM), (d) Rs(GBM−GMP), (e) TMFM, (f) TGPZ, (g) TGCZ, (h) TGBM, (i) TGMP, (j) Rt(MFM) and (k) total analysis time
The main objective is to separate the peaks with all system suitability parameters within the limits with minimum analysis time. Derringer’s desirability function (D) is a multi-criteria decision-making tool to conciliate various responses to acquire the composition of different independent variables. The value of D differs from 0 to 1 meaning that the responses are in a desirable range and the value close to 1 specifically implies that the response values are near to target values. The criteria of optimization for each individual response were clearly shown in Table 4. Generally, short analysis time with good resolution and less tailing of the eluted peaks is preferred. The optimization procedure was carried out by following the conditions and the criteria provided by the design expert. The desirability of the method gives overall impression on the achievement of required criteria of each and every response.
| Name | Goal | Lower limit | Upper limit |
|---|---|---|---|
| RS(MFM-GPZ) | is in range | 7.631 | 12.846 |
| Rs(GPZ-GCZ) | is in range | 6.578 | 11.166 |
| Rs(GCZ-GBM) | is in range | 2.000 | 5.778 |
| Rs(GBM-GMP) | is in range | 2.055 | 3.215 |
| TMFM | minimize | 0.904 | 1.020 |
| TGPZ | minimize | 1.103 | 1.223 |
| TGCZ | minimize | 1.184 | 1.584 |
| TGBM | minimize | 1.094 | 1.264 |
| TGMP | minimize | 1.070 | 1.141 |
| Rt(MFM) | maximize | 1.800 | 2.729 |
| Total analysis time | minimize | 6.058 | 15.176 |
Table 4: Desirability Criteria for Optimized Individual Responses
The Desirability bar graph shown in fig. 4 demonstrates the desirability of each response at the optimised chromatographic conditions. Two runs in total have shown the maximum desirability. Percentage prediction error (PE) was calculated from Eq. 12 for each response and the mean for all the responses in every run was shown in Table 5.
|
S. No |
Factors | Responses | Predicted values | Observed values | PE | Mean PE | |
|---|---|---|---|---|---|---|---|
| A | B | ||||||
|
1 |
67.2 | 0.469 | RS(MFM-GPZ) | 9.154 | 9.217 | -0.295 | -2.326 |
| Rs(GPZ-GCZ) | 8.298 | 8.169 | -1.555 | ||||
| Rs(GCZ-GBM) | 2.6 | 2.539 | -2.346 | ||||
| Rs(GBM-GMP) | 2.454 | 2.490 | 1.467 | ||||
| TMFM | 0.949 | 0.840 | -11.486 | ||||
| TGPZ | 1.166 | 1.159 | -0.600 | ||||
| TGCZ | 1.325 | 1.235 | -6.792 | ||||
| TGBM | 1.166 | 1.137 | -2.487 | ||||
| TGMP | 1.114 | 1.104 | -0.898 | ||||
| Rt(MFM) | 2.123 | 2.118 | -0.236 | ||||
| Total analysis time | 8.69 | 8.659 | -0.357 | ||||
|
2* |
67.1 | 0.468 | RS(MFM-GPZ) | 9.167 | 9.317 | 1.636 | -2.261 |
| Rs(GPZ-GCZ) | 8.31 | 8.362 | 0.626 | ||||
| Rs(GCZ-GBM) | 2.61 | 2.569 | -1.571 | ||||
| Rs(GBM-GMP) | 2.457 | 2.415 | -1.709 | ||||
| TMFM | 0.949 | 0.821 | 13.448 | ||||
| TGPZ | 1.165 | 1.14 | -2.146 | ||||
| TGCZ | 1.324 | 1.249 | -5.665 | ||||
| TGBM | 1.166 | 1.133 | -2.830 | ||||
| TGMP | 1.114 | 1.101 | -1.167 | ||||
| Rt(MFM) | 2.125 | 2.129 | 0.377 | ||||
| Total analysis time | 8.732 | 8.794 | 1.069 | ||||
Table 5: For Selection of the Final Optimized Chromatographic Condition

Figure 4: The desirability bar graph for the chromatographic responses at the optimized condition
The runs were scrutinized based on the mean percentage PE and the run (run 2) with least PE value was nominated as the desired method. The DS plot (fig. 5) revealed that, the so obtained optimized method had fallen within the DS.

Figure 5: The design space for the final optimized chromatographic condition
Finally, the optimised chromatographic condition was racked up with a mobile phase comprising of 0.1 % acetic acid in water and ACN (32.9:67.1 % v/v) and flow rate 0.469 ml/min. At this optimised condition, MFM, GPZ, GCZ, GBM and GMP were eluted at 2.129, 4.718, 7.076, 7.927 and 8.794 min respectively. The subsequent typical chromatograms for the mixture, individual standard chromatograms were shown in fig. 6. From the overall optimization, it was properly identified that most of the variables have been fully attained as per the requirement while some variables have been slightly attained but within the limit. On the whole, method shows best chromatographic responses.

Figure 6: Typical chromatograms of standards of (a) mixture (10 μg/ml each), (b) MFM (10 μg/ml), (c) GPZ (10 μg/ml), (d) GCZ (10 μg/ml), (e) GBM (10 μg/ml) and (f) GMP (10 μg/ml) at the final optimized conditions
According to ICH guidelines[17] the optimised method was validated and the data was given in Table 6.
| Test | Acceptance criteria | Results | ||||
|---|---|---|---|---|---|---|
| MFM | GPZ | GCZ | GBM | GMP | ||
| Linearity (n=3) | ||||||
| Correlation coefficient | >0.999 | 0.9995 | 0.9993 | 0.9994 | 0.9996 | 0.9995 |
| Slope±Standard deviation (SD) | - | 396268.33±45268.63 | 134007.67±14812.23 | 134007.67±14812.23 | 98647.45±1247.29 | 136988.33±8100.69 |
| Intercept±SD | - | 85454.33±57457.62 | 109894.00±42360.89 | 112425.00±59378.95 | 19854.37±15424.78 | 93712.33±58498.61 |
| Linearity range (µg/ml) | - | 0.01-150 | 0.1-200 | 0.5-350 | 0.02-200 | 0.1-200 |
| LOD | - | 0.0168 | 0.0357 | 0.1620 | 0.0077 | 0.0351 |
| LOQ | - | 0.0509 | 0.1081 | 0.4909 | 0.0233 | 0.1064 |
| Accuracy (% Recovery) (n=3) | 98.0-102.0 | 98.03-98.25 | 97.61-98.44 | 97.95-98.21 | 98.72-99.08 | 98.79-99.24 |
| Precision (n=3) | ||||||
| Intra-day precision (% RSD) | % RSD <2.0 | 0.23-0.66 | 0.17-0.29 | 0.12-0.17 | 0.05-0.40 | 0.13-0.43 |
| Inter-day precision (% RSD) | % RSD <2.0 | 0.37-1.54 | 0.66-1.10 | 0.63-1.08 | 0.51-0.59 | 0.85-1.68 |
Table 6: Summarising the Complete Validation Results Performed At the Optimized Chromatographic Condition
Linearity range were validated and the concentration ranges over which the linearity was determined for the five drugs were: MFM (0.01-150 μg/ml), GPZ (0.1 -200 μg/ml), GCZ (0.5-350 μg/ml), GBM (0.02-200 μg/ ml) and GMP (0.1-200 μg/ml). The linearity data, limit of detection (LOD) and limit of quantitation (LOQ) results were clearly shown in Table S1 which shows that the analysis data was within the ICH acceptance criteria.
From the results obtained in both intra-day and interday, precision studies were summarized in Table S2 which demonstrates the method precision (i.e., % relative standard deviation (RSD)>2).
The recovery for the five drugs in the accuracy study ranged between 97.61-99.24 % (Table S3). The results when compiled with the ICH requirements proves the method accuracy.
The robustness of the method was evaluated by assaying the same sample under different analytical conditions deliberately changing from the original condition. The detection wavelength was set at 228 and 232 nm (±2 nm), the ratio of percentage of 0.1 % acetic acid: ACN in the mobile phase was applied as 30.9:69.1 and 34.9:65.1 (±2, % v/v) and the flow rate were set at 0.4221 and 0.5159 ml/min (±10 %). The results obtained for the robustness study (Table S4), shows that the retention times and the percentage (%) recoveries were not much affected by varied conditions during the robustness study and the % RSD is <2.0 indicating the method robustness.
The % RSD of the assay from the solution stability and mobile phase bench top stability experiments was within 2 % up to 24 h (Table S5). The results of the solution stability and mobile phase bench top stability studies con?rm that the sample solutions and mobile phase used during the analysis were stable up to 24 h.
The proposed method was applied to the available formulations and the percentage recoveries were calculated (Table 7).
| Formulation | Manufacturer (India) | Analyte | Labelled claim (mg) | Amount found (mg) | Recovery (%) |
|---|---|---|---|---|---|
| Glipimet Forte Tab | Sun Pharma | MFM | 500 | 492.75 | 98.55 |
| GPZ | 5 | 4.89 | 97.78 | ||
| Bionase-MF Tab | Biochem | MFM | 500 | 487.05 | 97.41 |
| GPZ | 5 | 4.86 | 97.25 | ||
| Glygard-M Tab | Cipla | MFM | 500 | 493.90 | 98.78 |
| GCZ | 80 | 77.78 | 97.22 | ||
| Glycigon-Msr Tab | Aristo | MFM | 500 | 493.50 | 98.7 |
| GCZ | 80 | 78.35 | 97.94 | ||
| Gliconil-M Tab | Biochem | MFM | 500 | 492.70 | 98.54 |
| GBM | 5 | 4.87 | 97.42 | ||
| Glucored Forte Tab | Sun Pharma | MFM | 500 | 494.15 | 98.83 |
| GBM | 5 | 4.88 | 97.54 | ||
| Azulix-MF Tab | Torrent | MFM | 500 | 485.35 | 97.07 |
| GMP | 2 | 1.98 | 98.77 | ||
| Gemer-2 Tab | Sun Pharma | MFM | 500 | 493.35 | 98.67 |
| GMP | 2 | 1.94 | 97.14 |
Table 7: Results for Assay of Formulations
Statistically based experimental design has proven as an important methodology in the optimization of the simultaneous determination of MFM, GPZ, GCZ, GBM and GMP. The significant variables were optimized by employing CCD which provides the sensitivity of the chromatographic responses to the interactions of the selected variables. The present approach maximises the information content of the experimental data with minimum number of experimental runs. The method selectivity, precision, accuracy and robustness with the low time of analysis shows the suitability and better choice for the analysis of the drugs in the complex mixtures. The application of the present method on commercial formulations demonstrated good results and it seems as an option to use on quality control of the formulations in regular use.
Acknowledgements:
The authors are grateful to University Grants Commission, New Delhi, India for the financial support (UGC Ref No: 42-674/2013(SR), 2013) and also M/S GITAM University, Visakhapatnam for providing research facilities.
Conflicts of interest:
The authors declared no conflict of interest.
References
- Al-Rubeaan K, Youssef AM, Ibrahim HM, Al-Sharqawi AH, AlQumaidi H, AlNaqeb D, et al. All-cause mortality and its risk factors among type 1 and type 2 diabetes mellitus in a country facing diabetes epidemic. Diabetes Res Clin Pract 2016;118:130-9.
- Olokoba AB, Obateru OA, Olokoba LB. Type 2 diabetes mellitus: a review of current trends. Oman Med J 2012;27(4):269-73.
- ICH Q8 (R2) Pharmaceutical development, International conference on harmonisation of technical requirements for registration of pharmaceuticals for human use. International Conference on Harmonization; 2009.
- Rozet E, Lebrun P, Hubert P, Debrus B, Boulanger B. Design spaces for analytical methods. Trends Analyt Chem 2013;42:157-67.
- Peterson JJ. A Bayesian approach to the ICH Q8 definition of design space. J Biopharm Stat 2008;18(5):959-75.
- Orlandini S, Pinzauti S, Furlanetto S. Application of quality by design to the development of analytical separation methods. Anal Bioanal Chem 2013;405(2):443-50.
- Debrus B, Guillarme D, Rudaz S. Improved quality-by-design compliant methodology for method development in reversed-phase liquid chromatography. J Pharm Biomed Anal 2013;84:215-23.
- Cela R, Ordonez EY, Quintana JB, Rodil R. Chemometric-assisted method development in reversed-phase liquid chromatography. J Chromatogr A 2013;1287:2-22.
- Kumasaka K, Kojima T, Honda H, Doi K. Screening and quantitative analysis for sulfonylurea-type oral antidiabetic agents in adulterated health food using thin-layer chromatography and high-performance liquid chromatography. J Health Sci 2005;51(4):453-60.
- Ali AK, Hassan AA. Development of a RP-HPLC method for simultaneous determination of some antidiabetic sulfonylurea drugs in bulk and pharmaceutical dosage forms. Int J Pharm Sci Rev Res 2014;25(2):207-10.
- Venkatesh P, Harisudhan T, Choudhury H, Mullangi R, Srinivas NR. Simultaneous estimation of six anti?diabetic drugs-glibenclamide, gliclazide, glipizide, pioglitazone, repaglinide and rosiglitazone: development of a novel HPLC method for use in the analysis of pharmaceutical formulations and its application to human plasma assay. Biomed Chromatogr 2006;20(10):1043-8.
- Yao J, Shi YQ, Li ZR, Jin SH. Development of a RP-HPLC method for screening potentially counterfeit anti-diabetic drugs. J Chromatogr B 2007;853(1-2):254-9.
- AbuRuz S, Millership J, McElnay J. The development and validation of liquid chromatography method for the simultaneous determination of metformin and glipizide, gliclazide, glibenclamide or glimperide in plasma. J Chromatogr B 2005;817(2):277-86.
- Lakshmi KS, Rajesh T. Development and validation of RP-HPLC method for simultaneous determination of glipizide, rosiglitazone, pioglitazone, glibenclamide and glimepiride in pharmaceutical dosage forms and human plasma. J Iran Chem Soc 2011;8(1):31-7.
- Mokhtar HI, Abdel-Salam RA, Hadad GM. Development of a fast high performance liquid chromatographic screening system for eight antidiabetic drugs by an improved methodology of in-silico robustness simulation. J Chromatogr B 2015;1399:32-44.
- Gu HW, Wu HL, Li SS, Yin XL, Hu Y, Xia H, et al. Chemometrics-enhanced full scan mode of liquid chromatography–mass spectrometry for the simultaneous determination of six co-eluted sulfonylurea-type oral antidiabetic agents in complex samples. Chemometr Intell Lab Syst 2016;155:62-72.
- Validation of Analytical Procedures: Text and Methodology Q2 (R1). International conference on harmonisation of technical requirements for registration of pharmaceuticals for human use. International Conference on Harmonization; 2005.