- *Corresponding Author:
- Mrunal Ambasana
Department of Chemistry and Forensic Science, Bhakta Kavi Narsinh Mehta University, Junagadh, Gujarat 362263, India
E-mail: ambasanamrunal@gmail.com
| Date of Received | 14 May 2023 |
| Date of Revision | 14 December 2023 |
| Date of Acceptance | 20 August 2024 |
| Indian J Pharm Sci 2024;86(4):1288-1295 |
This is an open access article distributed under the terms of the Creative Commons Attribution-NonCommercial-ShareAlike 3.0 License, which allows others to remix, tweak, and build upon the work non-commercially, as long as the author is credited and the new creations are licensed under the identical terms
Abstract
The present work describes about first order derivative spectroscopic approach for the estimation of carfilzomib as such and in parenteral formulation. The spectroscopic estimation was achieved by scanning the sample between 200 and 800 nm on shimadzu ultraviolet-1900 spectrophotometer. Further first order spectrums were obtained by taking derivatization of absorbance against wavelength. The developed method was validated as recommended in International Council for Harmonisation guideline. The linearity of the method was in the range of 6-30 μg/ml whereas correlation coefficient was 0.9991. The limits of detection and quantification were 1 μg/ml and 3 μg/ml respectively. Intra day and inter day system and method precision were determined and accuracy was between 99.03 %-100.59 %. The first order derivative spectroscopic estimation of carfilzomib is the subject of the proposed investigation. Different batches of samples were examined using this method. Furthermore, the method proved successful when applied to analyze a marketed formulation.
Keywords
Carfilzomib, spectrophotometry, derivatized spectroscopy, ultraviolet-visible spectroscopy, validation
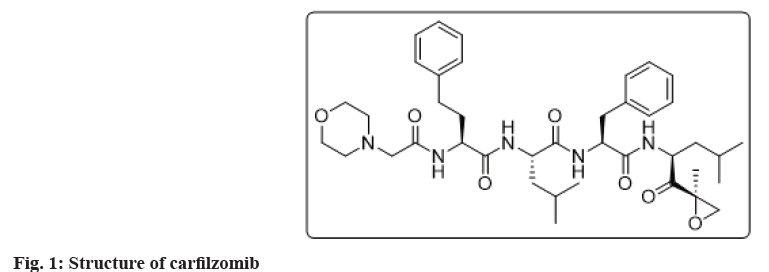
Carfilzomib is a second-generation selective proteasome inhibitor which blocks the action of extra cellular complexes that break down proteins[1,2]. Chemically, it is a tetra peptide epoxy ketone, an analog of epoxomicin[3]. It was developed by Onyx Pharmaceuticals Inc., United States of America and was approved by United States Food and Drug Administration in June 2012 for use in patients with multiple myeloma[3,4]. The International Union of Pure and Applied Chemistry (IUPAC) name for carfilzomib is (2S)-N-((1S)-1-benzyl-2-(((1S)-3-methyl-1- (((2R)-2-methyloxiran-2-yl)carbonyl)butyl) amino)-2-oxoethyl)-4-methyl-2-(((2S)-2-((morpholin- 4-ylacetyl) amino)-4-henylbutanoyl) amino) pentanamide, corresponding to the molecular formula C40H57N5O7 and the molecular weight 719.91 g/mol[2-4]. The chemical structure of carfilzomib is shown in fig. 1. Carfilzomib appears as white to off-white, slightly hygroscopic in nature, crystalline powder. It is soluble in ethanol and methanol, sparingly soluble in acetonitrile and practically insoluble in water. Its aqueous solubility is pH dependent and is higher at low pH value[4].
The fundamental Ultraviolet-Visible (UV-Vis) spectrum of carfilzomib shows λ maxima at 203 nm, which almost coincides the solvent absorbance region[5]. Nearly first half of the peak width appears between 180-200 nm, which clearly indicates the scope for the enhancement in spectral characteristics. It could be readily executed by applying approaches like kinetics, complex formation or derivation[6,7]. Out of which derivative spectroscopy is known to be most practical, adaptable and promising technique. Moreover, in derivative spectroscopy, the ability to detect and to measure minor spectral features is considerably enhanced[8,9]. Several analytical methods for the quantitative determination of carfilzomib in bulk, pharmaceutical formulations and biological samples have been published, using UV-Vis spectrophotometry[5,10], liquid chromatography[3,11] and liquid chromatography-mass spectrometry[12-16]. Our aim was to develop a reliable and less complicated method which could be easily handled with commonly available reagents, chemicals and a UV-Vis spectrophotometer. The present method has advantages over some reported ones[5,10] such as peak shape and wavelength of λ maxima. Moreover, the method is simpler, highly reproducible and accurate, compared to other complicated techniques such as highperformance thin-layer chromatography, capillary zone electrophoresis or gas chromatography.
Materials and Methods
Apparatus:
A double beam UV-Vis spectrophotometer (UV-1900, SHIMADZU) was used for all the spectrophotometric determination. Spectroscopic analysis was achieved between 200-800 nm, using 1 cm matched quartz cell and UV probe 2.0 multi data processing systems. The Shimadzu ATX 124 (repeatability Standard Deviation (SD)≤0.1 mg) analytical balance was used for weighing.
Chemicals and injectables:
Carfilzomib (99.95 %) samples and working standards were provided by Anlon Healthcare Pvt. Ltd., (Rajkot, India) as gift samples. The injectables of carfilzomib, carfilnat (Natco Pharma Limited, Hyderabad, India) was purchased from local pharmacy. A spectroscopy grade solvent was procured from Merck India Ltd., (Mumbai, India). High purity deionized water was obtained from Merck Milli-Q®, Direct-Q®3 water purification system.
Preparation of solutions:
Stock standard solution: Accurately weigh and transfer 10 mg of carfilzomib in to 100 ml volumetric flask, dissolve and dilute up to the mark with methanol to obtain 100 μg/ml carfilzomib standard stock solution.
Standard solution: Transfer 1.8 ml of standard stock solution (100 μg/ml) to 10 ml volumetric flask, add about 2 ml of methanol and sonicate for a minute. Dilute the content up to the mark with methanol to obtain 18 μg/ml carfilzomib standard solution.
Injection stock and test solution: To prepare test stock solution (100 μg/ml) for assay, accurately transfer 16.6 μl of carfilzomib formulation (60 mg/ml) to 10 ml volumetric flask, add about 2 ml of methanol and sonicate the content for a minute, dilute up to the mark with methanol. Transfer exact 1.8 ml of test stock solution to 10 ml volumetric flask and dilute up to the mark with methanol to obtain test solution (18 μg/ml).
Method validation:
Linearity: For linearity, nine solutions were prepared containing 6 μg/ml to 30 μg/ml of carfilzomib, which correspond to 20 %-180 % of test solution concentration. Each solution was measured in duplicate. Linearity of the method was evaluated by linear-regression analysis.
Precision: Method precision (repeatability) was assessed by calculating Relative Standard Deviation (RSD) for assay of six sets of test preparation. For intraday precision, all the sets were analysed in duplicate on the same day. Intermediate precision was determined by performing the same procedures on a different day and by another person under the same experimental conditions.
Accuracy: Accuracy of the method was confirmed by demonstrating the mean recovery at three different concentrations (corresponding to 50 %, 100 % and 150 % of test solution concentration) by addition of known amount of sample. For each concentration, three sets were prepared and measured in duplicate.
Robustness: Robustness of the method was studied by evaluating the influence of small variations in the experimental conditions on the performance of the method. It was demonstrated by assaying test solutions after slight but significant changes in the analytical conditions. The factors selected for this study were the scan speed (fast and slow) and diluent (ethanol).
Limit of detection and quantification: Detection and quantitation limits were determined by analysing sample at known concentrations and establishing the minimum level at which the analyte can be clearly detected. Usually, limit of detection is determined as a signal to noise ratio 3:1, whereas limit of quantitation is determined as a signal to noise ratio 10:1.
Solution stability study: The stability of the solution was determined for both test and standard solution, in under the refrigeration (2°-5°) and at ambient temperature without protection from light. The responses of the aged solutions were assessed by comparison with freshly prepared solutions.
Results and Discussion
In this work a derivatized UV-Vis spectroscopic method for assay of carfilzomib in a parental formulation was developed and validated. To demonstrate the ideal condition for the estimation of carfilzomib, the effects of the different variables on the absorbance and wavelength were studied thoroughly. The spectroscopic conditions were designed to be simple and reproducible and were selected after studying the effect on peak maxima and accountability for quantitation. The conditions explored in detail were analyte concentration, diluent and short-term solution storage temperature.
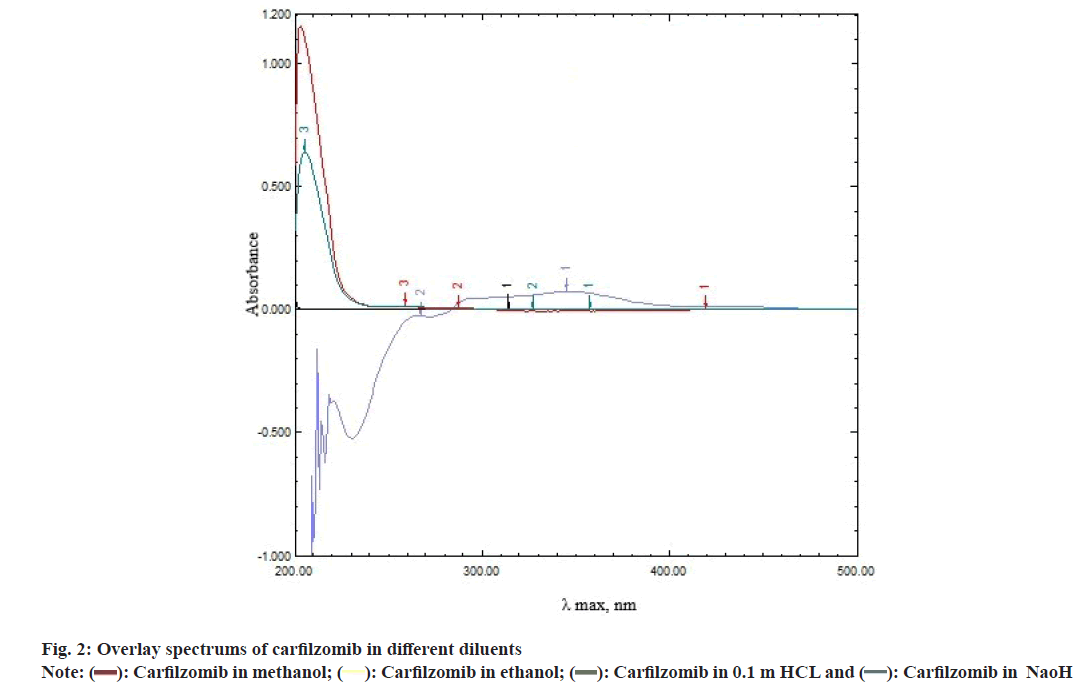
Several developmental trials were carried out taking methanol, ethanol, 0.1 M Hydrochloric acid (HCL) and 0.1 M sodium hydroxide as diluent. The drug containing methanol and ethanol as diluent, showed same peak shape, absorbance and λ maxima at 204 nm whereas drug in 0.1 M HCL appeared with some decrement in absorbance with same λ maxima as observed in previous diluents, whereas in alkali preparation, no quantizable peak appeared. It is possibly due to the hydrolysis of amide groups present in the structure (fig. 2).
Observing the overall results, methanol was confirmed as diluent. Several samples were optimized containing different concentrations of carfilzomib in methanol. Out of this, 18 μg/ml of drug found most suitable as standard preparation.
Carfilzomib involves oligo peptide chain and there are no such chromophores available in the structure which create absorbance in long wave ultra-violate or visible region. Hence it shows the absorbance maxima near to solvent region at 204 nm with an ordinary peak shape (fig. 2), moreover it requires slightly high concentration for quantification on UV-Vis spectroscopy as compare to other chromophores.
The comprehensive method development results revealed the scope for tailor-made modifications in the method. As mentioned earlier derivatization of zero order spectrum to its higher orders were evaluated for best possible result. Out of which first order derivation found most acceptable. About 10 nm of increment observed in λ maxima towards bathochromic region with an appropriate peak shape, while no quantizable spectrum observed after second, third or fourth order derivatization (fig. 3). After development of the method, it was validated as recommended in International Council for Harmonisation guidelines[8]. This furnished evidence, the method was suitable for its intended purpose.
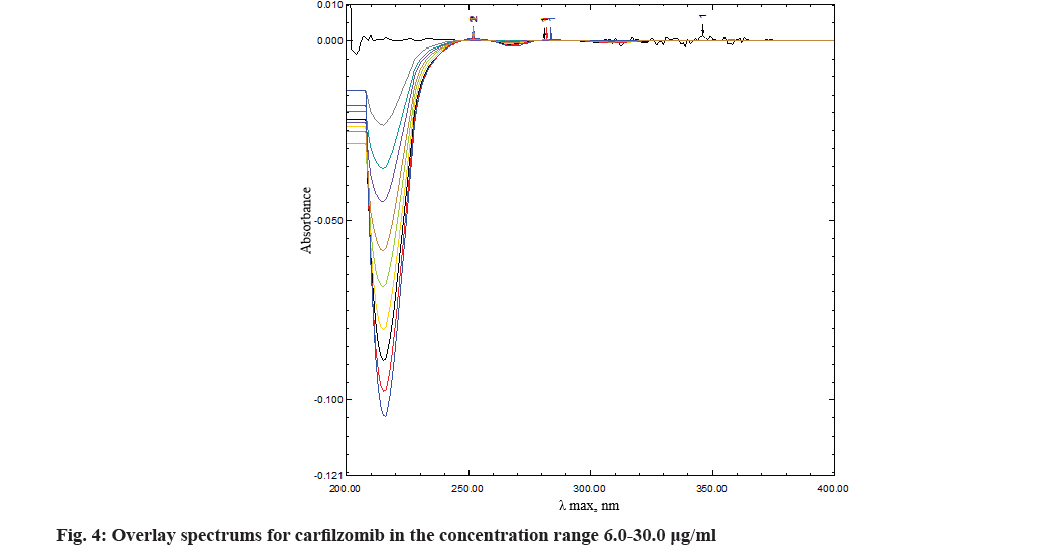
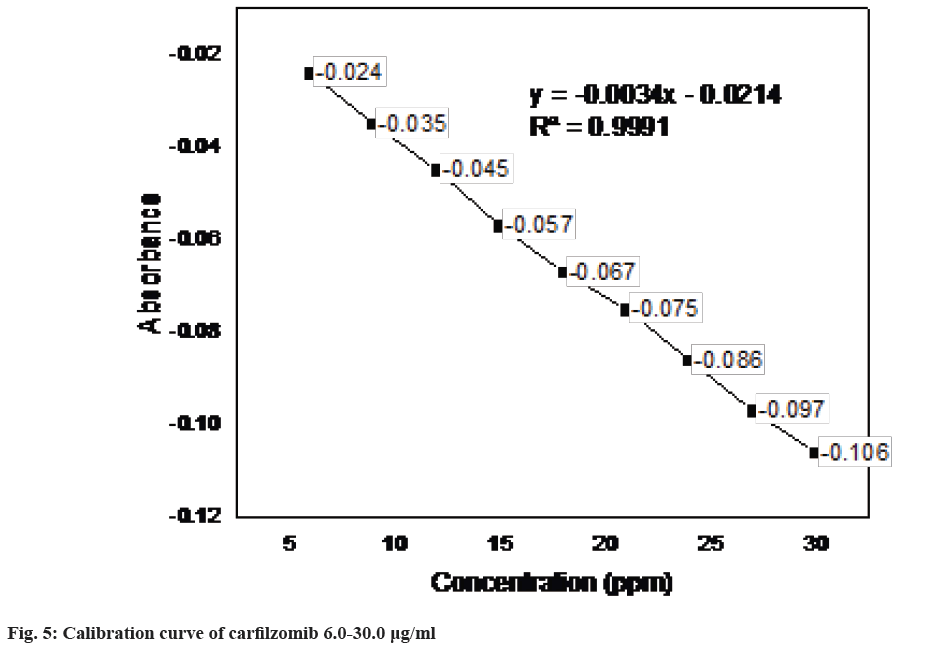
Regression characteristics like intercept, slope and correlation-coefficient were derived by plotting concentration against peak area. The regression equation was y=-0.0034x-0.0214 where, x is the concentration in μg/ml and y is the peak area in absorbance (Table 1). The correlation coefficient r2 was 0.9991. The correlation between the absorbance and concentration of the drug in the concentration range 6-30 μg/ml found satisfactory and complies with the guidelines (fig. 4 and fig. 5).
| S. no | Concentration (%) | Replicate | Absorbance | Average absorbance |
|---|---|---|---|---|
| 1 | 20 | 1 | -0.023 | -0.024 |
| 2 | -0.024 | |||
| 3 | -0.025 | |||
| 2 | 40 | 1 | -0.036 | -0.035 |
| 2 | -0.035 | |||
| 3 | -0.034 | |||
| 3 | 60 | 1 | -0.045 | -0.045 |
| 2 | -0.046 | |||
| 3 | -0.044 | |||
| 4 | 80 | 1 | -0.058 | -0.057 |
| 2 | -0.057 | |||
| 3 | -0.056 | |||
| 5 | 100 | 1 | -0.068 | -0.067 |
| 2 | -0.066 | |||
| 3 | -0.067 | |||
| 6 | 120 | 1 | -0.075 | -0.075 |
| 2 | -0.074 | |||
| 3 | -0.078 | |||
| 7 | 140 | 1 | -0.091 | -0.086 |
| 2 | -0.085 | |||
| 3 | -0.082 | |||
| 8 | 160 | 1 | -0.096 | -0.097 |
| 2 | -0.099 | |||
| 3 | -0.097 | |||
| 9 | 180 | 1 | -0.114 | -0.106 |
| 2 | -0.101 | |||
| 3 | -0.103 |
Table 1: Linearity Study Data Table
Further in intraday assay, the mean value of method precision was 100.2 % (RSD 0.37 %) whereas, in interday assay the mean value of precision was 99.7 % (RSD 1.42 %). Intermediate precision was established by performing the overall (intraday and interday) method precision for assay determination. The overall assay value for intermediate precision was 99.9 % (RSD 0.90 %, Table 2). In method accuracy, known quantity of carfilzomib (9, 18 and 27 μg/ml) were added for sample preparation and the amount of carfilzomib recovered was calculated. The mean recovery of the drug was between 99.0 % and 100.6 %, which are acceptable and are in accordance with the guidelines (Table 3).
| Set | Intraday Precision (% Recovery) | Interday Precision (% Recovery) |
|---|---|---|
| 1 | 100.7 | 101.081 |
| 2 | 100.34 | 101.5 |
| 3 | 100.37 | 99.4 |
| 4 | 99.86 | 97.67 |
| 5 | 99.68 | 99.55 |
| 6 | 100.02 | 99.02 |
| Average | 100.16 | 99.71 |
| SD | 0.37 | 1.41 |
| % RSD | 0.37 | 1.42 |
Table 2: Precision Study Data Table
| Level % | No | Amount of drug added mg/ml | Amount of drug found mg/ml | Recovery % | Mean recovery % | RSD % |
|---|---|---|---|---|---|---|
| 50 | 1 | 9.02 | 9.01 | 99.88 | 100.59 | 0.78 |
| 2 | 8.99 | 9.12 | 101.44 | |||
| 3 | 8.95 | 8.99 | 100.44 | |||
| 100 | 1 | 17.95 | 17.95 | 100.00 | 100.29 | 0.46 |
| 2 | 17.94 | 18.09 | 100.83 | |||
| 3 | 17.99 | 18.00 | 100.05 | |||
| 150 | 1 | 27.42 | 27.01 | 98.50 | 99.03 | 0.72 |
| 2 | 27.33 | 26.99 | 98.75 | |||
| 3 | 26.99 | 26.95 | 99.85 |
Table 3: Accuracy Study Data Table
The robustness of the method was assessed by applying slight but deliberate change in analytical condition before assaying test solutions. The standard and test solutions were prepared separately for each condition. The results remained fairly unchanged after slight modification in analytical conditions and were in accordance with the true value. System suitability data were also found to be acceptable during variation of the analytical conditions (Table 4). The analytical method therefore remained unaffected and successfully passes the robustness test.
| S. no | Parameter | Change | Assay % |
|---|---|---|---|
| 1 | Scan speed | Fast | 100.07 |
| 2 | Slow | 100.50 | |
| 3 | Diluent | Methanol | 100.62 |
| 4 | Ethanol | 99.75 |
Table 4: Robustness Study Data Table
In solution stability study, the stored solutions of standard and test preparations were found to be stable up to 48 h at room temperature and under refrigeration (Table 5). The system suitability test was performed before each step of validation by measuring the general characteristics like absorbance maxima and RSD of peak area for standard solutions. The data obtained for RSD were satisfactory and in accordance with limit of 2 %.
| Time (h) | Difference between assays of standard solution (%) | Difference between assays of test solution (%) | ||
|---|---|---|---|---|
| at 5° | at room temperature | at 5° | at room temperature | |
| 12 | 0.09 | 0.19 | 0.10 | 0.12 |
| 24 | 0.12 | 0.21 | 0.17 | 0.13 |
| 36 | 0.21 | 0.21 | 0.24 | 0.25 |
| 48 | 0.23 | 0.26 | 0.28 | 0.25 |
Table 5: Solution Stability Data Table
Parenteral formulation of carfilzomib was subjected to analysis by the proposed method and results were compared against working standard. The obtained results were appropriate and without any interference due to excipients used as additives in pharmaceutical formulations. The mean recovery value of the drug was 99.9 %, which is acceptable and hence successfully applied to the determination of carfilzomib in bulk and in pharmaceutical formulation (Table 6).
| Formulation | Labelled amount (mg) | Amount recovered (mg) | Recovery % | RSD % |
|---|---|---|---|---|
| Carfilnat | 60 | 59.95 | 99.91 | 0.45 |
Table 6: Analysis of Pharmaceutical Formulations
The present study deals with the first order derivative spectroscopic estimation of carfilzomib in bulk and preantral formulations. The task was achieved by producing fundamental spectrum of the drug between 200 and 800 nm and further measuring the rate of change of absorbance with respect to wavelength. The simplicity and robustness achieved by the method promotes their applicability in routine quality control of carfilzomib as such and in parenteral formulation.
Acknowledgments:
We are thankful to Anlon Healthcare Pvt. Ltd., Rajkot for providing samples and working standard. We are also thankful to Education Department, Government of Gujarat for providing financial assistance in terms of research fellowship under Scheme of Developing High Quality Research (SHODH) to Hardik Varu.
Conflict of interests:
The authors declare no conflict of interests.
References
- Federspiel JD, Codreanu SG, Goyal S, Albertolle ME, Lowe E, Teague J, et al. Specificity of protein covalent modification by the electrophilic proteasome inhibitor carfilzomib in human cells. Mol Cell Proteomics 2016;15(10):3233-42.
[Crossref] [Google Scholar] [PubMed]
- Kumar A, Puranik SB, Pattanayekc S. Non-aqueous formulation attempts of carfilzomib formulations and evaluation. Int J Pharm Pharm Res 2020;19(2):733-39.
- Gopireddy RR, Maruthapillai A, Devikala S, Tamilselvi M, Selvi JA, Mahapatra S. DOE approach: A validated stability indicating RP-HPLC method development for the separation of diasteromeric analogs and process impurities of carfilzomib. Mater Today Proc 2019;14:514-31.
- Ao L, Reichel D, Hu D, Jeong H, Kim KB, Bae Y, Lee W. Polymer micelle formulations of proteasome inhibitor carfilzomib for improved metabolic stability and anticancer efficacy in human multiple myeloma and lung cancer cell lines. J Pharmacol Exp Ther 2015;355(2):168-73.
[Crossref] [Google Scholar] [PubMed]
- Hussein HN, Pashavan CT, Patel A, Joshi HS. A rapid sensitive and an efficient method development and validation of carfilzomib by UV-Vis spectrophotometric analysis. World Sci News 2022;168:57-68.
- Varu HL, Kapuriya NP, Bhalodia JJ, Patel RB, Bapodra AH, Ambasana MA. An expeditious spectrophotometric estimation of memantine hydrochloride by facile derivatization using N, N-dimethyl aniline. J Anal Chem 2022;77(11):1433-9.
- Elama HS, Zeid AM, Shalan SM, El-Shabrawy Y, Eid MI. Eco-friendly spectrophotometric methods for determination of remdesivir and favipiravir; the recently approved antivirals for COVID-19 treatment. Spectrochim Acta A Mol Biomol Spectrosc 2023;287:122070.
[Crossref] [Google Scholar] [PubMed]
- Sahini K, Nalini CN. A review on derivative spectroscopy and its benefits in drug analysis. Int J Creative Res Thoughts 2020;8(12):1459-64.
- Redasani VK, Patel PR, Marathe DY, Chaudhari SR, Shirkhedkar AA, Surana SJ. A review on derivative UV-spectrophotometry analysis of drugs in pharmaceutical formulations and biological samples review. J Chil Chem Soc 2018;63(3):4126-34.
- Jain PS, Yeole SD, Ansari NA, Surana SJ. Quantitative estimation of carfilzomib by UV-AUC method. Acta Sci Pharm Sci 2018;2(6):59-62. [Crossref] [Google Scholar] [PubMed]
- Liu N, Wang Y, LI H, Guo W. Determination of carfilzomib for injection by HPLC. Chin Pharma 2016;12:1959-60.
- Agarwal BA, Gandhi SV. Study of forced degradation behaviour of a novel proteasome inhibiting anticancer drug by LC-MS and development of a validated stability-indicating assay method. Int J Pharm Sci Res 2019;10(3):1186-93.
[Crossref]
- Min JS, Kim J, Kim JH, Kim D, Zheng YF, Park JE, et al. Quantitative determination of carfilzomib in mouse plasma by liquid chromatography–tandem mass spectrometry and its application to a pharmacokinetic study. J Pharm Biomed Anal 2017;146:341-6.
[Crossref] [Google Scholar] [PubMed]
- Sestak V, Roh J, Klepalova L, Kovarikova P. A UHPLC-UV-QTOF study on the stability of carfilzomib, a novel proteasome inhibitor. J Pharm Biomed Anal 2016;124:365-73.
[Crossref] [Google Scholar] [PubMed]
- Bommuluri V, Vajjha S, Rumalla CS, Kadari S, Doddipalla R, Kaliyaperumal M, et al. Isolation, identification and characterization of new degradation products of carfilzomib using high resolution mass spectrometry and nuclear magnetic resonance. SN Appl Sci 2019;1:915-29.
- ICH, (Q2R1) Harmonized Tripartite Guideline, Validation of Analytical Procedures: Text and Methodology, IFPMA, Geneva; 2005.
 ): Carfilzomib in methanol; (
 ): Carfilzomib in ethanol; (
 ): Carfilzomib in 0.1 m HCL and (
 ): Carfilzomib in NaoH
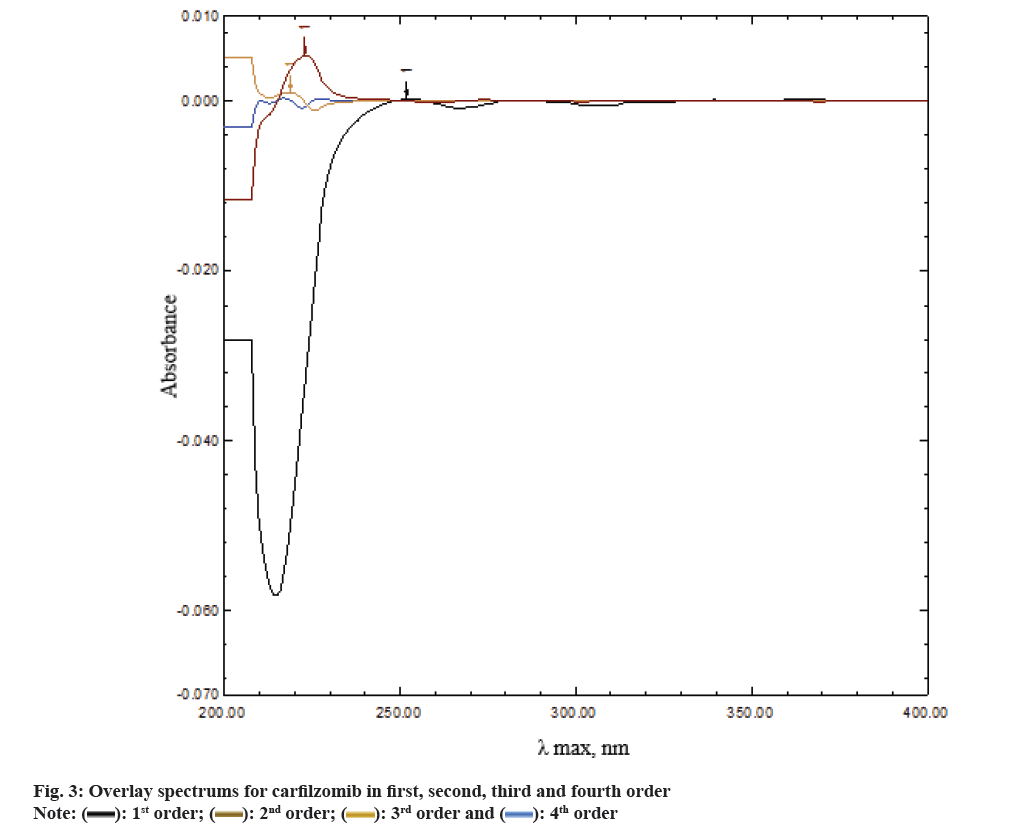
 ): 1st order; (
 ): 2nd order; (
 ): 3rd order and (
 ): 4th order