- *Corresponding Author:
- Zhirong Ding
Department of Critical Care Medicine, Quanzhou First Hospital Affiliated to Fujian Medical University, Quanzhou, Fujian 362000, China
E-mail: dzrqzdyyy@fjmu.edu.cn
| Date of Received | 24 September 2021 |
| Date of Revision | 14 September 2022 |
| Date of Acceptance | 06 February 2023 |
| Indian J Pharm Sci 2023;85(1):249-255 |
This is an open access article distributed under the terms of the Creative Commons Attribution-NonCommercial-ShareAlike 3.0 License, which allows others to remix, tweak, and build upon the work non-commercially, as long as the author is credited and the new creations are licensed under the identical terms
Abstract
Interleukin 10 is one of the important cytokines of immune system inflammatory response in critical diseases such as sepsis. The regulation mechanism of its signal pathway and the mining of key members can provide targets for disease diagnosis and treatment. A large number of studies have analyzed the response of interleukin 10 treated cells by means of transcriptome and identified the members of signal pathway from differentially expressed genes. However, the conditions of different studies are different, resulting in great differences in results. It is necessary to integrate and analyze the inherent differentially expressed genes. In this study, we collected 17 sets of transcriptome experimental results, all of which were analyzed in the treatment of interleukin 10 in peripheral blood cells. Through meta-analysis of 4695 gene expression in all experiments, we screened 134 genes, which were statistically significant differentially expressed genes in the random effect model (p<0.005). These genes enrich biological pathways related to immunity and wounding. Among them, the p value of tissue inhibitor of metalloproteinase 1, leupaxin, FAM20A Golgi associated secretory pathway pseudo kinase and interferon induced protein 44 is ≤9.82e-06. In 17 groups of experiments, the difference trend is relatively consistent and more experiments have detected more than twice the difference. These genes are valuable biomarkers for interleukin 10 related diseases such as sepsis. At the same time, it is a key member of the relatively more conservative interleukin 10 signaling pathway under different conditions.
Keywords
Qing’E pills, network pharmacology, traditional Chinese medicine, postmenopausal osteoporosis
Sepsis is a systemic inflammatory response syndrome caused by microbial invasion and infection. Septic shock and Multiple Organ Dysfunction Syndrome (MODS) are the follow-up symptoms of sepsis. It is one of the main causes of death in hospitalized patients. Early identification of the clinical outcome of patients with sepsis is of great significance, which is helpful to the disease outcome and improves the prognosis. An important feature of sepsis is overexpression of inflammatory mediators such as Tumor Necrosis Factor Alpha (TNF-α), Interleukin (IL)-10, IL-6, IL-9 and macrophage inflammatory protein and release a large number of oxygen free radicals and nitrogen oxides. Proinflammatory and anti-inflammatory factors participate in the early inflammatory response of sepsis[1]. IL-10 is the key anti-inflammatory factor in the inflammatory cascade, which is closely related to the development and prognosis of the disease[2]. At present, a large number of studies have shown that IL-10 may become a drug for the treatment of sepsis, especially the transgenic treatment technology provides the possibility for the application of IL-10, but a large number of animals and clinic are still needed to further prove the feasibility and effectiveness of the application of IL-10 in sepsis.
IL-10 is one of the hubs of the main antiinflammatory factor and cytokine network. The level of IL-10 in plasma is closely related to the occurrence, severity and prognosis of sepsis. IL-10 is an endogenous anti-inflammatory cytokine, which is secreted and regulated by a variety of cells, including T helper 2 (Th2) cells, monocytes/macrophages, dendritic cells and epithelial cells. It has a variety of regulatory effects on inflammatory response, which can reduce the chemotaxis of inflammatory cells and inhibit TNF-α, Interferon-gamma (IFN-γ), release of inflammatory factors such as IL-12 and Nitric oxide (NO)[3]. Its receptors are distributed on a variety of cell surfaces and the level of IL-10 can rise gradually in the early stage of inflammatory response. Rukavina et al.[4] found in the mouse model of intraperitoneal infection with Klebsiella pneumoniae that the level of IL-10 increased within 6 h. The early anti-inflammatory cytokine characteristics of IL-10 make it possible to predict the role of IL-10 in patients with sepsis. Many studies have shown that inflammatory cytokines overexpressed during infection play an important and decisive role in the occurrence and development of inflammatory response. IL-10 can inhibit the characteristics of inflammatory cytokines, which makes its application in inflammatory diseases such as sepsis, adverse drug reactions, rheumatoid arthritis and inflammatory bowel disease possible and plays an important role in inhibiting inflammatory response and promoting disease prognosis[5].
IL-10 can further predict the occurrence of multiple organ failure and with the aggravation of sepsis, IL- 10 also increases[6]. At the same time, IL-10 level can be further used as a predictor of 28 d death in sepsis. In receiver operating characteristic curve analysis, IL-10 level on the day of admission is a strong predictor of 28 d death in patients with sepsis[7,8]. Subsequently, more and more experimental evidence and clinical data show that IL-10 is an immune activating factor in sepsis, but its mechanism is still not very clear. Therefore, how IL-10 regulates cell function needs to be further studied.
Transcriptome analysis is the most commonly used means to analyze regulatory networks. A large number of literatures have reported the study of transcriptome regulation based on IL-10. The transcriptional network of cells was analyzed in a certain cell treated with exogenous IL-10. These cells include human polarized macrophages, peripheral blood mononuclear cells, human monocyte derived dendritic cells, B cells and so on[9-15]. However, there are errors in the analysis results under different experimental conditions and there is a lack of most stable regulation mechanism for the integrated analysis of these transcriptional profiles. Recently, some studies have directly analyzed the transcriptome results by meta-analysis[16]. In the past, the integration analysis often simply compared the repeatability of different experimental results, while the meta-analysis used statistical methods to integrate and recount different experimental results more accurately according to the number of samples and experimental deviation. In this study, we collected the transcriptome data of exogenous IL-10 treatment, integrated them by meta-analysis and analyzed the most statistically significant IL-10 regulatory genes.
Materials and Methods
Strategy of transcriptome data collection:
The reported transcriptome studies were retrieved from various databases, including the Gene Expression Omnibus (GEO) database from the National Center for Biotechnology Information (www.ncbi. NLM. Gov/GEO), and Array Express from European Bioinformatics Institute (EBI) (https://www.ebi.ac.uk/arrayexpress/) using "IL- 10" as the keyword, each database was screened from the establishment date to December 10, 2022. There are no restrictions on language, race or year of publication. Then, the peripheral blood cells such as "peripheral blood", "T cells", "monocytes", "macrophages", "natural killer", "dendritic cells", "B cells" were screened again and only the studies related to peripheral blood were retained. Moreover, the platform of transcriptome research is limited and only the data detected by chip are used. In addition, the experimental and control data of different IL- 10 treatments in the same study were extracted and listed as one experiment. Finally, the references of the retrieved studies were manually checked to determine the control samples and experimental group samples and the experiments with less than 3 samples were eliminated and then the original data source was found. According to the gene ID of different chip platforms, integrate all data and only retain the genes detected in all experiments for further analysis.
Data integration and meta-analysis:
We performed a meta-analysis of all integrated gene transcription tests, including the analysis to calculate the 95 % Confidence Interval (CI) based on the initial raw data; heterogeneity was measured by quantitative Higgins I2 statistics. When the I2 statistical value is higher than 75 %, 50 % and 25 %, it represents large, medium and small heterogeneity, respectively. Therefore, both fixed effect model (I2<50 %, p>0.1) and random effect model (I2≥50 % and p<0.1) were used to measure combined and 95 % CI. Finally, the random effect model is used for treatment. Chi square (χ2) test was performed in the control group to evaluate the deviation from Hardy-Weinberg equilibrium. In these comparisons, p<0.05 were considered significant and all statistical analyses were completed by R software.
Gene Ontology (GO) enrichment and Kyoto Encyclopedia of Genes and Genomes (KEGG) analysis:
Gene set in David (David; http://david.abcc.ncifcrf. gov/) GO enrichment analysis and KEGG analysis is carried out. The functional annotation diagram is used in the analysis and the graphic display results are displayed by R software.
Results and Discussion
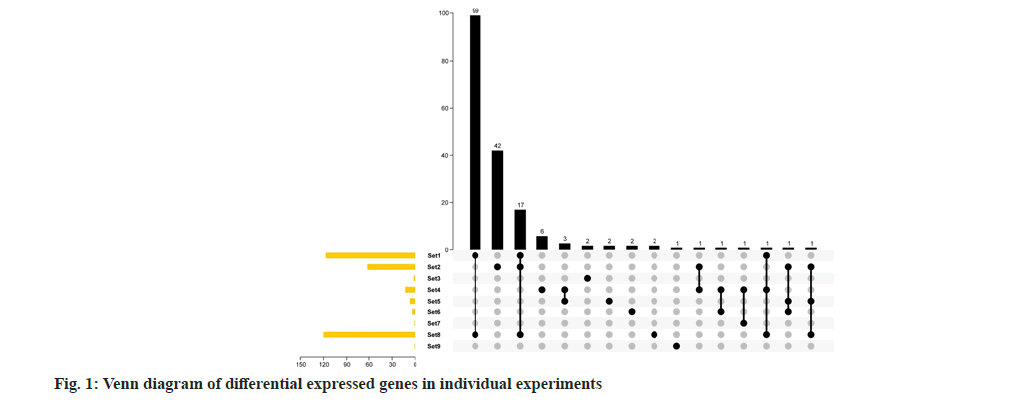
A total of 8 studies were collected and divided into 17 experiments for meta-analysis. There are at least 3 samples and at most 12 samples. The overall number of samples is 72 in IL-10 treatment group and 75 in control group (Table 1). According to the usual analysis method, first analyze the two-fold difference genes of each group of experiments and analyze the repeatability of the difference genes under each group of experiments. It can be seen from the results of Venn diagram that there are not many different genes in each group, up to 120 genes or less than 10 (fig. 1). Only 9 groups of differential genes have overlap, but the overall overlap is not strong. At most, only 17 genes are differentially expressed in set 1, set 2 and set 8. Only set 1 and set 8 have good overlap and a total of 99 genes are differentially expressed genes. This show that only from the double difference gene analysis, the data of each group are integrated, and the repeatability is not good, which is not conducive to mining useful information from the data.
| GSE ID | IL10 | Cells | |
|---|---|---|---|
| Treatment | Control | ||
| GSE55029-1 | 3 | 3 | Macrophages |
| GSE55029-2 | 3 | 3 | Macrophages |
| GSE55029-3 | 3 | 6 | Macrophages |
| GSE57614-1 | 3 | 3 | Macrophages |
| GSE59184-1 | 4 | 4 | Adherent peripheral blood mononuclear cells |
| GSE59184-2 | 4 | 4 | Adherent peripheral blood mononuclear cells |
| GSE45466-1 | 4 | 4 | Human monocyte-derived dendritic cells |
| GSE45466-2 | 4 | 4 | Human monocyte-derived dendritic cells |
| GSE45466-3 | 4 | 4 | Human monocyte-derived dendritic cells |
| GSE45466-4 | 4 | 4 | Human monocyte-derived dendritic cells |
| GSE45466-5 | 4 | 4 | Human monocyte-derived dendritic cells |
| GSE43700 | 4 | 4 | Peripheral blood mononuclear cells |
| GSE35002 | 12 | 12 | Human peripheral B cell |
| GSE35683-1 | 5 | 5 | Cord blood polymorphonuclear leukocytes and monocytes |
| GSE35683-2 | 5 | 5 | Cord blood polymorphonuclear leukocytes and monocytes |
| GSE17493-1 | 3 | 3 | Peripheral blood mononuclear cells |
| GSE17493-2 | 3 | 3 | Peripheral blood mononuclear cells |
| Total | 72 | 75 | |
Table 1: Datasets
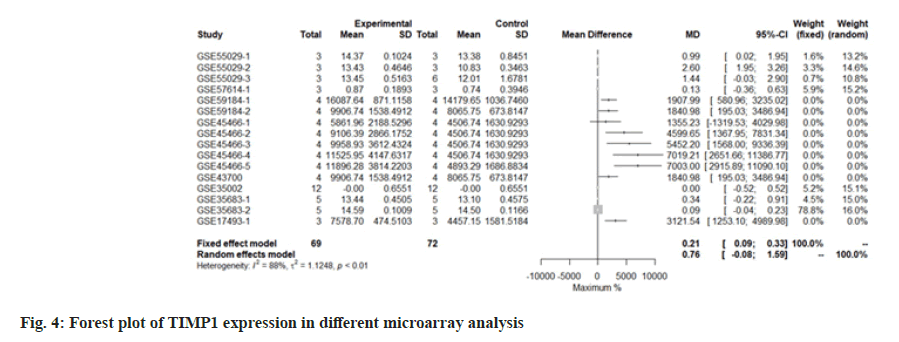
Through the random effect model, meta-analysis, the expression of 4695 genes was calculated from the above transcriptome data and then the screening conditions with p<0.005 were set. A total of 134 genes can be determined as differentially expressed genes. Among them, 8 genes are at the level of 10^-5. Among them, Tissue Inhibitor of Metalloproteinase 1 (TIMP1) is the most significant, p=1.93e-06.
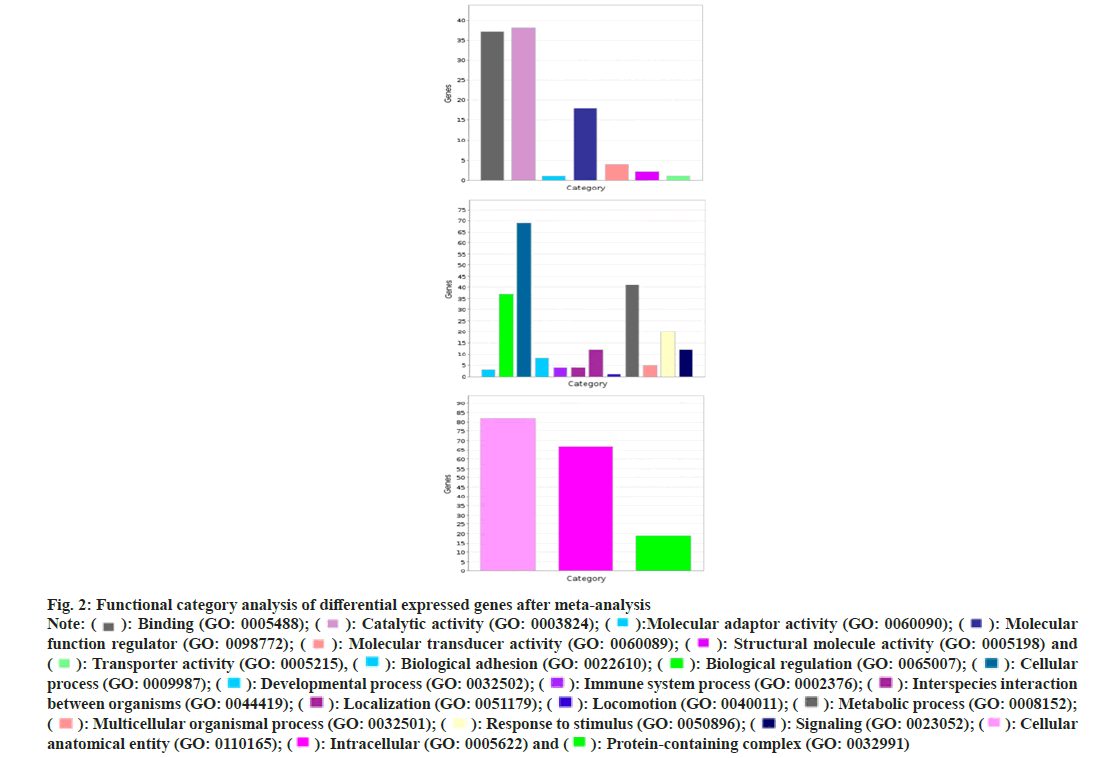
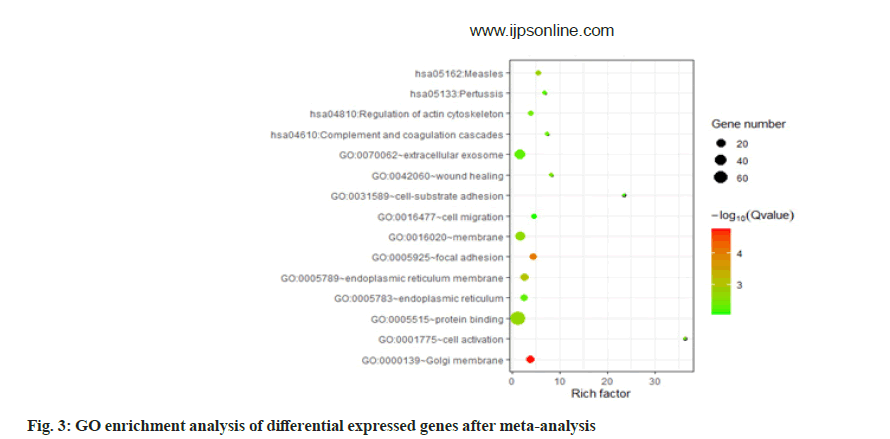
According to the molecular biological function classification of genes, most of the 134 genes have binding (GO: 000548), catalytic activity (GO: 0003824) and molecular function regulator (GO: 0098772). A small number of gene data, molecular transporter activity (GO: 0060089) and transporter activity (GO: 0005215). According to the classification of biological process, most of these genes belong to cellular process (GO: 0009987) and metabolic process (GO: 0008152). There are also a few gene data response to stimulus (GO: 0050896), immune system process (GO: 0002376), signaling (GO: 0023052). According to the classification of subcellular location, more than half of these genes belong to intracellular (GO: 0005622). We performed GO enrichment analysis on these Differentially Expressed Genes (DEGs). The results showed that the genes were enriched in GO: 0000139~Golgi membrane, GO: 0005925~focal adhesions GO: 0005789~endoplasmic reticulum membranes. In blood pressure classification, genes are enriched in GO: 0001775~cell activation, GO: 0042060~won healing, GO: 0031589~cell substrate adhesion, GO: 0016477~cell migration as shown in fig. 2 and fig. 3.
Fig. 2: Functional category analysis of differential expressed genes after meta-analysis
Note: ( ): Binding (GO: 0005488); (
 ): Catalytic activity (GO: 0003824); (
 ):Molecular adaptor activity (GO: 0060090); (
 ): Molecular
function regulator (GO: 0098772); (
 ): Molecular transducer activity (GO: 0060089); (
 ): Structural molecule activity (GO: 0005198) and
(
 ): Transporter activity (GO: 0005215), (
 ): Biological adhesion (GO: 0022610); (
 ): Biological regulation (GO: 0065007); (
 ): Cellular
process (GO: 0009987); (
 ): Developmental process (GO: 0032502); (
 ): Immune system process (GO: 0002376); (
 ): Interspecies interaction
between organisms (GO: 0044419); (
 ): Localization (GO: 0051179); (
 ): Locomotion (GO: 0040011); (
 ): Metabolic process (GO: 0008152);
(
 ): Multicellular organismal process (GO: 0032501); (
 ): Response to stimulus (GO: 0050896); (
 ): Signaling (GO: 0023052); (
 ): Cellular
anatomical entity (GO: 0110165); (
 ): Intracellular (GO: 0005622) and (
 ): Protein-containing complex (GO: 0032991)
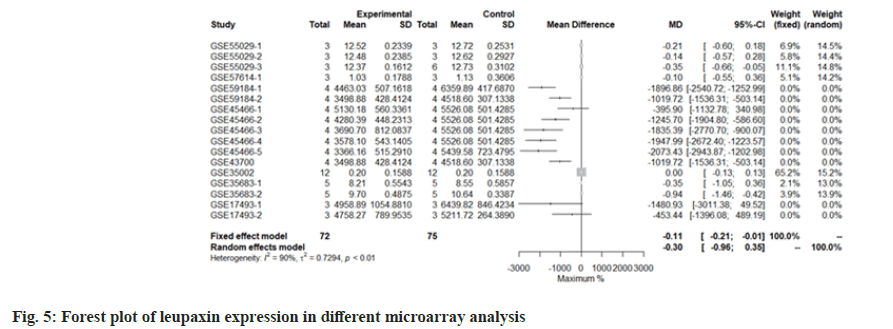
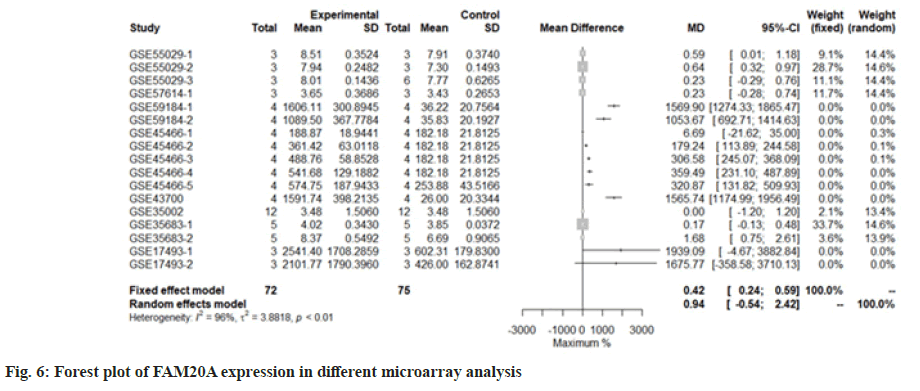
We use the forest tree to show the most statistically significant DEGs. TIMP1 is the most statistically significant DEG, p=1.93e-06. From the forest map, among the 16 experiments, 9 experimental groups are larger than the control group and the difference of 4 experiments is 2 times. The 4 experiments include GSE45466-2, 3, 4 and 5, and there is little difference between the two groups in other experiments. Overall, it has great heterogeneity I2=88 %. According to statistical significance, the second gene was leupaxin, p=3.69e-06 from the forest map, the heterogeneity I2=90 %. In the 16 experiments, the 10 experimental groups were smaller than the control group. In the other experiments, there was little difference between the two groups and there was no experiment with two differences. Further down is FAM20A Golgi Associated Secretory Pathway Pseudokinase (FAM20A), p=8.66e-06 from the forest map, the heterogeneity I2=96 %. Among the 16 experiments, the 9 experimental groups were greater than the control group and the difference reached twice in 8 experiments. There was little difference between the two groups in other experiments. Moreover, Interferon Induced Protein 44 (IFI44), p=9.82e-06 from the forest map, the heterogeneity I2=74 %. Among the 16 experiments, the 10 experimental groups were smaller than the control group and the difference reached twice in 5 experiments. There was little difference between the two groups in other experiments as shown in fig. 4-fig. 7.
Transcriptome analysis is a high-throughput method, which is of great significance to analyze the regulatory mechanism of IL-10. However, the analysis results of high-throughput method in different experiments are difficult to be consistent. Especially in transcriptome analysis, it is difficult to find completely consistent differentially expressed genes in the results of 16 experiments. Although the conditions and environment of each experiment, such as cells, treatment concentration and time are very different, as an important signal cytokine, IL-10 needs to regulate some conservative and fixed reactions. From this point of view, simply observing the repeated results in different experiments is not enough for useful information. In this analysis, in 17 experiments, only duplicate differential genes were found in two experiments. Using the standard meta-statistical analysis, we considered the sample size and the deviation of each experiment and finally obtained 147 statistically significant differentially expressed genes. It shows that our analysis method is improved. For the four most statistically significant genes we analyzed, the trend of increase and decrease was very consistent in 17 experiments and there were basically 2-fold differences in experiments, especially FAM20A. There were 8 times more than 2-fold changes in 9 differential expressions. It shows that it is a key conservative member of IL10 signaling pathway.
Through gene function enrichment analysis, some of the differentially expressed genes we found have been revealed in the published literature to be associated with IL-10 and sepsis. For example, peroxisome proliferator-activated receptor alpha gene enriched in cell activation and wounding has been reported that its agonist can increase the expression of IL-10 in lymphoid organs and play an important role in mouse colitis[17]. In sepsis, it was found that peroxime proliferator-activated receptor delta can regulate inflammation[18].
The most statistically significant differential genes identified by us have also been explained to be associated with IL-10 and sepsis. In 2011, a study infected cattle with respiratory diseases identified the suppressor gene of IL-10, including IFI44[19]. In another study on novel coronavirus, it was found that the excessive release of IL-10 and IFI44 in patients with severe clinical manifestations was higher than that in patients with mild and moderate symptoms[20]. The relationship between IL-10 and TIMP1 is clear. Some reports have confirmed that IL-10 can induce dendritic cells to produce TIMP1, especially in the blood of patients with severe Coronavirus Disease-19 (COVID-19), IL-10 and TIMP1 are potential molecular markers[21]. The role of TIMP1 in sepsis has also been revealed. It is reported that compared with the healthy control group, the plasma concentration of TIMP1 in patients with sepsis is higher, which is a marker of acute renal injury and can be used to predict the prognosis[22]. It has also been reported that plasma TIMP1 concentration is associated with organ dysfunction in patients with sepsis[18]. The change of urinary TIMP1 was even used to determine the progress of sepsis patients and its ratio to matrix metalloproteinase 1 was used as a good diagnostic marker.[23]. Together, the literature has shown that the differential genes we identified are important members of IL-10 pathway.
In conclusion, we used meta-analysis to integrate transcriptome data from different experiments, identified novel differential expressed genes which did not revealed by previous study. These genes could be valuable biomarkers of IL-10 related disease such as sepsis.
Funding:
The work was supported by Fujian Medical University Sailing Fund in 2020 (2020QH1273).
Authors’ contributions:
Taiyu Chen and Jiangfu Liu have contributed equally to this work.
Conflict of interests:
The authors declared no conflict of interests.
References
- Chuang TY, Chang HT, Chung KP, Cheng HS, Liu CY, Liu YC, et al. High levels of serum macrophage migration inhibitory factor and interleukin 10 are associated with a rapidly fatal outcome in patients with severe sepsis. Int J Infect Dis 2014;20:13-7.
[Crossref] [Google Scholar] [PubMed]
- Maier B, Lefering R, Lehnert M, Laurer HL, Steudel WI, Neugebauer EA, et al. Early vs. late onset of multiple organ failure is associated with differing patterns of plasma cytokine biomarker expression and outcome after severe trauma. Shock 2007;28(6):668-74.
[Crossref] [Google Scholar] [PubMed]
- Mosser DM, Zhang X. Interleukin-10: New perspectives on an old cytokine. Immunol Rev 2008;226(1):205-18.
[Crossref] [Google Scholar] [PubMed]
- Rukavina T, Ticac B, Vasiljev V. IL-10 in anti-lipopolysaccharide immunity against systemic Klebsiella infections. Mediat Inflamm 2006;2006(1):69431.
[Crossref] [Google Scholar] [PubMed]
- Standiford TJ. Anti-inflammatory cytokines and cytokine antagonists. Curr Pharm Des 2000;6(6):633-49.
[Crossref] [Google Scholar] [PubMed]
- Moyes DG, Kingston HG. The respiratory effects of tilidine hydrochloride. South Afr Med J 1975;49(32):1297-8.
[Google Scholar] [PubMed]
- Gogos CA, Drosou E, Bassaris HP, Skoutelis A. Pro-vs. anti-inflammatory cytokine profile in patients with severe sepsis: A marker for prognosis and future therapeutic options. J Infect Dis 2000;181(1):176-80.
[Crossref] [Google Scholar] [PubMed]
- Heper Y, Akalın EH, Mıstık R, Akgöz S, Töre O, Göral G, et al. Evaluation of serum C-reactive protein, procalcitonin, tumor necrosis factor alpha, and interleukin-10 levels as diagnostic and prognostic parameters in patients with community-acquired sepsis, severe sepsis, and septic shock. Eur J Clin Microbiol Infect Dis 2006;25:481-91.
[Crossref] [Google Scholar] [PubMed]
- Derlindati E, Dei Cas A, Montanini B, Spigoni V, Curella V, Aldigeri R, et al. Transcriptomic analysis of human polarized macrophages: More than one role of alternative activation? PloS One 2015;10(3):e0119751.
[Crossref] [Google Scholar] [PubMed]
- Montoya D, Inkeles MS, Liu PT, Realegeno S, B Teles RM, Vaidya P, et al. IL-32 is a molecular marker of a host defense network in human tuberculosis. Sci Transl Med 2014;6(250):250ra114.
[Crossref] [Google Scholar] [PubMed]
- Kim EW, De Leon A, Jiang Z, Radu RA, Martineau AR, Chan ED, et al. Vitamin A metabolism by dendritic cells triggers an antimicrobial response against Mycobacterium tuberculosis. mSphere 2019;4(3):e00327-19.
[Crossref] [Google Scholar] [PubMed]
- Braun DA, Fribourg M, Sealfon SC. Cytokine response is determined by duration of receptor and signal transducers and activators of transcription 3 (STAT3) activation. J Biol Chem 2013;288(5):2986-93.
[Crossref] [Google Scholar] [PubMed]
- Ghoneum M, Grewal IS. Change in tumour cell-lymphocyte interactions with age. Hematol Oncol 1990;8(2):71-80.
[Crossref] [Google Scholar] [PubMed]
- van de Veen W, Stanic B, Yaman G, Wawrzyniak M, Söllner S, Akdis DG, et al. IgG4 production is confined to human IL-10–producing regulatory B cells that suppress antigen-specific immune responses. J Allergy Clin Immunol 2013;131(4):1204-12.
[Crossref] [Google Scholar] [PubMed]
- Green DG, de Tejada PH, Glover MJ. Are albino rats night blind? Invest Ophthalmol Visual Sci 1991;32(8):2366-71.
- Liu H, Lin S, Ao X, Gong X, Liu C, Xu D, et al. Meta-analysis of transcriptome datasets: An alternative method to study IL-6 regulation in coronavirus disease 2019. Comput Struct Biotechnol J 2021;19:767-76.
[Crossref] [Google Scholar] [PubMed]
- Lee JW, Bajwa PJ, Carson MJ, Jeske DR, Cong Y, Elson CO, et al. Fenofibrate represses interleukin-17 and interferon-γ expression and improves colitis in interleukin-10–deficient mice. Gastroenterology 2007;133(1):108-23.
[Crossref] [Google Scholar] [PubMed]
- Zingarelli B, Piraino G, Hake PW, O'Connor M, Denenberg A, Fan H, et al. Peroxisome proliferator-activated receptor δ regulates inflammation via NF-κB signaling in polymicrobial sepsis. Am J Pathol 2010;177(4):1834-47.
[Crossref] [Google Scholar] [PubMed]
- Gautam A, Dixit S, Philipp MT, Singh SR, Morici LA, Kaushal D, et al. Interleukin-10 alters effector functions of multiple genes induced by Borrelia burgdorferi in macrophages to regulate Lyme disease inflammation. Infect Immun 2011;79(12):4876-92.
[Crossref] [Google Scholar] [PubMed]
- Jain R, Ramaswamy S, Harilal D, Uddin M, Loney T, Nowotny N, et al. Host transcriptomic profiling of COVID-19 patients with mild, moderate and severe clinical outcomes. Comput Struct Biotechnol J 2021;19:153-60.
[Crossref] [Google Scholar] [PubMed]
- Qi SY, Huang H, Li YK, Pei LG, Zhang WJ. Effects of curcumol on liver function and fibrosis in rats of nonalcoholic fatty liver disease and its mechanism. Zhongguo Ying Yong Sheng Li Xue Za Zhi 2021;37(6):611-5.
[Crossref] [Google Scholar] [PubMed]
- Jones TK, Reilly JP, Anderson BJ, Miano TA, Dunn TG, Weisman AR, et al. Elevated plasma levels of matrix metalloproteinase-3 and tissue-inhibitor of matrix metalloproteinases-1 associate with organ dysfunction and mortality in sepsis. Shock 2022;57(1):41-7.
[Crossref] [Google Scholar] [PubMed]
- Bojic S, Kotur-Stevuljevic J, Aleksic A, Gacic J, Memon L, Simic-Ogrizovic S. Matrix metalloproteinase-9 and tissue inhibitor of matrix metalloproteinase-1 in sepsis after major abdominal surgery. Dis Markers 2018;2018.
[Crossref] [Google Scholar] [PubMed]
