- Corresponding Author:
- S. Ahmad
Department of Pharmacognosy and Phytochemistry,Faculty of Pharmacy, Hamdard University, Hamdard Nagar, New Delhi-110 062, India
E-mail: sahmad_jh@yahoo.com
| Date of Submission | 16 January 2015 |
| Date of Revision | 21 October 2014 |
| Date of Acceptance | 05 October 2013 |
| Indian J Pharm Sci 2015;77(1):49-54 |
Abstract
Alpinetin is a flavonoidal constituent of seeds of Amomum subulatum Roxb., recently reported to possess vasorelaxant and antiHIV activities. Simple, accurate and precise HPLC and HPTLC methods were developed for the analysis of alpinetin in A. subulatum seed extracts and extraction technique was optimized to get maximum yield using conventional, ultrasonic and matrix solid phase dispersion extraction. HPLC was performed on a C18 column with methanol and water (70:30, v/v) as mobile phase at a flow rate of 1.0 ml/min whereas HPTLC on silica aluminum sheet (60F 254 ) using toluene, dichloromethane and ethyl acetate as solvent system. A sharp peak was obtained for alpinetin at a retention time (R t ) of 5.7 min by HPLC and retardation factor (R f ) of 0.48 by HPTLC. Both methods were validated as per the ICH guidelines and the content of alpinetin was estimated in different extracts. Matrix solid phase dispersion technique was found most suitable for extracting alpinetin as compared to other techniques. Validation data are indicative of good precision and accuracy and proved the reliability of the methods.
Keywords
Amomum subulatum Roxb., Alpinetin, HPLC, HPTLC, MSPD
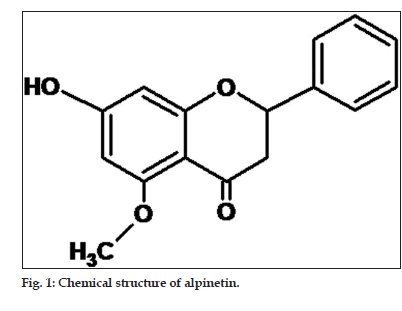
Quality estimation by chemo profiling and marker constituent analysis using modern analytical methods is a tool for phytochemical evaluation. The WHO introduced chromatography for the quality assessment of the plant products and it is accepted as tools for identification and quality control of herbal medicines[1,2]. HPLC and HPTLC are widely accepted analytical techniques due to high accuracy, precision and reproducibility of results whereas, HPTLC has many advantages because of low operating cost and less time consuming[3]. The seeds of Amomum subulatum Roxb. (commonly known as greater cardamom) is a well known drug in Ayurvedic system of medicine in India[4]. The seeds mainly contain terpenes (cineole), flavonoids (alpinetin) and carbohydrates. The drug is aromatic pungent, stimulant, stomachic, alexipharmic, astringent and traditionally used for treatment of GIT disorders, rectal diseases, congestion of liver, pulmonary tuberculosis, as diuretic and as cardiac stimulant[5]. Orally administration of the drug was found to be useful in prevention of hyperlipidaemia and provide antioxidant protection[6]. It was evaluated in the treatment of facial skin wrinkles by prospective, open, Phase-III clinical trial and showed that the active constituents of A. subulatum have potent antioxidant activity[7]. The drug have significant ability to inhibit lipid peroxidation as well as it contains strong reducing power and superoxide radical scavenging activity due to their polyphenol content, protocatechualdehyde and protocatechuic acid[8-10]. Alpinetin is a flavonoidal constituent (fig. 1), which is recently reported to posses vasorelaxant and as antiHIV activities[11-13]. The beneficial properties of A. subulatum on heart disease were also observed and it was found that, one teaspoonful powder with honey twice a day was beneficial to patients with ischemic heart[14]. Protective effect of A. subulatum against stress[10,15,16] also showed that the plant may have potential to cure various diseases related to free radical and metabolic oxidation.
In spite of valuable medicinal uses of the drug, there are no analytical methods reported for its quality control and analysis alpinetin. Hence, in the present investigations, simple, accurate and reliable HPLC and HPTLC methods were developed[17] for the analysis of its important constituent alpinetin in A. subulatum seed extracts. The sample preparation is the valuable factor to analyse exact content of any constituent in crude herbal drugs. Wang et al. (2007) has carried out separation and determination of alpinetin and cardamonin by reverse micelle electrokinetic capillary chromatography[18]. In the present study the extraction technique was optimized by using conventional extraction, Ultrasonic and a new advanced extraction technique Matrix solid phase dispersion (MSPD). MSPD extraction is a cleanup and sample preparation technique from complex matrix like from plants. It simplifies the process and reduces time of extraction utilizing lesser solvent through dissolution and dispersion of organic phase bond to sorbent[19]. Both the chromatographic methods were validated as per the ICH guidelines[20] for accuracy, precision, robustness, limit of detection (LOD) and quantification (LOQ).
Materials and Methods
Alpinetin (98%), ascorbic acid (99.5%) and DPPH were purchased from Sigma Aldrich Ltd., India. HPLC and chromatographic grade acetonitrile, methanol and toluene, dichloromethane, ethyl acetate, formic acid and other analytical reagents were purchased from Merck, India. Milli Q water was used throughout the experiment, which was prepared using a Millipore water purification system (Millipore, USA). Dried fruits of the plant drug was purchased from the local market of Delhi and the specimen (Ref. NISCAIR/RHMD/ Consult/-2008-09/1149/181/02/01-08) was deposited and authenticated at the Raw Material Herbarium and Museum, NISCAIR, New Delhi.
Preparation of sample, conventional extraction (CE)
The seeds of the drug were removed from the dried fruits of . Accurately weighed 2.0 g of seeds were powdered and taken in a 250 ml of round bottom flask. It was extracted at below 50° using reflux condenser using 100 ml of methanol (70%) for three times for complete extraction. The filtered extracts obtained were pooled and evaporated under vacuum to dryness, then reconstituted in HPLC grade methanol and volume was adjusted to 10 ml, which was filtered through 0.22 μm syringe filter before chromatographic analysis.
Ultrasonic extraction (USE)
Accurately weighed 2.0 g of seeds were powdered and taken in a 250 ml of beaker. It was kept in a sonicator for 20 min by adding 100 ml of methanol (70%). The filtered extract obtained was pooled and evaporated under vacuum to dryness and then reconstituted in HPLC grade methanol and volume was adjusted to 10 ml, which was filtered through 0.22 μm syringe filter before chromatographic analysis.
Matrix solid phase dispersion (MSPD) extraction
Two hundred milligrams of seed powder of A. subulatum blended with 800 mg of Silica in a glass mortar pestle to produce homogeneous mixture. It was packed in a 6 ml SPE tube (Agilent Technologies) with filter disc on both sides after compression injection syringe plunger and attached with SPEvacuum manifold (Agilent Technologies). The column was washed with 5% methanol to remove very polar matrix followed by drying under the current of nitrogen. The 70% methanol (3 ml) was added to macerate the mixture in column, which was ultrasonicated for 5 min at 45 KH3 after closing the column with propylene cap. The sample was eluted with 5 ml of solvent (70%, methanol) and elute was dried undercurrent of nitrogen. The residue obtained was redissolved in 1.0 ml of HPLC grade methanol, passed through syringe filter and used for chromatographic analysis.
HPLC instrumentation
Chromatographic experiments were conducted on YL9100 HPLC system (South Korea) HPLC instrument comprising quaternary YL9110 pumps, a variable wavelength programmable YL9120 UV/ Vis detector, YL9130 column oven, and a system controller. The instrument was controlled by use of YL-Clarity software installed with equipment. Samples were injected by using a rheodyne injector fitted with 20 μl fixed loop. Standard and sample solutions were filtered through 0.22 μm syringe filter before injection. The separation was achieved by using column with 25×4.6 mm, particle size 5.0 μm C18 reverse phase column (Luna). The mobile phase used was consisting of methanol and water (70:30, v/v) in isocratic elution. The flow rate was kept as 1.0 ml/min. Individual peaks were identified from retention time and concentrations were determined from the peak area for appropriate sample solutions using regression equation obtained from calibration plot. All the analyses were performed at room temperature and detection was carried out at a wavelength of 290 nm with UV/ Vis detector.
HPTLC
The samples were spotted in the form of bands of width 4.0 mm using microlitre syringe on precoated silica aluminum sheet 60F254 (20×10 cm, 0.2 μm thickness) using Camag Linomat V sample applicator (Switzerland). The plates were prewashed with methanol and activated at 60° for 20 min prior to chromatography. A constant application rate of 120 nl/s was employed and space between two bands was 8.5 mm. The slit dimension was kept at 4.0×0.45 mm and 20 mm/s scanning speed were employed. The mobile phase consisted of toluene:dichloromethane:ethyl acetate (1:1:1, v/v/v) and 15 m of mobile phase was used for per chromatography. Linear ascending development was carried out in 20×10 cm twin trough glass chamber, which was previously saturated with mobile phase for 15 min. The length of the chromatogram run was 80 mm. After the development, TLC plates were dried in a current of air with the help of an air dryer. Densitometric scanning was performed on Camag TLC scanner III operated by winCats software using wavelength 295 nm. The source of radiation utilized was tungsten lamp.
Validation of chromatographic methods
Both the methods for the estimation of alpinetin were validated as per the ICH guidelines[20] for linearity, accuracy, robustness, precision, limit of detection and quantification.
Results and Discussion
There are very limited analytical methods have reported for the analysis of alpinetin[21-23] whereas no any specific analysis was carried out in A. subulatum seed extract. Hence in present study chromatographic methods were developed and validated using HPLC and HPTLC.
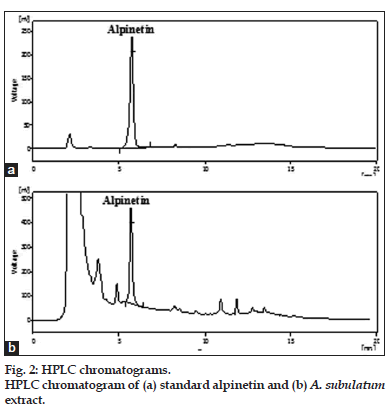
A variety of mobile phases were investigated in the development of HPLC method suitable for analysis of alpinetin in A. subulatum seed but methanol:water, 70:30, v/v was found good and gave sharp peak at Rt 5.7±0.02 with good separation (fig. 2a and b). The system suitability parameters were evaluated for the alpinetin peak in optimized chromatographic conditions, like theoretical plates, tailing factor and asymmetry. For the obtained peak theoretical plates was found 7812, tailing factor 0.971 and asymmetry 0.947, which indicated that the optimized chromatographic conditions are appropriate for separation and quantification of this compounds.
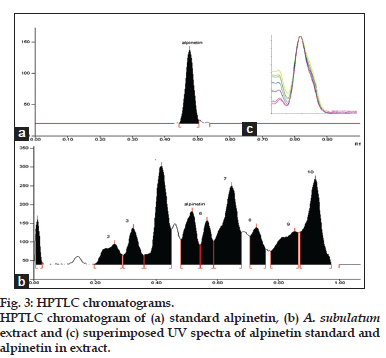
A number of solvent systems were tried for the separation of alpinetin using HPTLC, but toluene:dichloromethane:ethyl acetate in equal ratio was found to be the best. It gave good resolution with well-separated and sharp peak for alpinetin at Rf value 0.48±0.02 (fig. 3a and b). Twenty millilitres of the mobile phase was used to run the chromatogram up to 80 mm length. The optimized chamber saturation time for mobile phase was 15 min at room temperature. Densitometric analysis of alpinetin was carried out in the absorbance mode at 295 nm (fig. 3c) using Deuterium (D2), Tungsten (W) lamp. The linear regression analysis data of alpinetin for the calibration curve in the concentration range of 20-200 ng/spot showed good linear relationship with respect to peak area (Table 1). The values for slope and intercept for the alpinetin was also presented.
The developed methods were validated as per the ICH guidelines for linearity, accuracy, precision, specificity, robustness, LOD and LOQ. Several chromatographic HPLC and HPTLC methods have been developed and validated by the laboratory for herbal drugs[24-27], which are in use for the quality assessment of herbal formulations and crude drugs.
A stock solution of alpinetin containing 500 μg/ml was prepared in methanol and different aliquot were prepared to get known concentrations used for both the methods. The calibration graph was plotted using peak area versus drug concentration. For assessing the linearity, the least square regression equation and correlation coefficient was calculated. The linearity of the calibration plot for the analysis of alpinetin by HPTLC method in the range of 20-200 ng/ml was good with r2=0.994 whereas 7-224 μg/ml with r2=0.999 for the HPLC method. The calibration curve obtained during analysis could be described by the linear Eqn., y=131.6+55.9x and y=229.93+19.53x for HPLC and HPTLC, respectively where Y is peak area and X is the concentration. Summary of calibration plot obtained are presented in Table 1.
The accuracy of the methods was determined by doing recovery studies. For this, preanalyzed samples were spiked with standard in three different levels i.e. 50, 100 and 150% and the mixtures were reanalyzed by the proposed methods. From the data obtained, the developed methods were found to be accurate. The recovery by these methods was found to be within the limit of 96.11-103.06%. The values of recovery % and % RSD for both the methods are depicted in Table 2. Precision of the proposed methods were obtained by repeatability and intermediate precision in accordance with the ICH recommendations. In repeatability, six different injections of same standard sample (three concentrations) were injected and calculated by HPLC method, similarly six plates were developed and area of alpinetin were observed by HPTLC method. The % RSD was calculated for both the method. Interday and intraday precisions were done by preparing and applying three different concentrations of samples in the same day and in three different days, respectively. Interanalyst precision was done by repeating same procedure by using same make by different analyst. The results from the repeatability and intermediate precisions, expressed as % RSD for both the methods were depicted in Table 3.
The specificity of the proposed methods was determined by comparing the sample and standard peak for its Rf, Rt and UV spectra. Three point peak purity i.e. peak start, peak apex, and peak end was compared and found superimposed indicating that standard alpinetin and in sample peaks were not merging with any other components or impurities. The peak purity of alpinetin was assessed by comparing the spectra (fig. 3c).
| Parameters | HPTLC | HPLC |
|---|---|---|
| Linearity range | 20-200 ng/spot | 7-224 µg/ml |
| Regression equation | Ya)=229.93+19.53xb) | Y=131.6+55.9x |
| Correlation coefficient±SDc) | 0.994±0.001 | 0.999±0.000 |
| Slope±SD | 19.53±0.57 | 55.9±0.321 |
| Intercept±SD | 229.53±11.35 | 131.6±22.49 |
Table 1: Linearity Data Of Chromatographic Methods For Alpinetin
| Chromatographic | % of standard | Theoretical | Recovered drug | % of drug | % RSDb) |
|---|---|---|---|---|---|
| Method | drug spiked | content (µg/ml) | (µg/ml)±SDa) | recovered | |
| HPTLC | 0 | 19.6 | 19.17±0.35 | 97.79 | 1.83 |
| 50 | 29.4 | 29.20±0.40 | 99.32 | 1.37 | |
| 100 | 39.2 | 40.30±1.06 | 102.81 | 2.63 | |
| 150 | 49.0 | 49.03±0.46 | 100.07 | 0.94 | |
| HPLC | 0 | 24.0 | 24.07±0.61 | 100.28 | 2.54 |
| 50 | 36.0 | 34.60±0.50 | 96.11 | 1.45 | |
| 100 | 48.0 | 49.47±0.91 | 103.06 | 1.83 | |
| 150 | 50.0 | 59.23±0.42 | 98.72 | 0.70 |
Table 2: Accuracy Of The Chromatographic Methods.
| Method | HPTLC=ng/spot precision precision | precision | ||
|---|---|---|---|---|
| HPLC=µg/ml | %RSDa) | %RSD | %RSD | |
| HPTLC | 50 | 2.50 | 2.49 | 1.93 |
| 100 | 2.15 | 2.22 | 0.68 | |
| 200 | 1.94 | 1.06 | 1.94 | |
| HPLC | 50 | 2.35 | 1.38 | 1.83 |
| 100 | 0.97 | 0.91 | 0.84 | |
| 200 | 2.04 | 1.58 | 0.97 | |
Table 3: Precision of the chromatographic methods.
| Method | Mobile phase composition | Mean | % RSDb) | |
| used | HPLC, methanol: water | area±SDa) | of area | |
| 70:30, v/v | ||||
| HPTLC, toluene: | ||||
| dichloromethane: ethyl | ||||
| acetate 1:1:1, v/v/v | ||||
| Concentration | solvent (v/v) | |||
| HPLC | 50 | 67: 33 | 2868.13±31.12 | 1.09 |
| (µg/ml) | 73:27 | 2872.16±19.32 | 0.67 | |
| 100 | 67: 33 | 5771.65±44.34 | 0.77 | |
| (µg/ml) | 73:27 | 5721.12±70.78 | 1.24 | |
| HPTLC | 50 | 1: 1.1: 0.9 | 1302.80±21.68 | 1.66 |
| (ng/spot) | 1.1: 0.9: 1 | 1295.00±17.52 | 1.35 | |
| 0.9: 1: 1.1 | 1311.29±22.57 | 1.72 | ||
| 100 | 1: 1.1: 0.9 | 2362.70±56.91 | 2.41 | |
| (ng/spot) | 1.1: 0.9: 1 | 2336.83±40.68 | 1.74 | |
| 0.9: 1: 1.1 | 2414.23±26.62 | 1.10 | ||
| Concentration | wavelength | |||
| HPLC | 50 | 287 | 2914.80±61.63 | 2.11 |
| (µg/ml) | 293 | 2846.16±33.03 | 1.16 | |
| 100 | 287 | 5708.32±20.84 | 0.37 | |
| (µg/ml) | 293 | 5721.12±60.84 | 1.06 | |
| HPTLC | 50 | 293 | 1287.60±17.93 | 1.39 |
| (ng/spot) | 297 | 1279.67±26.67 | 2.08 | |
| 100 | 293 | 2379.09±30.13 | 1.27 | |
| (ng/spot) | 297 | 2314.89±19.88 | 0.86 | |
Table 4: Robustness Of TheChromatographic Methods.
The limits of detection and quantification were calculated as per the linearity curve method by using the formula LOD =3.3σ/S and LOQ =10σ/S, where σ is the standard deviation of the response and S is the slope of the calibration plot. For the developed methods LOD was found as 3.4, 7.1 μg/ml and LOQ as 10, 20 ng/spot for HPLC and HPTLC methods, respectively.
Robustness of the method was carried out by introducing small changes in the composition of mobile phase and detection wavelength and the effect on the results were examined as % RSD for both of the methods. Mobile phase having the compositions like of methanol:water (67:33, v/v) and (73:27, v/v) in HPLC and toluene:dichloromethane:ethyl acetate (1:1.1:0.9, v/v/v), (1.1:0.9:1, v/v/v) and (0.9:1:1.1, v/v/v) was tried for HPTLC, respectively. The detection wavelength has changed for both methods (±3) and results were observed. The chromatograms were developed and robustness of the methods were observed at two different concentration levels 50 and 100 ng/spot and 50 and 100 μg/ml for HPTLC and HPLC, respectively (Tables 4).
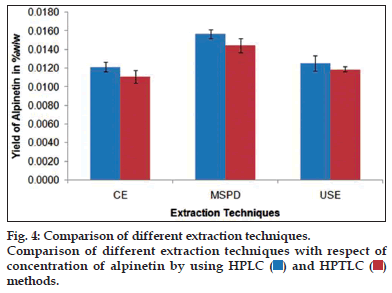
The newly developed and validated HPLC and HPTLC methods were applied for the analysis of alpinetin in A. subulatum seed extracts. The peak areas of triplicate samples were analysed by regression equation obtained from calibration plot to get the content of alpinetin by using both of the methods. The alpinetin content was found to be 0.011 to 0.0157%, w/w in different A. subulatum extracts by using HPLC and HPTLC method, respectively. The maximum yield of alpinetin was observed in sample extracted by MSPD technique whereas conventional extraction was having minimum yield (fig. 4).
Acknowledgements
The authors gratefully acknowledge the sources) of financial support from CCRUM and DST Government of India and thank Dr. H. B. Singh, Scientist F and Head of the Raw Material Herbarium and Museum, NISCAIR, New Delhi for authenticating the plant material.
References
- Farnsworth NR, Akerele O, Bingel AS, Soejarto DD, Guo ZG. Medicinal Plants in Therapy. Bull World Health Organ 1985;63:965-81.
- WHO. Quality Control Methods for Medicinal Plant Material. WHO/ PHARM, Geneva: WHO/PHARM; 1992. p. 559.
- Larsen T, Axelsen J, Ravn HW. Simplified and Rapid Method for Extraction of Ergosterol from Natural Samples And Detection With Quantitative and Semi-Quantitative Methods using Thin Layer Chromatography. J Chromatogr A 2004;1026:301-4.
- The Ayurvedic Pharmacopoeia of India. 1st ed. Part I, Vol. 2. New Delhi: Govt. of India; 1999. p. 158-9.
- Reviews on Indian Medicinal plants. Vol. 2. New Delhi: Indian Council of Medical Research; 2004. p. 215-8.
- Joshi SC, Joshi V. Effect of Amomumsubulatum on Oxidative Stress and Atherosclerosis in Cholesterol Fed Rabbits. Pharmacologyonline 2007;1:451-63.
- Ravichandran G, Bharadwaj VS, Kolhapure SA. Evaluation of the Efficacy and Safety of “Antiwrinkle Cream” In the Treatment of Facial Skin Wrinkles: A Prospective, Open, Phase III Clinical Trial. Antiseptic 2005;102:65-70.
- Dhuley JN. Antioxidant Effects of Cinnamon (Cinnamomumverum) Bark and Greater Cardamom (Amomumsubulatum) Seeds in Rats Fed High Fat Diet. Indian J ExpBiol 1999;37:238-42.
- Kikuzaki H, Kawai Y, Nakatani N. 1,1-Diphenyl-2-Picrylhydrazyl Radical-Scavenging Active Compounds from Greated Cardamom (AmomumsubulatumRoxb.). J Nutr Sci Vitaminol 2001;47:167-71.
- Yadav AS, Bhatnagar D. Modulatory Effect of Spice Extracts on Iron-Induced Lipid Peroxidation in Rat Liver. Biofactors 2007;29:147-57.
- Wang ZT, Lau CW, Chan FL, Yao X, Chen ZY, He ZD, et al. Vasorelaxant effects of cardamonin and alpinetin from Alpiniahenryi K. Schum. J CardiovascPharmacol 2001;37:596-606.
- Tewtrakul S, Subhadhirasakul S, Puripattanavong J, Panphadung T. HIV-1 protease inhibitory substances from the Rhizomes of BoesenbergiapandurataHoltt. Songklanakarin J Sci Technol2003;25:503-8.
- Maridass M, Raju G, Thangavel K, Ghanthikumar S. Prediction of AntiHIV Activity of Flavanoid constituents through PASS. Ethnobot Leaflets 2008;12:954-94.
- Sarkar PR. Yogic Treatment and Natural Remedies. 2nd ed. Tiljala, Kolkata: AMPS Publication; 1986. p. 85.
- Yadav AS, Bhatnagar D. Free Radical Scavenging Activity, Metal Chelation and Antioxidant Power of Some of the Indian Spices. Biofactors 2007;31:219-27.
- Verma SK, Rajeevan V, Bordia A, Jain V. Greater Cardamom (Amomumsubulatumroxb.) a Cardio-Adaptogen against physical stress. J HerbMed Tox 2010;4:55-8.
- Singh M, Kamal YT, Tamboli ET, Parveen R, Siddiqui KM, Ahmad S. Development of Analytical Methods for the Estimation of Alpinetin in Seeds of AmomumsubulatumRoxb. Planta Med 2011;77:89.
- Wang S, Zhou L, He W, Hu Z. Separation and determination of alpinetin and cardamonin by reverse Micelle Electrokinetic capillary chromatography. J Pharm Biomed Anal 2007;43:1557-61.
- Yin J, Wang Y, Tan B, Kang Y, Xie D, Tian L, et al. Matrix Solid-phase dispersion extraction for chromatographic analysis of labdanediterpenoids in Coleus forskohlii. Phytochem Anal 2013;24:117-23.
- International Conference on Harmonization. Q2B Validation of Analytical Procedure: Methodology. Geneva: ICH; 1997.
- Liu L, Chen X, Hu Z. Separation and Determination of Alpinetin and Cardamonin in AlpiniakatsumadaiHayata by Flow Injection-MicellarElectrokinetic Chromatography. Talanta 2007;71:155-9.
- Ding X, Zhao Y, Gao X, Tang Q, Li L, Yu Z. Simultaneous determination of seven effective component in houpuwenzhong capsules using high performance Liquid Chromatography. Se Pu 2009;27:107-10.
- Li Y, Chou G, Yang L, Wang Z. Qualitative and Quantitative Methods for AlpiniaeKatsumadai Semen. ZhongguoZhong Yao ZaZhi 2010;35:2091-4.
- Ahmad S, Rizwan M, Parveen R, Mujeeb M, Aquil M. A Validated Stability-Indicating TLC Method for Determination of Forskolin in Crude Drug and Pharmaceutical Dosage Form. Chromatographia 2008;67:441-7.
- Parveen R, Ahmad S, Baboota S, Ali J, Alka A. Stability-Indicating HPTLC method for quantitative estimation of silybin in bulk drug and pharmaceutical dosage form. Biomed Chromatogr 2010;24:639-47.
- Singh M, Kamal YT, Parveen R, Ahmad S. Development and Validation of a Stability-Indicating HPTLC method for analysis of Arjunolic acid in a Herbal Formulation. J Planar Chromatogr 2011;24:172-5.
- Kamal YT, Singh M, Tamboli ET, Parveen R, Ahmad S. Quantitative Analysis of Berberine in Berberisaristata Fruits and in a Traditional AntiinflammatoryUnani Formulation by Use of a Validated HPLC Method. Acta Chromatographica 2011;23:157-68.


