- *Corresponding Author:
- Qinyu Wang
Departments of Oncology, Nanchang People’s Hospital (Nanchang Third Hospital), Nanchang, Jiangxi Province 330025, China
E-mail: lifeilang4237@163.com
| Date of Received | 14 September 2022 |
| Date of Revision | 03 May 2023 |
| Date of Acceptance | 30 January 2024 |
| Indian J Pharm Sci 2024;86(1):146-155 |
This is an open access article distributed under the terms of the Creative Commons Attribution-NonCommercial-ShareAlike 3.0 License, which allows others to remix, tweak, and build upon the work non-commercially, as long as the author is credited and the new creations are licensed under the identical terms
Abstract
Breast cancer is the cancer with the highest incidence in women in the world. It was to investigate the mechanism of chemotactic cytokine binding protein D6 in the tumorigenicity and metastasis of breast cancer cell. The more invasive human breast cancer cell lines MDA-MB-435 and MDA-MB-231, the less invasive human breast cancer cell lines ZR-75-30 and ZR-75-1, and normal breast epithelial cells Hs578Bst and human normal breast epithelial cell line-100 were selected for the experiments. The differences of D6 messenger ribonucleic acid levels in different cells and the effects of other factors on D6 messenger ribonucleic acid levels were explored. Then, MDA-MB-435 was selected for D6 transfection to make over expressed MDA-MB-435/D6 cells, and the effect of D6 on the tumorigenicity and metastasis of MDA-MB-435 was analyzed by comparative analysis. It revealed as the increasing cell invasion, the D6 messenger ribonucleic acid was obviously decreased; as the increasing interleukin-1 beta concentration, the D6 messenger ribonucleic acid increased clearly; as the raising tumor necrosis factor alpha concentration, the D6 messenger ribonucleic acid was clearly decreased in different degrees (p<0.05). Interferon gamma concentration had no effect on D6 messenger ribonucleic acid level (p>0.05). As against MDA-MB-435 cells, the proliferation and migration of MDA-MB-435/D6 cells were clearly decreased from the 3rd d; the concentrations of C-C motif ligand 2, C-C motif ligand 4, and C-C motif ligand 13 of D6 ligands in MDA-MB-435/D6 were clearly lower (p<0.05). Chemotactic cytokine binding protein D6 is negative regulatory in breast cancer, inhibiting the tumorigenicity and metastasis of breast cancer cell.
Keywords
Chemotactic cytokine, binding protein D6, breast cancer, interleukin-1, tumor necrosis factor alpha
Breast Cancer (BC) is the cancer with the highest incidence in women in the world[1]. By 2020, there are 30 % new BC cases and 15 % of patients die from BC, which seriously threatens women’s physical and mental health. In China, from 2002 to 2014, the incidence rate of BC increased twice as fast as the global average growth rate, and the mortality rate also increased. In addition, the age of Chinese female BC patients is gradually decreasing, and as against Western women, the proportion of premenopausal patients is higher, which poses a serious threat to the health of Chinese women of reproductive age[2]. Although current standardized treatment protocols have improved the survival of BC patients, the increase in morbidity and mortality still indicates the need for new clinical diagnostic and therapeutic measures[3]. Therefore, it is still of great significance to explore new targets for BC treatment, which requires the joint efforts of public health organizations, clinical medical personnel, and scientific researchers. Clinically, the failure of cancer treatment is usually associated with distant metastasis of tumor cells; however, to date, the exact molecular mechanisms involved in distant metastasis of tumor cells remain unclear[4].
Chemotactic Cytokine (CC) is a class of smallmolecule cytokines that can cause chemotactic responses, and they are the largest subfamily of the cytokine family. So far, >50 CC have been found[5]. CC can be divided into four categories, including CXC, CC, C, and CX3C family CC, which can cause the directed migration of lymphocytes and influence various physiology and pathology processes of the body such as embryonic development, angiogenesis, inflammation, tumor, and Acquired Immunodeficiency Syndrome (AIDS)[6,7]. In recent years, many studies have found that CC and their receptor networks take part in the emergence and transfer of tumors, and the complex CC system in tumor tissues affects the growth, transfer, angiogenesis, and invasion of tumor cells[8]. A typical receptor should specifically recognize and bind a ligand, induce signal transduction, and ultimately elicit a cellular response to a signaling substance. However, in the CC receptor system, there exists a special type of receptors, which can specifically recognize and bind ligands, but do not cause cell signal transduction, called decoy receptors or silent receptors[9]. There are at least three decoy receptors in the CC system, namely Duffy Antigen Receptor for CC (DARC), D6, and Chemo Centrex CC Receptor (CCX-CKR). Although these receptors can recognize and bind specific CC, they do not cause subsequent cell signal transduction and cell response, and play a role in clearing CC[10]. Therefore, it is speculated that the decoy receptor D6, which has similar CC scavenging function, may also influence BC growth and transfer.
So far, D6 molecule is not reported in vascular endothelial cells. As for its expression in other tissues or tumors and its biological function in tumors, it has not been reported[11]. D6 is a typical G protein-coupled receptor, which can bind almost all inflammatory CC (C-C Motif Chemokine Ligand (CCL) 2-5, 7, 8, 11-14, and 22, and has a weak binding ability to CCL-17, but does not bind to homeostatic and other CC[12]. D6 molecules recognize inflammatory CC specifically and bind only those with biological activity, but not those with any biological function such as CCL22. In vitro experiments have found that following binding to the ligand, D6 can rapidly swallow and degrade the ligand without causing signal transduction[6]; in vivo experiments suggest that it can inhibit skin inflammation. Relative to wild-type mice, D6 gene knockout mice have earlier, heavier, and longer skin inflammatory response, and significantly increased CC in inflammatory tissues, suggesting that the enhanced inflammatory response in D6- deficient mice is related to the uncontrolled CC system[13]. D6 protects the embryo from systemic inflammation or autoimmune abortion induced by antiphospholipid antibodies, revealing that it is important in CC homeostasis.
Therefore, to further explore the role of CC binding protein D6 in Breast Cancer Cell (BCC) tumorigenicity and metastasis, it selected several breast cells with different invasive characteristics for comparison. D6 over expressed MDA-MB-435/ D6 cells by D6 transfection were constructed to compare them with the transfected cells. It aimed to provide a help for the treatment of BC in the future.
Materials and Methods
Research materials:
Six cell lines with different invasiveness were selected for the experiments, including the more invasive MDA-MB-435 and MDA-MB-231, the less invasive ZR-75-30 and ZR-75-1, and normal breast epithelial cells Hs578Bst and HBL-100.
Cell culture:
Human BCC lines MDA-MB-231 and methyl-4- dimethylaminoazobenzene-435 were cultured with L-15, and ZR-75-30 and ZR-75-1 with Roswell Park Memorial Institute (RPMI)-1640. All media were supplemented with 10 % Fetal Bovine Serum (FBS). They were digested with 0.25 % trypsin and passaged at a ratio of 1:3.
Induced expression of D6:
MDA-MB-231 cells were cultured to 90 %, then cultured in serum-free L-15 medium for 2 d, and then treated with serum-free medium containing Interleukin-1 Beta (IL-1β), Tumor Necrosis Factor-Alpha (TNF-α), and Interferon-Gamma (IFN-γ) at 10 ng/ml, 20 ng/ml, and 30 ng/ml for 24 h, respectively, to collect cells.
Cell Ribonucleic Acid (RNA) electrophoresis:
RNA denaturation: 1.0 μl of RNA, 1.0 μl of 5× 3-(N-morpholino)propanesulfonic acid (MOPS), 0.9 μl of Formaldehyde (HCHO), and 2.5 μl of Formamide (HCONH2) were mixed at 65° for 15 min, then removed and placed in ice water for 3 min. 1.0 μl of sample loading buffer was added and mixed.
Agar gel: 0.24 g agar, 14.4 ml Milli-Q® water, 2 ml 10×MOPS, 3.6 ml HCHO, and 1.0 μl EB were mixed. Electrophoresis solution has 35 m1 10×MOPS and 315 m1 MQ water .
Electrophoresis: Electrophoresis was performed in an i-Mupid electrophoresis apparatus at 100V for 30 min, and the gel was washed with MQ water overnight, and imaging under the gel imaging system.
Stable D6 gene transfection:
MDA-MB-435 in log phase in six-well plate, the number of cells was 3×10⁵/well. 2 ml Dulbecco's Modified Eagle Medium (DMEM) medium containing 10 % FBS was added to each well and it was cultured in an incubator at 37° and 5 % Carbon dioxide (CO2) for 18 h-24 h. When it reaches 70 %-80 %, the experiment can be started.
2 μg plasmid cloning Deoxyribonucleic Acid (pcDNA) 3.0 and 100 μl serum-free DMEM medium were put into 1.5 ml centrifuge tube and mixed. Then, 5 μl lipofectin and 100 μl DMEM medium were put into a 1.5 ml centrifuge tube and mixed.
The above two tubes of liquid were mixed, and 100 μl DMEM medium was put. It was mixed and left for 30 min to fully encapsulate the liposomes and D6 gene expression plasmid.
After the culture medium was removed by suction, each well was cleaned twice with 1 ml DMEM medium. The mixture of 1 ml liposome and D6 gene expression plasmid was added to wells 1, 2, and 3 of the six-well plate, respectively.
Through 8 h of incubation, 1 ml DMEM medium was put. Following 6 h of culture, the liquid in each well was aspirated and replaced with DMEM medium. After 72 h, cells were digested with trypsin and cultured in a 90 mm dish.
After the cells in the culture dish adhered to the wall, G418 was added at 400 μg/ml, and the culture medium was replaced every 3 d; G418 was gradually raised to 1000 μg/ml, and following 3 w to 4 w, the cell clones with drug-resistant characteristics were screened out. The expressed D6 was tested by Reverse Transcription-Polymerase Chain Reaction (RT-PCR) and Western blot to obtain MDAMB- 435 cell line with stable highly expressed D6.
Identification of clones:
Identification of transcript levels: The cells to be tested were washed twice with precooled sterile Phosphate-Buffered Saline (PBS). Blotted the residual liquid, the cells were lysed with Trizol at 1 ml/cm2. The cell lysate was transferred to a 2 ml centrifuge tube and left for 5 min at room temperature. 200 μl chloroform was put into the cell lysate, and through vigorous shaking, it was left at room temperature for 3 min. Centrifugation at 12 000 rpm for 15 min at 4°. The upper aqueous phase containing RNA was aspirated and transferred to another centrifuge tube; addition of isopropanol with the same volume of water, it was mixed gently, letting it stand for 10 min at room temperature. RNA was precipitated by centrifugation at 12 000 rpm for 10 min at 4°. The supernate was discarded and 1 m1 of 75 % ethanol (prepared with Diethyl Pyrocarbonate (DEPC) water) was put to wash RNA. Centrifugation at 7500 rpm for 8 min at 4°, the supernate was discarded. The RNA precipitate was dried in air for 10-20 min and dissolved in 20 μl DEPC water. The 1 μl RNA solution was diluted to 400 μl with double distilled water. The Optical Density (OD260) and OD280 were detected by ultraviolet spectrophotometer and the RNA concentration was estimated (control=OD260×40×dilution multiple×10-3 μg/μl). RNA was adjusted to 1 μg/ μl with DEPC water and stored in a refrigerator at -70°.
10 μl DEPC water, 4 μl 10×Buffer, 2 μl of 10 mM deoxy Nucleotide Triphosphates (dNTPs) as well as 1 μl random primers, Avian Myeloblastosis Virus (AMV) reverse transcriptase, Ribonuclease (RNase) inhibitor, and total RNA of the sample were successively added to the 20 μl RT-PCR system (starting with 3.0 μg total RNA). It was mixed lightly, 70° for 2 min; 42° for 15 min; 90° for 5 min; following ice bath for 5 min, centrifugation was carried out and it was stored at -20°. Then, 5 μl complementary DNA (cDNA) template, 1 μl l0 mM dNTP, 3 μl 25 mM Magnesium chloride (MgCl2), 5 μl l0×buffer, 1 μl D6 upstream and downstream primers, 0.5 μl Taq enzyme, and 33.5 μl sterile water were put into a 200 μl centrifuge tube. The primer sequence related parameters are given in Table 1.
| Primer sequences | Primer (5'→3') |
|---|---|
| D6 upstream | GCCATGTTCTACGGAGACCTG |
| D6 downstream | TCTTAGCAGCGTACAGAGTGG |
| GAPDH upstream | TGTGGGCATCAATGGATTTGG |
| GAPDH downstream | ACACCATGTATTCCGGGTCAAT |
| CCL4 upstream | GCTTTTCTTACACTGCGAGGA |
| CCL4 downstream | CCAGGATTCACTGGGATCAG |
| CCL2 upstream | GTTGCCTCAAGTACAGCCAAA |
| CCL2 downstream | AGAACAGGATAGCTGGGATGG |
Table 1: Primer Sequences and Annealing Temperatures
Reaction conditions for D6 were as follows; predenaturation at 94° for 5 min, followed by 94° for 30 s, 60° for 30 s, 72° for 1 min, and extension at 72° for 7 min. The optimal cycle numbers were all in the exponential expansion phase. PCR products were stored at 4°. 10 μl of the PCR reaction product was electrophoresed on 1.2 % agarose, and the results were analyzed by a gel imaging system.
Identification of protein levels: Standard Bovine Serum Albumin (BSA) solutions with concentration gradients of 0 mg/l, 6.25 mg/l, 12.5 mg/l, 25 mg/l, 50 mg/l, and 100 mg/l were prepared with deionized water. 3 μl BSA solutions with different concentrations were added into six tubes of the mixture composed of 800 μl deionized water and 200 μl protein-dye, respectively, and shaken thoroughly to mix. 150 μl of each sample was put to a 96-well plate, and the OD value of each sample (600 nm filter) was measured by an automatic microplate reader. Three control wells were set for each sample, and the average OD value was used to trace the labeling curve. The OD value of the protein samples was measured by the same method, and the protein concentration was read out according to the standard curve.
When the cells reached 80 %-90 % of the bottom of the bottle, the culture medium was discarded and it was washed twice with pre-cooled PBS. The corresponding volume of protein lysate in the culture flask, the solution was placed on ice for 5-20 min. Cells were scraped off with a scraper and collected into a precooled 1.5 ml centrifuge tube. Centrifugation at 12 000 rpm for 20 min at 4°, the supernate was packed as needed and stored at -20° or -70°. Sodium Dodecyl Sulphate (SDS) polyacrylamide gels were prepared according to the guidelines for molecular cloning experiments. The separation glue was 10 % and the concentrate glue was 5 %. Equal amounts of protein (100 μg) from different samples were mixed with 1×SDS protein loading buffer, denatured at 100° for 10 min, and centrifuged at 12 000 ×g for 5 min at 4°. Samples were loaded with the supernate obtained by centrifugation and subjected to electrophoresis at 45 V. When the electrophoresis reached the boundary between the concentrating gel and the separating gel, the voltage was adjusted to 90 V, and the electrophoresis was stopped when the blue band to the lowest edge of the gel. The gel was peeled off the glass plate and placed in the transfer solution. 63 m filter papers and one nitrocellulose membrane with the same size as the gel were cut. Then, the negative electrode, three sheets of filter paper, gel, nitrocellulose membrane, three sheets of filter paper, and positive electrode were stacked neatly. After the electrode was aligned, it was inserted into a membrane transfer holder, and the membrane was transferred in an ice tank at 300 mA for 2 h. The transferred nitrocellulose membrane was immersed in Phosphate Buffered Saline with Tween20 (PBST) solution containing 5 % milk and blocked (shaking gently on a horizontal shaker for 45 min). The closed nitrocellulose membrane was washed twice with PBST solution for 5 min each time. The concentration of primary antibody (rabbit antibody) against D6 was adjusted to 1:500 with blocking solution and incubated with the membrane overnight at 4°. The nitrocellulose membrane conjugated with secondary antibody was washed 3 times with PBST for 10 min each time. Development was performed in a dark room according to the instructions of the kit. The clone with D6-positive confirmed at both transcriptional and protein levels were termed MDA-MB-435/D6.
RT-PCR method:
The 20 μl reaction system included 0.5 μl of upstream and downstream primers, 2× mix 10 μl (containing reaction buffer, dNTP, MgCl2, SYBR Green I, Taq DNA polymerase), 8 μl of sterilized MQ water, and 1 μl of cDNA. The reaction conditions were the same as above. The target reading temperature of Glyceraldehyde 3-Phosphate Dehydrogenase (GAPDH) and D6 was 82°, and the critical point was set at the PCR amplification process. The Cycle threshold (Ct) corresponding to the inflection point of fluorescence signal to the exponential amplification stage was adopted as an indirect indicator of the initial template concentration. The relative quantitative results of D6 messenger Ribonucleic Acid (mRNA) were analyzed by △Ct or 2-△△Ct.
Cell proliferation assay:
MDA-MB-435 and MDA-MB-435/D6 were cultured in DMEM medium having 10 % FBS. The cells in log phase in 96-well plates at 2500 cells/well (100 μ1/well). Each well was set up three controls, and only the well without cells was adopted as blank control. After the cells adhered to the wall, 10 μl Cell Counting Kit-8 (CCK-8) was put and incubated for 2 h. The OD values were determined by the device at 450 nm wavelength. Through 7 consecutive days of testing, the average value of each sample was taken for contrast.
Cell cycle detection:
Culture in serum-free medium for 48 h to make most of the cells arrested in G1 phase and culture in DMEM medium with 10 % FBS for 12 h-16 h. At the end of culture, the cells were washed twice with precooled PBS and digested with 0.25 % trypsin to make single cell suspension. It was added to absolute ethanol drop by drop to achieve 75 %; it was fixed on ice for 1 h or placed in a refrigerator at -20° and detected within a week. In detection treatment; cells were washed twice with pre-cooled PBS and resuspended in 300 to 500 μ1 of 1×PBS with 20 μg/ml RNase, 0.2 % Triton X-100, 0.2 mM Ethylenediaminetetraacetic Acid (EDTA), and 20 μg/ml Propidium iodide. They were placed in a water bath at 37° for 15-30 min. The DNA content of the cells was measured by flow cytometry and manually corrected by Modfit program.
Detection of cell invasion ability:
Transwell and Matrigel were adopted to explore the effect of D6 on cell invasion. Transwell, 24- well culture plate, Matrigel, phenol red-free DMEM medium, and suction nozzle were placed in a 4° refrigerator overnight. The artificial basement membrane was prepared by mixing Matrigel and phenol red-free DMEM medium at a ratio of 1:3. Transwell was placed in a 24-well culture plate, and 50 μl of the mixture was added to the upper chamber, and incubated at 37° for 2 h to solidify. Serum-free and phenol red-free DMEM medium (100 μl and 600 μl) was put to the chambers, respectively, incubation at 37° for 8 h. Cells in logarithmic phase were cultured in DMEM medium at 1×10⁶/ml, respectively. The culture medium was discarded, and 100 μl cell suspension (1×10⁵ cells) was put to the upper, and 600 μl DMEM medium having 5 % fibronectin to the lower, with three controls in each chamber. The upper was taken; the cells that failed to invade were erased. They were fixed with neutral formaldehyde for 30 min, and routinely stained adopting Hematoxylin and Eosin (H&E). Under a light microscope at 200× magnification, 5 fields were randomly selected to count the infiltrating cells, and the average values were obtained.
Detection of D6 ligand concentration changes in cells:
Cells were cultured in serum-free medium for 48 h. Culture of the cells in DMEM medium with 10 % FBS, 100 μl of each cell culture supernate was taken at 24 h. The concentration of D6 ligand was detected by Enzyme-Linked Immunosorbent Assay (ELISA) kit, and the experimental steps were carried out strictly according to the instructions of the kit.
Statistical methods:
Statistical Package for the Social Sciences (SPSS) 23.0 software was adopted for statistical analysis of all experimental data, one-way analysis of variance for contrast between groups. p<0.05 was considered statistically meaningful.
Results and Discussion
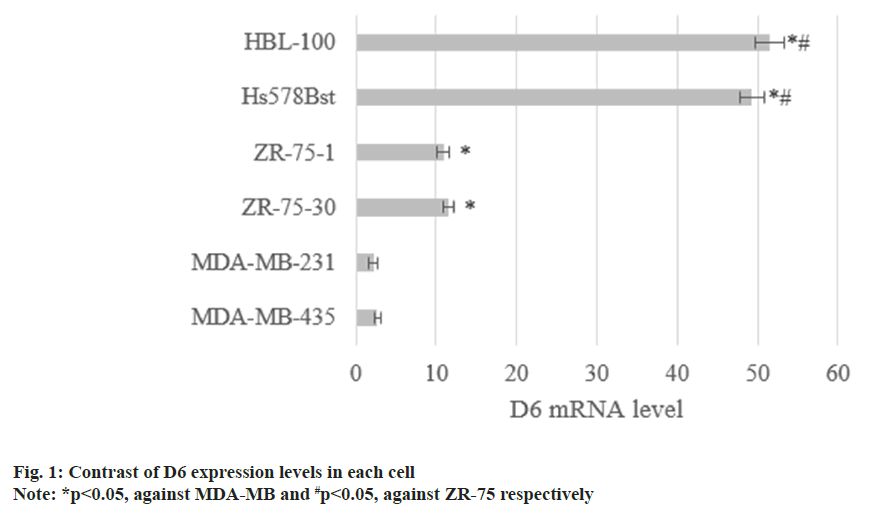
The D6 mRNA in MDA-MB-435 as well as MDA-MB-231 was (2.7±0.4) and (2.2±0.6), respectively. D6 mRNA in ZR-75-30 and ZR-75-1 were (11.5±0.7) and (10.9±0.8), and that in noninvasive Hs578Bst and HBL-100 was (43.9±1.5) and (51.6±1.8). D6 mRNA decreased with raised cell invasiveness (p<0.05) as shown in fig. 1.
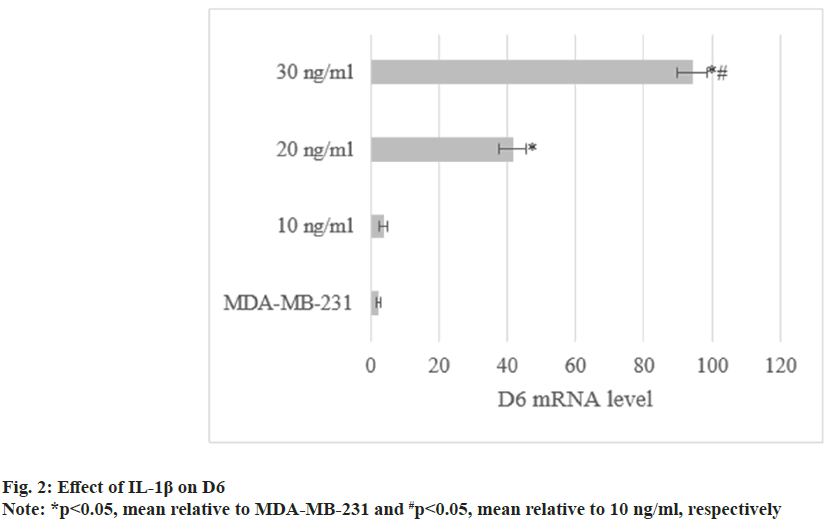
Through treatment with IL-1β, D6 mRNA levels in MDA-MB-231 were (3.8±1.1), (41.6±3.9), and (94.2±4.5). They increased with increasing concentrations of IL-1β (p<0.05) as shown in fig. 2.
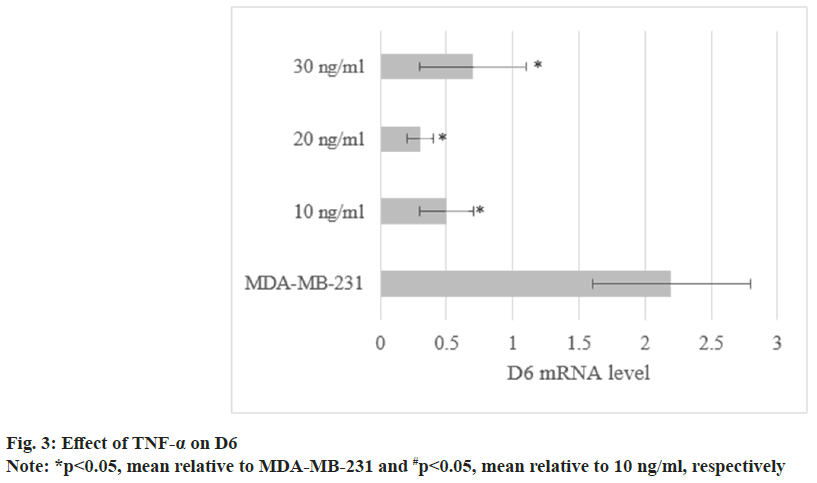
The levels in MDA-MB-231 treated with TNF-α were (0.5±0.2), (0.3±0.1), and (0.7±0.4). As against untreated cells, the levels were decreased to varying degrees (p<0.05) as shown in fig. 3.
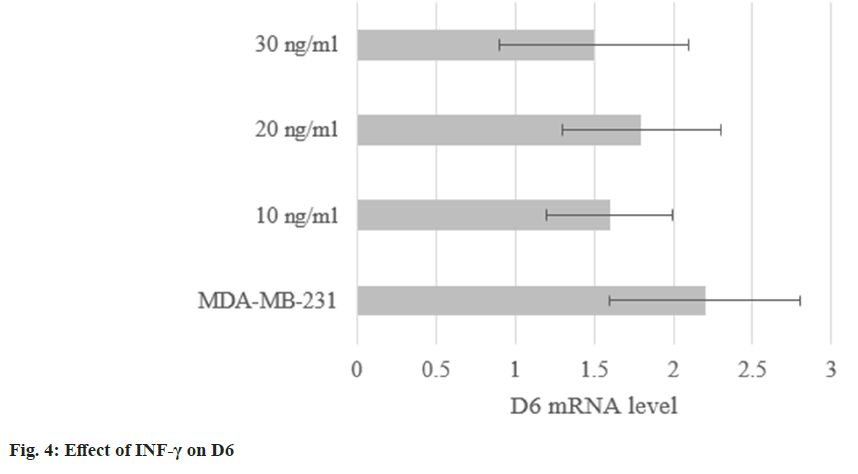
The levels in MDA-MB-231 treated with INF-γ were (1.6±0.4), (1.8±0.5), and (1.5±0.6). They were not obviously altered (p<0.05) as shown in fig. 4.
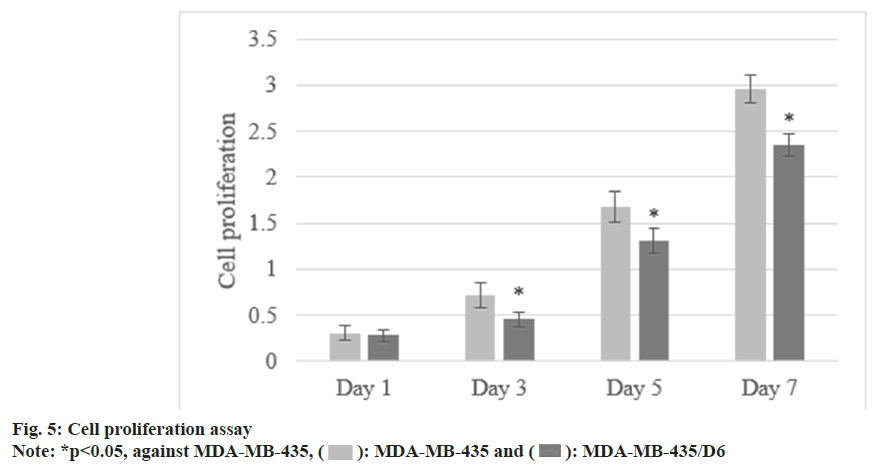
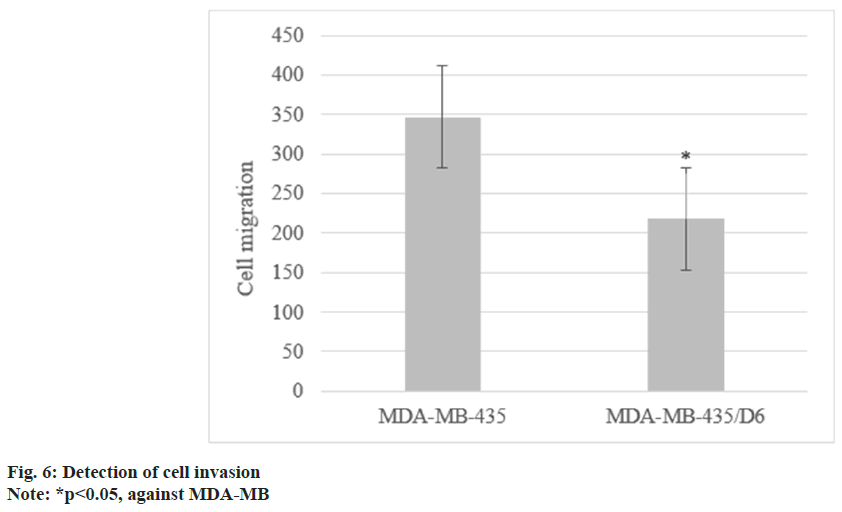
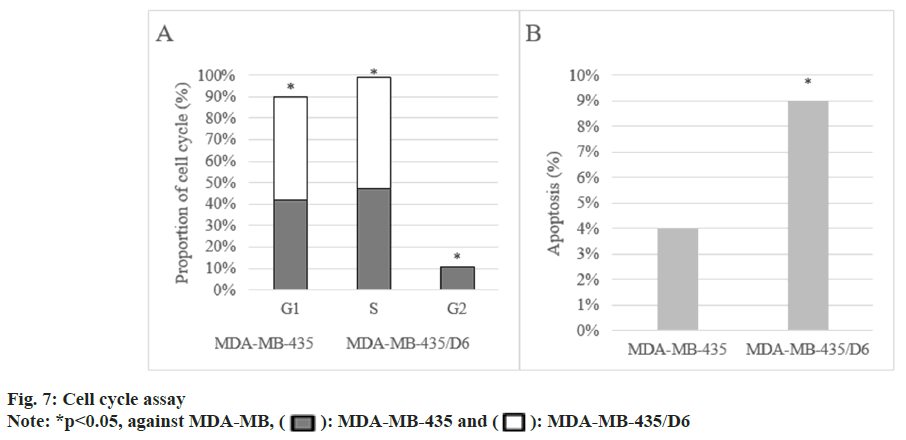
Following 1 d, 3 d, 5 d, and 7 d of cell culture, the proliferation of MDA-MB-435 were (0.31±0.08), (0.72±0.13), (1.68±0.17), and (2.96±0.15), respectively, and that of MDA-MB-435/D6 were (0.28±0.06), (0.46±0.08), (1.31±0.14), and (2.35±0.12), respectively. From the 3rd d, MDA-MB-435/D6 proliferation was reduced (p<0.05) as shown in fig. 5. The migrated number of them was 347±21 and 218±26, respectively (p<0.05) as shown in fig. 6. MDA-MB-435/D6 were concentrated in G1 and S phases, and 9 % underwent apoptosis, which was more as against MDA-MB-435/D6 (p<0.05) as shown in fig. 7.
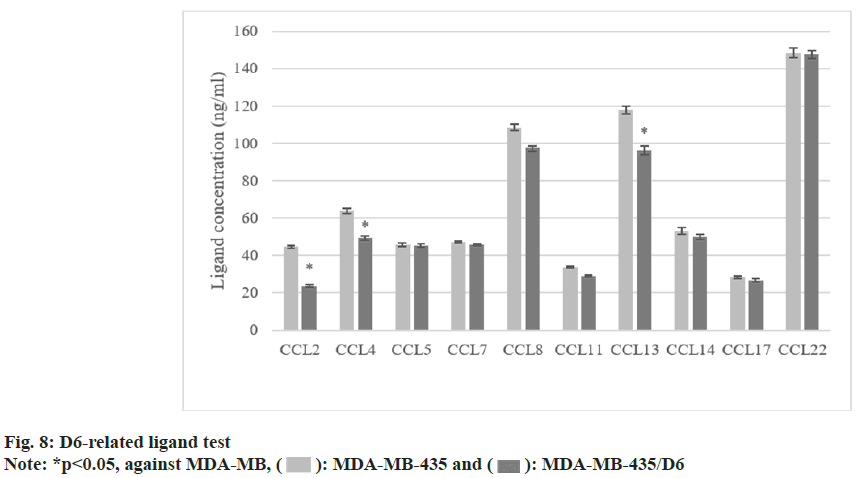
The concentrations of CCL2, 4, and 13 were (44.6±0.8) ng/ml, (63.8±1.3) ng/ml, and (117.8±2.2) ng/ml in MDA-MB-435. All were higher as against MDA-MB-435/D6 (p<0.05). The concentrations of other ligands were different, but not statistically significant (p<0.05) as shown in fig. 8.
D6 has a typical G protein-coupled receptor structure but it does not have a typical function. As a CC receptor, it does not bind to the homeostatic CC and other CC[14]. Even for inflammatory CC, D6 binds only those that are biologically active and not those that are not biologically functional. Upon binding to the ligand, it rapidly cleans the ligand through endocytosis and lysosomal degradation without causing any signal transduction and cellular response, acting as a CC clearance groove[15]. The D6 mRNA in different cell lines were compared and analyzed. It suggested that it decreased with the increase of cell invasiveness (p<0.05). It was also different in different BCC, and it in normal breast cells was markedly higher as against BCC, suggesting that D6 may be negatively correlated with cell tumorigenicity and invasion ability. Similar studies abroad have found that dual topoisomerase inhibitor P8-D6 can effectively induce BC apoptosis[16]. The development of BC diagnosis and treatment requires not only excellent medical technology, standardized guidelines, but also the extensive implementation of multidisciplinary diagnosis and treatment models, the improvement of innovative drug accessibility, and the improvement of public awareness of early diagnosis and early treatment.
Cytokines could regulate the expressed D6 mRNA, but the specific significance needs to be further explored. In MDA-MB-231, it was found it increased with the increase of IL-1β concentration; TNF-α could inhibit its expression in different degrees (p<0.05). INF-γ had no effect on it. Then, MDA-MB-435 was selected, and MDAMB- 435/D6 was constructed. The proliferation, invasion, and cell cycle changes of D6 BCC were investigated. It revealed that as against the cells without D6 transfection, the proliferation and migration of MDA-MB-435/D6 were reduced, and most of them were concentrated in G1 and S phases, with more apoptosis (p<0.05). It suggests that D6 can inhibit the recruitment of pro-tumor cells, inhibit pro-tumor inflammation, and block the inflammatory response that is conducive to tumor growth[17]. The concentrations of three D6 ligands in MDA-MB-435 were higher (p<0.05), and there was no clear difference in the remaining ligands (p>0.05). Tumor cells can secrete CC, and most of them, such as CCL2 and CCL5, directly promote the growth and invasion of tumor cells[18]. D6 may inhibit tumor cells through clearing these CC. Xu et al.[19] pointed out that CXCL14 is a key regulator of lymph node transfer in BC.
These results indicate that when BCC is transfected with D6, the apoptosis is clearly increased. Therefore, it can be concluded that CC binding protein D6 is negative regulatory in BC, which inhibits tumorigenicity and metastasis of BCC. In addition, D6 mRNA expression in BCC was also found to be regulated by some cytokines, but the specific significance needs to be further explored. In conclusion, the further study of D6 makes a direction for the clinical preventing and treating BC. The understanding of BC is still very limited, and there will still be many problems and challenges in the future. With the continuous update of medical technology, it is believed that there will be more and better choices for BC patients.
Conflict of interests:
The authors declared no conflict of interests.
References
- Lin X, Hu S, Chen H. Analysis of the predictive value of tumor neutrophil-associated signature in breast cancer. J Biol Regul Homeost Agents 2022;36(4):985-93.
- Huang SJ, Wang J, Wang JL. Immunotherapy for sepsis induced by infections: Clinical evidence and potential targets. Discov Med 2022;34(172):83-95.
[Google Scholar ][PubMed]
- Renzhi L, Zihan G, Qi Z. Study on the prognostic value and molecular mechanism of HMGA1 in breast cancer patients. Acta Med Mediterr 2022;38(6):3923-7.
- Huang Y, Hong W, Wei X. The molecular mechanisms and therapeutic strategies of EMT in tumor progression and metastasis. J Hematol Oncol 2022;15(1):129.
[Crossref] [Google Scholar] [PubMed]
- Cai X, Deng J, Ming Q, Cai H, Chen Z. Chemokine-like factor 1: A promising therapeutic target in human diseases. Exp Biol Med 2020;245(16):1518-28.
[Crossref] [Google Scholar] [PubMed]
- Shroka TM, Kufareva I, Salanga CL, Handel TM. The dual-function chemokine receptor CCR2 drives migration and chemokine scavenging through distinct mechanisms. Sci Signal 2023;16(770):eabo4314.
[Crossref] [Google Scholar] [PubMed]
- D’Agostino G, Garcia-Cuesta EM, Gomariz RP, Rodriguez-Frade JM, Mellado M. The multilayered complexity of the chemokine receptor system. Biochem Biophys Res Commun 2020;528(2):347-58.
[Crossref] [Google Scholar] [PubMed]
- Korbecki J, Kojder K, Simińska D, Bohatyrewicz R, Gutowska I, Chlubek D, et al. CC chemokines in a tumor: A review of pro-cancer and anti-cancer properties of the ligands of receptors CCR1, CCR2, CCR3, and CCR4. Int J Mol Sci 2020;21(21):8412.
[Crossref] [Google Scholar] [PubMed]
- Yuan F, Li D, Li C, Zhang Y, Song H, Li S, et al. ADAM17 is an essential attachment factor for classical swine fever virus. PLoS Pathog 2021;17(3):e1009393.
[Crossref] [Google Scholar] [PubMed]
- Mahjoubin-Tehran M, Rezaei S, Jalili A, Aghaee-Bakhtiari SH, Orafai HM, Jamialahmadi T, et al. Peptide decoys: A new technology offering therapeutic opportunities for breast cancer. Drug Discov Today 2020;25(3):593-8.
[Crossref] [Google Scholar] [PubMed]
- Chevigne A, Janji B, Meyrath M, Reynders N, D’uonnolo G, Uchański T, et al. CXCL10 is an agonist of the CC family chemokine scavenger receptor ACKR2/D6. Cancers 2021;13(5):1054.
[Crossref] [Google Scholar] [PubMed]
- Tersigni C, Maulucci G, Castellani R, Bianchetti G, Onori M, Franco R, et al. Enoxaparin increases D6 receptor expression and restores cytoskeleton organization in trophoblast cells from preeclampsia. Cells 2022;11(13):2036.
[Crossref] [Google Scholar] [PubMed]
- Schwager S, Detmar M. Inflammation and lymphatic function. Front Immunol 2019;10:308.
[Crossref] [Google Scholar] [PubMed]
- Sapula K, Golacki J, Marczak A. The role of chemokines in liver disease. J Edu Health Sport 2022;12(7):493-503.
- Pacheco MO, Rocha FA, Aloia TP, Marti LC. Evaluation of atypical chemokine receptor expression in T cell subsets. Cells 2022;11(24):4099.
[Crossref] [Google Scholar] [PubMed]
- Floerkemeier I, Steinhauer TN, Hedemann N, Weimer JP, Rogmans C, van Mackelenbergh MT, et al. High antitumor activity of the dual topoisomerase inhibitor p8-d6 in breast cancer. Cancers 2021;14(1):2.
[Crossref] [Google Scholar] [PubMed]
- Gowhari Shabgah A, Jadidi-Niaragh F, Mohammadi H, Ebrahimzadeh F, Oveisee M, Jahanara A, et al. The role of Atypical Chemokine Receptor D6 (ACKR2) in physiological and pathological conditions; friend, Foe, or both? Front Immunol 2022;13:861931.
[Crossref] [Google Scholar] [PubMed]
- Zhong Y, Lin Z, Lu J, Lin X, Xu W, Wang N, et al. CCL2-CCL5/CCR4 contributed to radiation-induced epithelial-mesenchymal transition of HPAEpiC cells via the ERK signaling pathways. Am J Transl Res 2019;11(2):733.
[Google Scholar] [PubMed]
- Xu K, Zhang W, Wang C, Hu L, Wang R, Wang C, et al. Integrative analyses of scRNA-seq and scATAC-seq reveal CXCL14 as a key regulator of lymph node metastasis in breast cancer. Hum Mol Genet 2021;30(5):370-80.
[Crossref] [Google Scholar] [PubMed]
 : MDA-MB-435 and
  : MDA-MB-435/D6
 : MDA-MB-435 and
  : MDA-MB-435/D6
 : MDA-MB-435 and
  : MDA-MB-435/D6