- *Corresponding Author:
- M. Devgun
Institute of Pharmaceutical Sciences,
Kurukshetra University,
Kurukshetra,
Haryana 136119,
India
E-mail: manishdevgun@gmail.com
| Date of Received | 02 September 2020 |
| Date of Revision | 24 July 2021 |
| Date of Acceptance | 27 January 2022 |
| Indian J Pharm Sci 2022;84(1):87-98 |
This is an open access article distributed under the terms of the Creative Commons Attribution-NonCommercial-ShareAlike 3.0 License, which allows others to remix, tweak, and build upon the work non-commercially, as long as the author is credited and the new creations are licensed under the identical terms
Abstract
B-cell lymphoma 2-associated athanogene 3 protein is profoundly expressed in various cancer tissues, which can lead to proliferation, migration and invasion of cancer. The raw data for microarray data analysis was obtained from the dataset record GDS2918. The self-organizing map and k-means of the genesis led to the identification of two clusters containing B-cell lymphoma 2-associated athanogene 3 gene among others; cluster number 1 (consisting of 902 genes) from self-organizing map and cluster number 09 (consisting of 348 genes) from k-means. The post clustering tool, SimGene, of Easy M-A was exploited to establish 84 genes with similar expressions as that of B-cell lymphoma 2-associated athanogene 3. The neighbor-joining method in molecular evolutionary genetics analysis version 5 clearly establishes the evolutionary similarity in between B-cell lymphoma 2-associated athanogene 3 and Small glutamine rich tetratricopeptide repeat containing beta. The EasyModeller was utilized for homology modeling of B-cell lymphoma 2-associated athanogene 3 and Small glutamine rich tetratricopeptide repeat containing beta proteins. The protein data bank files were subjected to Procheck in structural analysis and verification server, which evaluates by Ramachandran plot. The selected models were further subjected to loop modeling and validation. Ligands were identified by using DrugBank and were docked against B-cell lymphoma 2-associated athanogene 3 and Small glutamine rich tetratricopeptide repeat containing beta using AutoDock tool. This led to the identification of two compounds, i.e., DB07503 and DB13715 with potential to modulate B-cell lymphoma 2-associated athanogene 3 and aid in the management of various cancers wherein B-cell lymphoma 2-associated athanogene 3 is profoundly overexpressed.
Keywords
B-cell lymphoma 2-associated athanogene 3 proteins, homology modeling, microarray data analysis, molecular docking
Microarray technology is a very crucial technique used by the scientists worldwide in order to analyze the genomic expressions. This high-throughput technique has led to the development of such a colossal amount of genomic data, that it became imperative to use computational methods for data analyses. The differential gene expression is generally used to measure the intensity ratio of the gene expression, which will lead to the recognition of similar set of genes[1-3]. The microarray technique was utilized to establish outcome predictors for patients of advanced-stage follicular lymphoma[2]. The microfluidic devices can be consolidated with microarray tools to produce a more efficient high-throughput assay. This was successfully illustrated in a study where microfluidic analysis of kinases using a peptide array was performed[4]. The genomic information has the potential to revolutionize the current healthcare scenario. The microarray tool has been exploited to reveal the closeness of Cap binding complex dependent Translation Initiation Factor (CTIF) and CUGBP Elav-Like Family member 5 (CELF5) genes with ST8 alpha-N-Acetyl-Neuraminide alpha- 2,8-Sialyltransferase 2 (ST8SIA2) gene concerning schizophrenia[5]. Another study done on Mycobacterium tuberculosis, identified Insulin-Insulin like Growth Factor 2 readthrough (INS-IGF2) and Transition Protein 2 (TNP2) genes as potential targets for its therapy[6].
B-cell lymphoma 2 (Bcl-2)-associated athanogene 3 (BAG3) or BAG cochaperone 3 gene, also known as BIS/MFM6/CAIR-1/BAG3 is located on 10q26.11 chromosome. All BAG proteins interact with the Adenosine Triphosphatase (ATPase) domain of the Heat shock protein-70 (Hsp70) through its BAG domain. BAG3 protein also comprises of WW domain and two motifs[7-10]. The high expression levels of BAG3 in the Pancreatic Ductal Adenocarcinoma (PDAC) in all of the lesions tested makes BAG3 an important target for new drug discovery. The importance of BAG3 in interruption of PDAC progression was demonstrated by its association with Pancreatic Stellate Cells (PSCs) activation[11,12]. The advancement of anticancer agents is assisted by adopting BAG3 as a potential target in the aerobic glycolysis pathway as BAG3 exhibited interaction with Hexokinase 2 (HK2) messenger Ribonucleic Acid (mRNA) in PDAC cells[13]. BAG3 was found to be profoundly expressed in astrocytic tumors and it was specifically very high in glioblastomas. The elevated sensitivity to apoptosis in rat glioblastoma model by down-regulating BAG3 demonstrated BAG3 to be a suitable target for discovery and development of new drugs[14]. BAG3 is overexpressed in colorectal cancer tissues, which can lead to proliferation, migration and invasion of cancer, whereas removal of BAG3 can restrict these processes and also can help in increasing the response of Colorectal carcinoma cell line (HCT-116) cells to 5-Fluorouracil (5-FU). Thus, BAG3 may be recognized as a therapeutic target for colorectal cancer[15]. In Triple-Negative Breast Cancer (TNBC) cell lines which also expressed Epidermal Growth Factor Receptor (EGFR), BAG3 was found to control tumor cell proliferation, migration and invasion. This made BAG3 as an attractive therapeutic target in TNBC[16]. Another study confirmed the overexpression of BAG3 in sebaceous gland carcinoma of the eyelid, the findings implied BAG3 protein to be an appealing target[17].
The homology modeling is one of the computational techniques for establishment of Three Dimensional (3D) structure of proteins. This technique has gained the confidence of the scientists in making the drug discovery path relatively easier and economical[18,19]. In the presence of 3D structure of the proteins, the most commonly used technique in the Structure Based Drug Designing (SBDD) for designing and development of inhibitors is molecular docking. The technique of docking has been extensively used in the drug designing process[20-25].
This work deals with extraction and analysis of BAG3 gene expression data. In order to identify the closely related gene the phylogenetic tree was constructed. The 3D structure of BAG3 and Small Glutamine rich Tetratricopeptide repeat containing Beta (SGTB) proteins was constructed using homology modeling. The technique of docking was utilized to identify the potential BAG3 protein modulators.
Materials and Methods
The computational work was accomplished on a Lenovo ideapad 330S personal computer with Intel (R) Core (TM) i3-8130U central processing unit, operating on Windows 10 Home Premium (64-bit) and possessing 4 GB Random-Access Memory (RAM).
Microarray data analysis:
Data retrieval: The Gene Expression Omnibus (GEO) is a public repository that archives and freely distributes comprehensive sets of microarray, next-generation sequencing and other forms of high-throughput functional genomic data submitted by the scientific community. In addition to data storage, a collection of web-based interfaces and applications are available to help users query and download the studies and gene expression patterns stored in GEO[26]. The dataset record GDS2918 was used to obtain the raw data for microarray data analysis. The title is “Colorectal cancer markers in plasma” and the platform is GPL3014: ResGenHs15_ KDIO having reference series of GSE4988. A total of 9276 gene entries (with names) were considered for this study. The average value, taking sample count to be 20, for each gene was calculated[27].
Easy M-A: The Bio-En-Gene-Ier application incorporates the Easy M-A program. This program contains pre-clustering tools like DelB gene through which out of 15 552 total values, only 9276 genes with names were taken into consideration. The samples with missing values were filled with average values with the help of CpyAvg tool. The BAG3 average value of -0.762 was identified for further procedure. This application employs filter array tool for specifying and selecting 3555 genes on the basis of the range of average value, i.e., from -1.3716 to -0.1524 (-0.762 %±80 %)[28]. The application also utilizes the postclustering tool SimGene, which helps in identification of the common genes from two cluster’s text files with remarkably alike images.
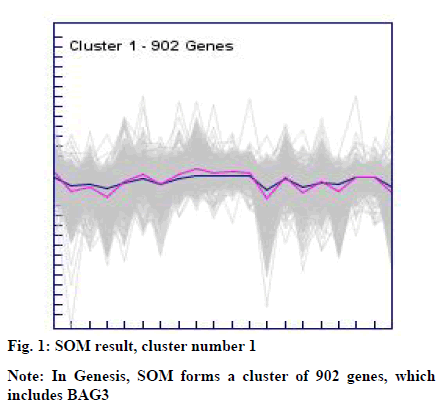
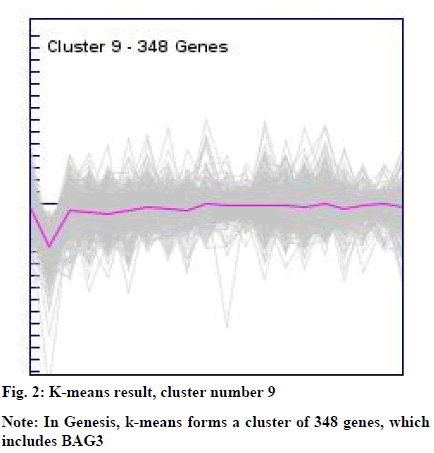
Gene Expression Similarity Investigation Suite (Genesis): Genesis is a platform independent Java package of tools to concurrently visualize and scrutinize a whole set of gene expression experiments[29]. The Self-Organizing Maps (SOM) decrease the immensity of the data and thus helps to disclose the gene expression pattern by obvious display of the data[30]. SOM was used by considering various parameters like, dimensions X and Y: 3; iterations: 2000; alpha: 0.05; radius: 3.0; initialization: random genes; neighborhood: Gaussian and topology to be hexagonal. This led to the establishment of 09 clusters of genes with similar expression. The k-means clustering is designed to partition two-way, two-mode data (i.e., N objects each having measurements on p variables) into k classes[31]. The k-means clustering was used by considering various parameters like number of clusters: 09; maximum iterations: 2000 and runs to be 01. This led to the establishment of 09 clusters of genes with similar expression.
The clusters incorporating BAG3 gene were singled out and applied to the post-clustering tool SimGene.
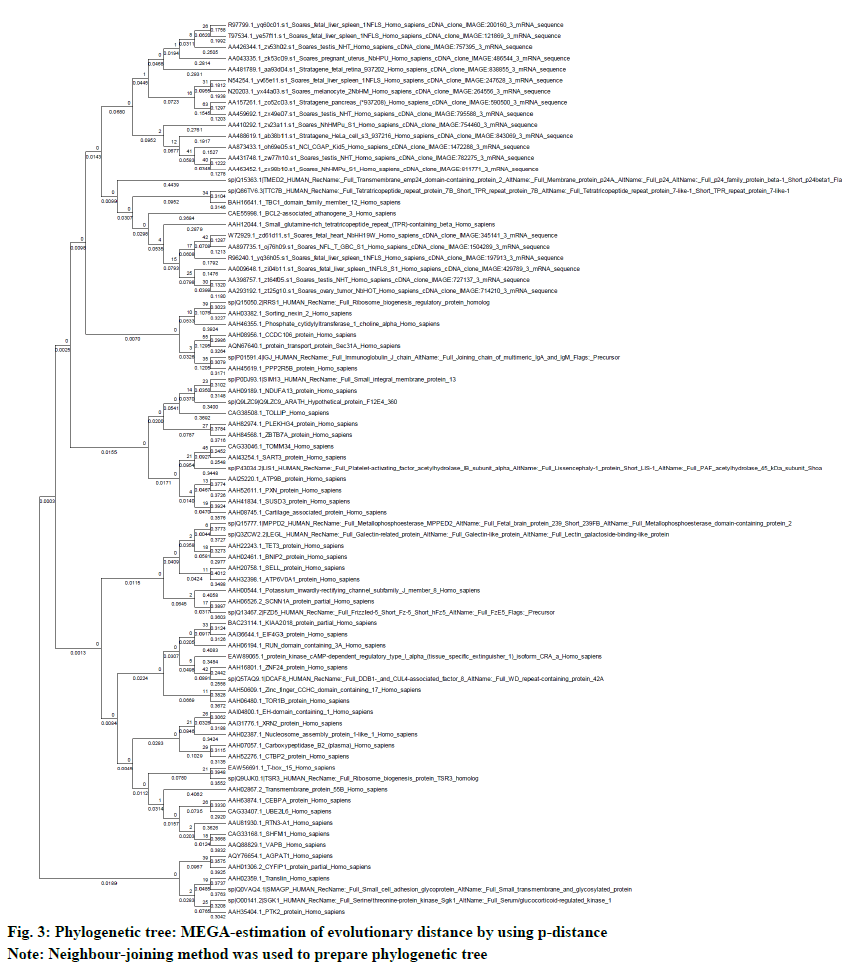
Phylogenetic tree: Phylogenetic and molecular evolutionary analysis were conducted using Molecular Evolutionary Genetics Analysis version 5 (MEGA version 5). It is user friendly software for exploring online databases, constructing sequence alignments and phylogenetic trees[32].
Homology modeling:
BAG3 and SGTB proteins are evolutionary close to each other, thus the structure prediction was performed using comparative modeling.
Fast Alignment (FASTA): The nucleotide sequences or amino acids (protein) sequences, which are expressed in single letter code by FASTA were accessed from the website of National Centre for Biotechnology Information (NCBI)[33].
Basic Local Alignment Search Tool (BLAST): The sequence similarity for proteins can be made more easy by the use of the BLAST tool[34,35]. The Protein Data Bank (PDB) proteins data base was utilized for BLAST-P.
Protein Homology/Analogy Recognition Engine (Phyre): Phyre2, a web based tool for anticipation and interpretation of the protein structure, function and mutations, was utilized[36].
Templates preparation: The BLAST and Phyre data was put to scrutiny using the information from Research Collaboratory for Structural Bioinformatics (RCSB) PDB[37,38]. The resolution (Å), R-value and X-ray diffraction method were employed to approve the templates.
Molecular modeling: EasyModeller was employed for performing homology modeling of BAG3 and SGTB. It is a standalone tool in Windows platform with Modeller and Python preinstalled[39,40]. The Swiss-PDB viewer was utilized for visualization of proteins[41].
Structure prediction: The selected templates were proposed to the EasyModeller. Ten models were designed which were scored on the basis of Discreet Optimized Protein Energy (DOPE), GA341 and Modeller objective function (Molpdf).
Predicted models validation: The predicted models of BAG3 and SGTB proteins were validated by Procheck in Structural Analysis and Verification Server (SAVS) [42].
Loop modeling: The function of the protein is critically dependent on the structure. Any alteration in the structure or sequencing, changes the shape and function of the protein. An accurate structure model of protein is required to interpret the protein-ligand interactions. The loop optimization was performed with the help of ModLoop webserver. The resulting output models were validated by Procheck in SAVS. This continuous process of loop modeling and validation leads to an optimized model[43].
Molecular docking:
The target of molecular docking is to anticipate bound conformations and the binding affinity between a receptor and a ligand. The molecular docking was done against BAG3 and SGTB proteins using AutoDock which is a suite of automated docking tools[44].
Ligand generation: The potential agents which are active against BAG3 and SGTB proteins were searched using various databases like PubMed, DrugBank and ZINC data base. Terracciano et al. identified 2,4-thiazolidinedione scaffold having active role in the inhibition of BAG3-Hsp70 complex, which revealed the usefulness of compound 28, i.e., ethyl[(5E)-5-(3,4- dihydroxybenzylidene)-2,4-dioxo-1,3-thiazolidin-3-yl] acetate, as BAG3 modulator. This compound was taken as the lead compound and the similarity search in the DrugBank was applied to identify various compounds as ligands[45-47]. These compounds were docked to BAG3 and SGTB proteins by using AutoDock tool.
Drug-likeness and molecular property prediction:
The Molsoft LLC was utilized to predict various properties like Blood-Brain Barrier (BBB), number of hydrogen bond acceptor/donor etc. The molecular property predictors were computed by using fragmentbased contributions. The molecules were split into a set of linear or non-linear fragments of different lengths. By this method, various physico-chemical properties were computed and drug-likeness model score was also calculated[48].
Results and Discussion
The clusters resulted from the SOM and k-means were manually explored to identify BAG3 gene. This resulted into cluster number 1 (consisting of 902 genes) from SOM (fig. 1) and cluster number 09 (consisting of 348 genes) from k-means (fig. 2).
The post clustering tool, SimGene of Easy M-A was utilized by subjecting the above two clusters to identify 84 genes which yielded the same expression as that of BAG3 (Table 1).
| S. No. | Genes | S. No. | Genes | S. No. | Genes | S. No. | Genes |
|---|---|---|---|---|---|---|---|
| 1 | TOLLIP | 22 | SHFM1 | 43 | SUSD3 | 64 | TOMM34 |
| 2 | KIAA2018 | 23 | TET3 | 44 | TBC1D12 | 65 | VAPB |
| 3 | R97799 | 24 | TMED2 | 45 | XRN2 | 66 | AA009648 |
| 4 | TBX15 | 25 | TOR1B | 46 | BNIP2 | 67 | AA398757 |
| 5 | TSN | 26 | TSR3 | 47 | CEBPA | 68 | ATP6V0A1 |
| 6 | TTC7B | 27 | ZNF24 | 48 | CTBP2 | 69 | DCAF8 |
| 7 | W72929 | 28 | AA157261 | 49 | CYFIP1 | 70 | T97534 |
| 8 | ZCCHC17 | 29 | AA410292 | 50 | LGALSL | 71 | ZBTB7A |
| 9 | AA897735 | 30 | AA431748 | 51 | N20203 | 72 | AA293192 |
| 10 | AGPAT1 | 31 | CCDC106 | 52 | PPP2R5B | 73 | AA463452 |
| 11 | ATP9B | 32 | EHD1 | 53 | R96240 | 74 | AA481789 |
| 12 | CPB2 | 33 | EIF4G3 | 54 | SNX2 | 75 | AA873433 |
| 13 | MPPED2 | 34 | IGJ | 55 | TMEM55B | 76 | PTK2 |
| 14 | N54254 | 35 | KCNJ8 | 56 | UBE2L6 | 77 | SEC31A |
| 15 | NAP1L1 | 36 | LOC100506272 | 57 | AA043335 | 78 | T48384 |
| 16 | PCYT1A | 37 | LOC91450 | 58 | AA426344 | 79 | AA459692 |
| 17 | PRKAR1A | 38 | MACROD2-AS1 | 59 | AA488619 | 80 | SART3 |
| 18 | PXN | 39 | PAFAH1B1 | 60 | BAG3 | 81 | SMAGP |
| 19 | RTN3 | 40 | RRS1 | 61 | CRTAP | 82 | SMIM13 |
| 20 | RUNDC3A | 41 | SCNN1A | 62 | PLEKHG4 | 83 | FZD5 |
| 21 | SGTB | 42 | SGK1 | 63 | SELL | 84 | NDUFA13 |
Note: The expressions of all these genes are similar to BAG3
Table 1: Common Genes Found Using Simgene
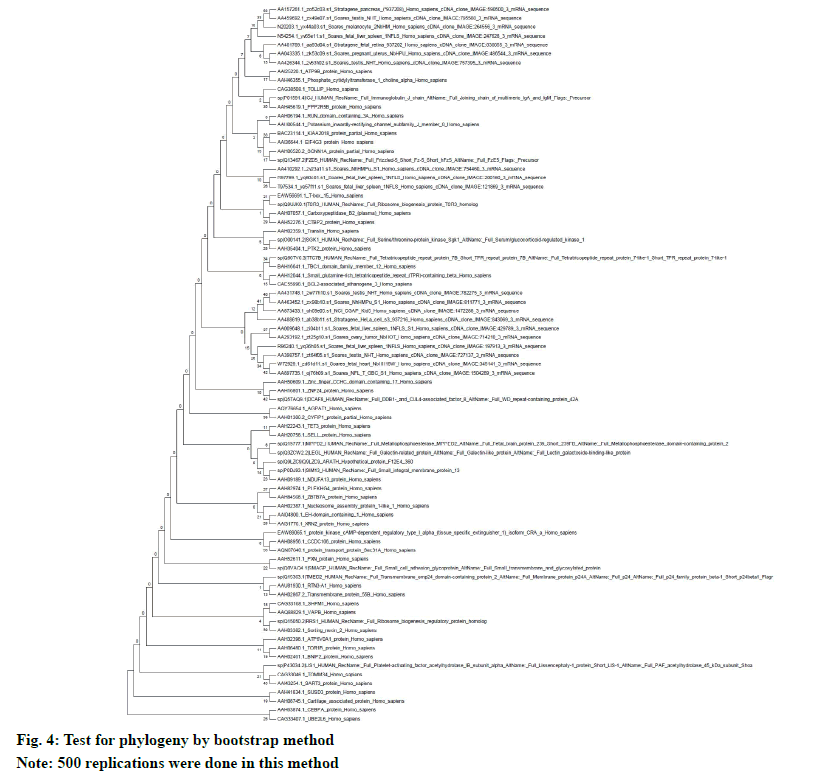
The neighbor-joining method in MEGA5 was used to determine the evolutionary history. The multiple sequence alignment was done by using ClustalW. The evolutionary distances (number of amino acid differences per site) were calculated by using the p-distance method. The evolutionary similarity in between BAG3 (branch length: 0.3684) and SGTB (branch length: 0.2879) is very evident (fig. 3). The test for phylogeny was conducted by using bootstrap method with 500 replications (fig. 4).
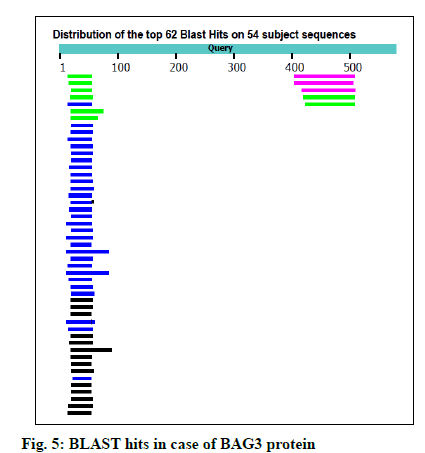
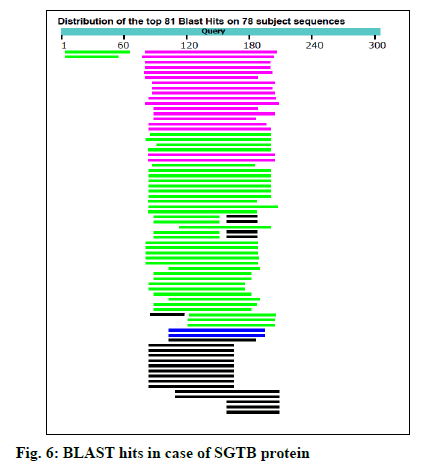
The FASTA sequences of BAG3 (575 amino acid protein) and SGTB (304 amino acids protein) were obtained from NCBI. The GenBank number of BAG3 and SGTB proteins was found to be CAE55998.1 and AAH12044.1 respectively. The BLAST was performed for both the proteins using NCBI; 62 and 81 BLAST hits were recorded for BAG3 (fig. 5) and SGTB (fig. 6) respectively. The Phyre was also utilized for protein structure prediction. The combined data of both BLAST and Phyre was subjected to RCSB PDB analysis. The results obtained were arranged in a sequence of decreasing percentage Identifier (ID) and increasing resolution (Table 2). The six templates (3a8y, 3l4h, 3olm, 4n7f, 5xmc and 6j1x) in case of BAG3 and six templates (2vyi, 4cgv, 5jjt, 5lyn, 5lyp and 6hpg) in case of SGTB were selected on the basis of their chains, percentage ID, resolution (≤3 Å) and the R-value (≤0.5). These templates were subjected to EasyModeller for designing of protein models. This program also calculates certain parameters like Molpdf, DOPE (for a good model these should be minimum) and GA341 (for a good model value lies between 0-1). Validation of all the ten models of BAG3 and SGTB was accomplished by subjecting the PDB files to Procheck in SAVS, which evaluates by the Ramachandran plot. Taking Ramachandran plot and other modeling parameters into consideration, the model number 4 of BAG3 and model number 4 of SGTB were selected on the basis of maximum percentage of residues in Most Favoured Regions (MFR) and minimum percentage of residue in Disallowed Regions (DR) (Table 3).
| BAG3 | SGTB | ||||||||
|---|---|---|---|---|---|---|---|---|---|
| S. No | Template/Accession No | ID % | Resolution (?) | R-Value (Free/Work) | S. No | Template/Accession No | ID % | Resolution (?) |
R-Value (Free/Work) |
| 1 | 3l4h | 68 | 1.80 | 0.200/0.150 | 1 | 2vyi | 67 | 2.40 | 0.249/0.187 |
| 2 | 4n7f | 60 | 1.10 | 0.200/0.181 | 2 | 5lyp | 44 | 1.55 | 0.281/0.194 |
| 3 | 6j1x | 55 | 2.30 | 0.271/0.220 | 3 | 5lyn | 44 | 2.00 | 0.203/0.158 |
| 4 | 5xmc | 48 | 2.60 | 0.262/0.213 | 4 | 5jjt | 44 | 2.10 | 0.231/0.186 |
| 5 | 3a8y | 44 | 2.30 | 0.281/0.218 | 5 | 6hpg | 43 | 2.00 | 0.265/0.182 |
| 6 | 3olm | 44 | 2.50 | 0.272/0.220 | 6 | 4cgv | 43 | 2.54 | 0.267/0.240 |
Table 2: Templates Using Blast, Phyre and RCSB PDB
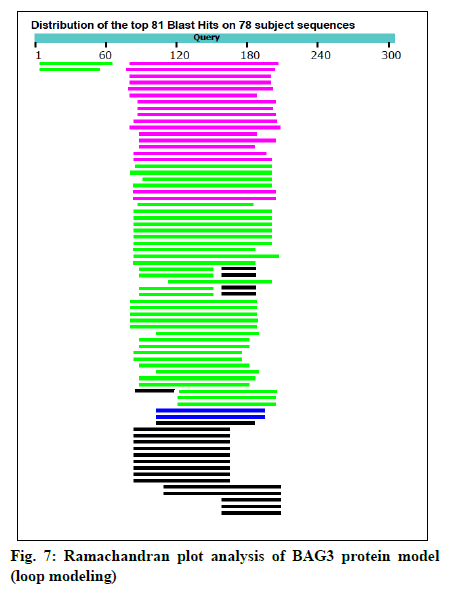
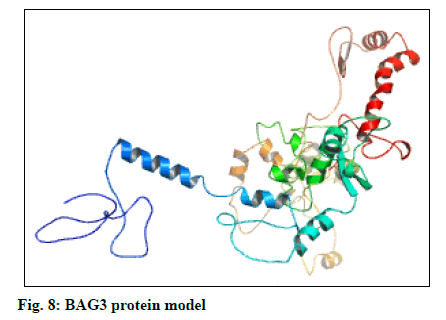
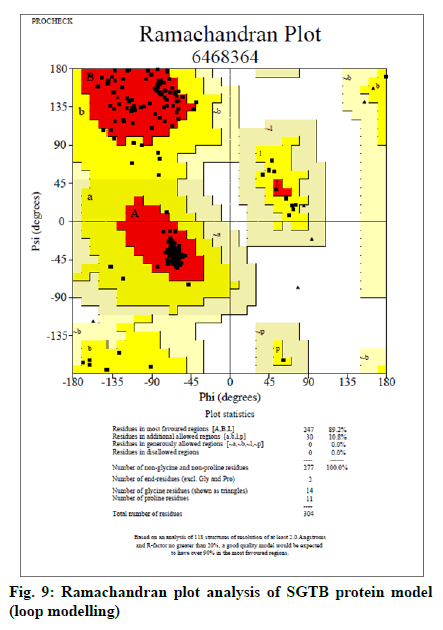
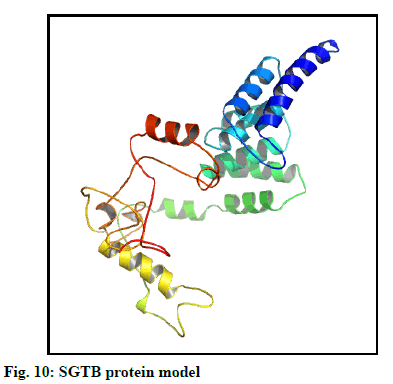
The selected models of BAG3 (No. 4) and that of SGTB (No. 4) were made more explicit by loop modeling (ModLoop) and the resulting models were evaluated by Ramachandran plot through SAVS (Procheck). The BAG3 protein model loop (fig. 7 and fig. 8) having maximum percentage (87.8 %) of residues in most favoured region with no residues in generously allowed as well as DR was chosen for BAG3. And the SGTB protein model loop (fig. 9 and fig. 10) having maximum percentage (89.2 %) of residues in most favoured region with no residues in generously allowed as well as DR was preferred for SGTB.
| Model number | Proteins | Molpdf | DOPE | GA341 | Validation by Procheck in SAVS | |||
|---|---|---|---|---|---|---|---|---|
| Residues in MFR (Number/%) | Residues in additional allowed regions (Number/%) | Residues in generously allowed regions (Number/%) | Residues in DR (Number/%) | |||||
| 1 | BAG3 | 25626.64 | -30061.77 | 0.00197 | 354/78.7 | 67/14.9 | 16/3.6 | 13/2.9 |
| SGTB | 6375.45 | -20141.24 | 0.04498 | 237/85.6 | 29/10.5 | 10/3.6 | 1/0.4 | |
| 2 | BAG3 | 25578.09 | -29989.90 | 0.00413 | 345/76.7 | 75/16.7 | 12/2.7 | 18/4.0 |
| SGTB | 6346.62 | -20351.17 | 0.03510 | 232/83.8 | 29/10.5 | 10/3.6 | 6/2.2 | |
| 3 | BAG3 | 25586.98 | -29478.02 | 0.00385 | 363/80.7 | 58/12.9 | 17/3.8 | 12/2.7 |
| SGTB | 6803.38 | -19702.02 | 0.02530 | 225/81.2 | 41/14.8 | 8/2.9 | 3/1.1 | |
| 4 | BAG3 | 25611.85 | -28068.56 | 0.00135 | 360/80.0 | 66/14.7 | 17/3.8 | 7/1.6 |
| SGTB | 6306.62 | -20180.30 | 0.03630 | 246/88.8 | 25/9.0 | 6/2.2 | 0/0.0 | |
| 5 | BAG3 | 25716.79 | -28870.85 | 0.00148 | 349/77.6 | 79/17.6 | 15/3.3 | 7/1.6 |
| SGTB | 6868.71 | -20371.39 | 0.03459 | 233/84.1 | 33/11.9 | 7/2.5 | 4/1.4 | |
| 6 | BAG3 | 26043.07 | -28459.76 | 0.00068 | 357/79.3 | 64/14.2 | 14/3.1 | 15/3.3 |
| SGTB | 6420.31 | -20096.76 | 0.02767 | 235/84.8 | 35/12.6 | 3/1.1 | 4/1.4 | |
| 7 | BAG3 | 25066.45 | -29418.10 | 0.00136 | 356/79.1 | 75/16.7 | 11/2.4 | 8/1.8 |
| SGTB | 6422.84 | -20186.76 | 0.04144 | 239/86.3 | 32/11.6 | 5/1.8 | 1/0.4 | |
| 8 | BAG3 | 25746.54 | -28587.39 | 0.00065 | 341/75.8 | 77/17.1 | 21/4.7 | 11/2.4 |
| SGTB | 6450.25 | -19749.24 | 0.04257 | 235/84.8 | 31/11.2 | 8/2.9 | 3/1.1 | |
| 9 | BAG3 | 25584.46 | -29646.09 | 0.00245 | 358/79.6 | 62/13.8 | 19/4.2 | 11/2.4 |
| SGTB | 6717.49 | -20158.43 | 0.02330 | 233/84.1 | 33/11.9 | 6/2.2 | 5/1.8 | |
| 10 | BAG3 | 26115.22 | -30095.29 | 0.00208 | 356/79.1 | 62/13.8 | 18/4.0 | 14/3.1 |
| SGTB | 6489.47 | -20312.27 | 0.04028 | 243/87.7 | 23/8.3 | 8/2.9 | 3/1.1 | |
Note: Model selection was done on the basis of maximum percentage of residues in MFR and minimum percentage of residue in DR
Table 3: Protein Model Parameters and Ramachandran Plot Analysis of The Ten Possible Models of BAG3 and SGTB Proteins
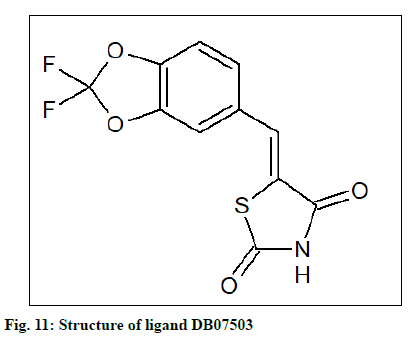
The PDB file (named as ligand 1) of the compound, ethyl[(5E)-5-(3,4-dihydroxybenzylidene)-2,4-dioxo- 1,3-thiazolidin-3-yl]acetate, identified by Terracciano et al. as BAG3 modulator was created using first ChemSketch and then converted by using Open Babel. This compound was subjected to the similarity search in DrugBank and the similarity threshold was 0.5; minimum weight being 100 and maximum weight 1000 yielded 08 similar compounds ((5E)-5-[(2,2-difluoro- 1,3-benzodioxol-5-yl)methylene]-1,3-thiazolidine-2,4- dione (DB07503), DB04769, DB11962, DB15293, DB07531, DB13342, DB08177 and DB07838). These 08 compounds were subjected to similarity search in DrugBank using the same criteria which resulted in 40 similar compounds. These were used for docking with BAG3 and SGTB protein models using Autodock tool. The number of points in the x-dimension was 112, whereas that in y and z-dimension was 118 and 102 respectively. The center grid box was at x center: 39.143; y center: 51.543; z center: 24.231 along with the spacing (angstrom) at 1 in the case of BAG3 and for SGTB the number of points in the x, y, z dimensions were established at 84, 64 and 54 respectively and the center grid box was at x center: -2.555; y center: -0.926; z center: 6.69, along with spacing (angstrom) at 1.
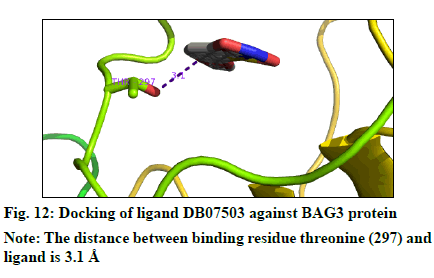
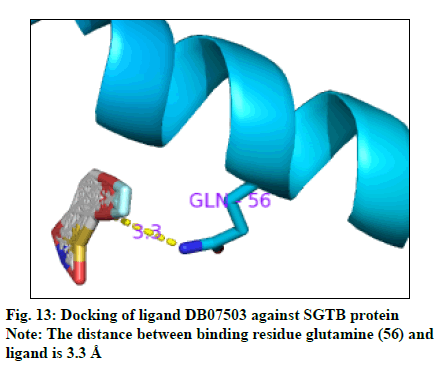
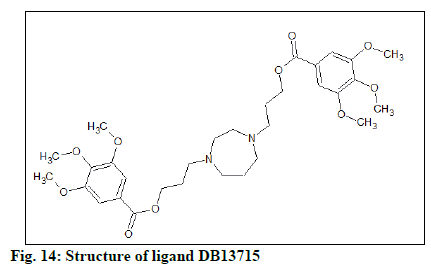
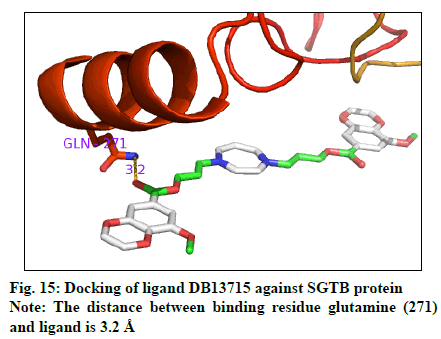
The docking result (Table 4) demonstrates the higher affinity of ligand DB07503 (fig. 11) with both BAG3 (fig. 12) and SGTB (fig. 13) proteins as compared to the ligand 1. The docking result of ligand Dilazep (DB13715) (fig. 14) against SGTB (fig. 15) is also significant. The distance between the residues and the ligands is less than 3.4 Å in all the three cases. The ligand DB07503 interacts with residue Threonine 297 of BAG3 protein and also with residue Glutamine 56 of SGTB protein. The ligand DB13715 interacts with the residue Glutamine 271 of SGTB protein. The ligands DB07503 and DB13715 in silico docking results are promising and these can further be exploited to yield potential BAG3 modulators.
| S. No. | Ligands | Docking affinity (Kcal/mol) | S. No. | Ligands | Docking affinity (Kcal/mol) | ||
|---|---|---|---|---|---|---|---|
| DrugBank codes | BAG3 | SGTB | DrugBank codes | BAG3 | SGTB | ||
| 1 | Ligand 1 | -9.2 | -7.4 | 21 | DB08587 | -7.9 | -5.8 |
| 2 | DB00494 | -8.3 | -7.1 | 22 | DB08706 | -10.2 | -8.3 |
| 3 | DB01880 | -7.1 | -5.2 | 23 | DB08710 | -9.7 | -8.2 |
| 4 | DB04449 | -7.7 | -5.5 | 24 | DB08753 | -10.3 | -8.6 |
| 5 | DB04769 | -8.5 | -6.5 | 25 | DB08754 | -7.6 | -7.4 |
| 6 | DB06998 | -7.2 | -7.5 | 26 | DB11285 | -7.9 | -7.3 |
| 7 | DB07109 | -7.9 | -5.6 | 27 | DB11962 | -9.6 | -7.8 |
| 8 | DB07503 | -13.0 | -9.9 | 28 | DB12016 | -10.6 | -9.4 |
| 9 | DB07529 | -7.7 | -5.5 | 29 | DB12123 | -9.3 | -8.1 |
| 10 | DB07531 | -7.4 | -8.0 | 30 | DB12312 | -8.8 | -7.8 |
| 11 | DB07533 | -9.9 | -8.0 | 31 | DB12582 | -7.8 | -7.2 |
| 12 | DB07534 | -8.2 | -7.1 | 32 | DB13265 | -10.4 | -9.6 |
| 13 | DB07538 | -10.0 | -8.3 | 33 | DB13297 | -8.1 | -5.8 |
| 14 | DB07539 | -9.4 | -7.4 | 34 | DB13352 | -7.4 | -7.9 |
| 15 | DB07540 | -8.3 | -7.7 | 35 | DB13715 | -9.7 | -9.8 |
| 16 | DB07615 | -9.1 | -7.8 | 36 | DB13790 | -9.8 | -8.4 |
| 17 | DB07767 | -7.2 | -5.3 | 37 | DB14188 | -7.4 | -5.5 |
| 18 | DB07838 | -10.7 | -8.0 | 38 | DB14680 | -9.6 | -7.9 |
| 19 | DB08177 | -10.7 | -8.2 | 39 | DB15293 | -9.7 | -7.3 |
| 20 | DB08481 | -10.6 | -8.1 | 40 | DB15467 | -8.5 | -6.6 |
Table 4: Docking of Ligands Against Bag3 and SGTB Proteins Using Autodock 4
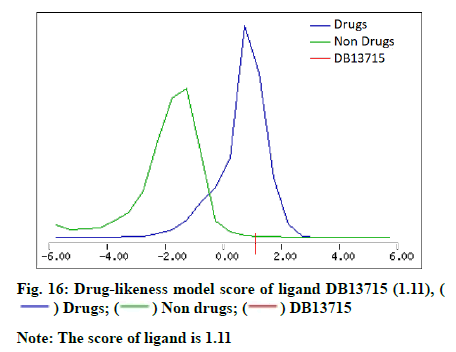
The molecular properties and drug-likeness was predicted by utilizing Molsoft LLC (Table 5). A favourable drug-likeness model score was computed for the ligand DB13715 (fig. 16).
| S. No | Properties | Ligands | ||
|---|---|---|---|---|
| Ligand 1 | DB07503 | DB13715 | ||
| 1 | Molecular formula | C14H13NO6S | C11H5F2NO4S | C31H44N2O10 |
| 2 | Molecular weight | 323.05 | 284.99 | 604.3 |
| 3 | Number of H-bond acceptor | 7 | 5 | 12 |
| 4 | Number of H-bond donor | 2 | 1 | 0 |
| 5 | MolLogP | 1.51 | 2.52 | 3.82 |
| 6 | MolLogS | -2.03 (in log(moles/l)), 2999.82 (in mg/l) | -3.11 (in log(moles/l)), 219.70 (in mg/l) | -3.88 (in log(moles/l)), 78.90 (in mg/l) |
| 7 | MolPSA | 83.12 A2 | 51.26 A2 | 95.85 A2 |
| 8 | MolVol | 322.49 A3 | 257.00 A3 | 642.69 A3 |
| 9 | pKa of most basic/acidic group | -0.830769231 | -0.72815534 | 7.95/26.54 |
| 10 | BBB score | 2.64 | 3.1 | 2.35 |
| 11 | Drug-likeness model score | -0.41 | -1.23 | 1.11 |
Note: LogP is octanol/water partition coefficient; LogS is water solubility; MolPSA is Molecular Polar Surface Area; MolVol is Molecular Volume; BBB score is Blood-Brain Barrier Score, a score of 6 is high and a score of 0 is low; pKa is acid dissociation constant
Table 5: Molecular Properties and Drug-Likeness
The study suggests that the compounds, ligand 1, DB07503 and DB13715 have potential and thus necessitates further research in the development of novel BAG3 modulators for the effective treatment of various types of BAG3 over expressed cancers.
Acknowledgements:
The author acknowledges the technical support of Mr. Ankur Mohan, M.D., Bio-EGICORE, Lucknow.
Conflict of interests:
The authors declared no conflict of interest.
References
- Aittokallio T, Kurki M, Nevalainen O, Nikula T, West A, Lahesmaa R. Computational strategies for analyzing data in gene expression microarray experiments. J Bioinform Comput Biol 2003;1(3):541-86.
- Korenberg MJ. Microarray data analysis: Methods and applications. New Jersey, Totowa: Humana Press; 2007.
- Valafar F. Pattern recognition techniques in microarray data analysis: A survey. Ann N Y Acad Sci 2002;980(1):41-64.
[Crossref] [Google Scholar] [Pubmed]
- Su J, Bringer MR, Ismagilov RF, Mrksich M. Combining microfluidic networks and peptide arrays for multi-enzyme assays. J Am Chem Soc 2005;127(20):7280-1.
[Crossref] [Google Scholar] [Pubmed]
- Kumari A, Mohan A, Gangwar P. In silico microarray data analysis of ST8SIA2 gene responsible for schizophrenia. Int J Biol Pharm Allied Sci 2015;4(3):1678-85.
- Rastogi A, Gangwar P, Mohan A, Kumar S, Malakar A. Gene expression analysis of microarrays for tuberculosis drugs. Online J Bioinform 2018;19(3):271-80.
- National Center for Biotechnology Information. BAG3 BAG cochaperone 3 [Homo sapiens (human)]. Bethesda (MD): National Library of Medicine (US); 2020.
- Chiappetta G, Basile A, Arra C, Califano D, Pasquinelli R, Barbieri A, et al. BAG3 down-modulation reduces anaplastic thyroid tumor growth by enhancing proteasome-mediated degradation of BRAF protein. J Clin Endocrinol Metab 2012;97(1):E115-20.
- Chiappetta G, Basile A, Barbieri A, Falco A, Rosati A, Festa M, et al. The anti-apoptotic BAG3 protein is expressed in lung carcinomas and regulates small cell lung carcinoma (SCLC) tumor growth. Oncotarget 2014;5(16):6846-53.
[Crossref] [Google Scholar] [Pubmed]
- Shi H, Chen W, Dong Y, Lu X, Zhang W, Wang L. BAG3 promotes chondrosarcoma progression by upregulating the expression of β-catenin. Mol Med Rep 2018;17(4):5754-63.
[Crossref] [Google Scholar] [Pubmed]
- Rosati A, Bersani S, Tavano F, Dalla Pozza E, De Marco M, Palmieri M, et al. Expression of the antiapoptotic protein BAG3 is a feature of pancreatic adenocarcinoma and its overexpression is associated with poorer survival. Am J Pathol 2012;181(5):1524-9.
[Crossref] [Google Scholar] [Pubmed]
- Li C, An MX, Jiang JY, Yao HB, Li S, Yan J, et al. BAG3 suppresses loading of Ago2 to IL6 mRNA in pancreatic ductal adenocarcinoma. Front Oncol 2019;9:225.
[Crossref] [Google Scholar] [Pubmed]
- An MX, Li S, Yao HB, Li C, Wang JM, Sun J, et al. BAG3 directly stabilizes hexokinase 2 mRNA and promotes aerobic glycolysis in pancreatic cancer cells. J Cell Biol 2017;216(12):4091-105.
[Crossref] [Google Scholar] [Pubmed]
- Festa M, Del Valle L, Khalili K, Franco R, Scognamiglio G, Graziano V, et al. BAG3 protein is overexpressed in human glioblastoma and is a potential target for therapy. Am J Pathol 2011;178(6):2504-12.
[Crossref] [Google Scholar] [Pubmed]
- Li N, Chen M, Cao Y, Li H, Zhao J, Zhai Z, et al. Bcl-2-associated athanogene 3 (BAG3) is associated with tumor cell proliferation, migration, invasion and chemoresistance in colorectal cancer. BMC Cancer 2018;18(1):1-5.
[Crossref] [Google Scholar] [Pubmed]
- Shields S, Conroy E, O’Grady T, McGoldrick A, Connor K, Ward MP, et al. BAG3 promotes tumour cell proliferation by regulating EGFR signal transduction pathways in triple negative breast cancer. Oncotarget 2018;9(21):15673-90.
[Crossref] [Google Scholar] [Pubmed]
- Yunoki T, Tabuchi Y, Hayashi A. Expression of anti-apoptotic protein BAG3 in human sebaceous gland carcinoma of the eyelid. Anticancer Res 2017;37(4):1931-4. [Crossref]
- Vyas VK, Ukawala RD, Ghate M, Chintha C. Homology modeling a fast tool for drug discovery: Current perspectives. Indian J Pharm Sci 2012;74(1):1-17.
[Crossref] [Google Scholar] [Pubmed]
- Muhammed MT, Aki?Yalcin E. Homology modeling in drug discovery: Overview, current applications and future perspectives. Chem Biol Drug Des 2019;93(1):12-20.
[Crossref] [Google Scholar] [Pubmed]
- De Ruyck J, Brysbaert G, Blossey R, Lensink MF. Molecular docking as a popular tool in drug design, an in silico travel. Adv Appl Bioinform Chem 2016;9:1-11.
[Crossref] [Google Scholar] [Pubmed]
- Devgan M, Karar PK, Agarwal G, Mohan A, Gangwar P. In silico designing of drugs for the inhibition of AMF-HER2 complex in trastuzumab resistant breast cancer. Indian J Biotechnol 2016;15(3):292-8. [Crossref]
- Devgan M. Structure prediction and in silico designing of drugs for the inhibition of EphA10 tyrosine kinase receptor protein. Acta Bio Sci 2016;3(2):86-94.
- Devgan M. Structure prediction and in silico designing of drugs against fork head-box R2 protein. Res J Pharm Technol 2018;11(3):913-20.
- Devgan M. Structure prediction and in silico designing of drugs against homeobox C8 protein. J Chem Pharm Res 2016;8(3):891-99. [Crossref] [Google Scholar] [Pubmed]
- Devgan M. Structure prediction and in silico designing of drugs against kallikrein protein. Int J Curr Pharm Res 2017:64-9.
- National Center for Biotechnology Information. GEO Gene expression omnibus. Bethesda (MD): National Library of Medicine (US); 2020.
- National Center for Biotechnology Information. Colorectal cancer markers in plasma. Bethesda (MD): National Library of Medicine (US); 2020.
- Gangwar P, Kumar S, Mohan A. In silico microarray data analysis of over-expressed LYN gene responsible for adult T-cell leukemia/lymphoma (ATL). Int J Pharm Tech Res 2012;4(4):1432-8. [Crossref]
- Sturn A, Quackenbush J, Trajanoski Z. Genesis: Cluster analysis of microarray data. Bioinformatics 2002;18(1):207-8.
[Crossref] [Google Scholar] [Pubmed]
- Wang J, Delabie J, Aasheim HC, Smeland E, Myklebost O. Clustering of the SOM easily reveals distinct gene expression patterns: Results of a reanalysis of lymphoma study. BMC Bioinformatics 2002;3(1):1-9.
[Crossref] [Google Scholar] [Pubmed]
- Steinley D. K-means clustering: A half-century synthesis. Br J Math Stat Psychol 2006;59(1):1-34.
- Tamura K, Peterson D, Peterson N, Stecher G, Nei M, Kumar S. MEGA5: Molecular evolutionary genetics analysis using maximum likelihood, evolutionary distance and maximum parsimony methods. Mol Biol Evol 2011;28(10):2731-9.
[Crossref] [Google Scholar] [Pubmed]
- National Center for Biotechnology Information. BCL2-associated athanogene 3 [Homo sapiens]. Bethesda (MD): National Library of Medicine (US); 2020.
- Altschul SF, Gish W, Miller W, Myers EW, Lipman DJ. Basic local alignment search tool. J Mol Biol 1990;215(3):403-10.
[Crossref] [Google Scholar] [Pubmed]
- Altschul SF, Madden TL, Schäffer AA, Zhang J, Zhang Z, Miller W, et al. Gapped BLAST and PSI-BLAST: A new generation of protein database search programs. Nucleic Acids Res 1997;25(17):3389-402.
- Kelley LA, Mezulis S, Yates CM, Wass MN, Sternberg MJ. The Phyre2 web portal for protein modeling, prediction and analysis. Nat Protoc 2015;10(6):845-58.
- Goodsell DS, Zardecki C, Di Costanzo L, Duarte JM, Hudson BP, Persikova I, et al. RCSB Protein Data Bank: Enabling biomedical research and drug discovery. Protein Sci 2020;29(1):52-65.
[Crossref] [Google Scholar] [Pubmed]
- Research collaboratory for structural bioinformatics. RCSB Protein Data Bank. New Jersey, California: Rutgers, UCSanDiego (US); 2020.
- Kuntal BK, Aparoy P, Reddanna P. EasyModeller: A graphical interface to modeller. BMC Res Notes 2010;3(1):1-5.
[Crossref] [Google Scholar] [Pubmed]
- Kuntal BK. EasyModeller (Version 2.0). Bioinformatikz; 2020.
- Guex N, Peitsch MC. SWISS-MODEL and the Swiss-Pdb Viewer: An environment for comparative protein modeling. Electrophoresis 1997;18(15):2714-23.
[Crossref] [Google Scholar] [Pubmed]
- NIH MBI laboratory for structural genomics and proteomics. Structural analysis and verification server (Version 5). UCLA MBI-SAVES web server; 2020.
- Fiser A. ModLoop: Modeling of loops in protein structures. ModLoop-ModBase 2020.
- Trott O, Olson AJ. AutoDock Vina: Improving the speed and accuracy of docking with a new scoring function, efficient optimization and multithreading. J Comput Chem 2010;31(2):455-61.
[Crossref] [Google Scholar] [Pubmed]
- Terracciano S, Lauro G, Russo A, Vaccaro MC, Vassallo A, De Marco M, et al. Discovery and synthesis of the first selective BAG domain modulator of BAG3 as an attractive candidate for the development of a new class of chemotherapeutics. Chem Commun 2018;54(55):7613-6.
- Wishart DS, Feunang YD, Guo AC, Lo EJ, Marcu A, Grant JR, et al. DrugBank 5.0: A major update to the DrugBank database for 2018. Nucleic Acids Res 2018;46(D1):D1074-82.
- Wishart DS. DrugBank. Canada: Canadian Institutes of Health Research, Alberta Innovates-Health Solutions, The Metabolomics Innovation Centre; 2020.
- Drug-likeness and molecular property prediction web server. Molsoft molecules in silico; 2020.
 ) Drugs; (
 ) Non drugs; (
 ) DB13715