- *Corresponding Author:
- Meenakshi Bhatia
Department of Pharmaceutical Sciences
Guru Jambheshwar University of Science and Technology
Hisar 125001, India
E-mail: meenaxibhatia@gmail.com
| Date of Received | 16 June 2020 |
| Date of Revision | 03 August 2021 |
| Date of Acceptance | 11 February 2022 |
| Indian J Pharm Sci 2022;84(1):162-172 |
This is an open access article distributed under the terms of the Creative Commons Attribution-NonCommercial-ShareAlike 3.0 License, which allows others to remix, tweak, and build upon the work non-commercially, as long as the author is credited and the new creations are licensed under the identical terms
Abstract
The present research work is designed to formulate, optimize and evaluate the ketoconazole loaded nanostructured lipid carriers for the topical delivery. Ketoconazole loaded nanostructured lipid carriers were prepared by one pot single-step microwave assisted technique using Compritol® 888 ATO, Labrafac PG and soya lecithin employing 2-factors 3-level experimental design. The p-size of the optimized batch of microwave assisted ketoconazole loaded nanostructured lipid carriers was found to be 60.15 nm. The in vitro drug release in 24 h study showed the biphasic release pattern, initial burst release for 5 h followed by slower release upto 24 h. Furthermore, ex vivo skin permeation study revealed that 3670.99 μg/cm2 and 4644.78 μg/cm2 of drug permeated from ketoconazole loaded nanostructured lipid carriers hydrogel and marketed formulation with the flux rate of 305.91 μg/cm2/h and 387.06 μg/cm2/h, respectively at the end of 24 h. Confocal laser scanning microscope images demonstrated appreciable cell uptake of 5(6)-Carboxyfluorescein loaded nanostructured lipid carriers hydrogel compared to 5(6)-Carboxyfluorescein-loaded plain hydrogel. Optimized batch of nanostructured lipid carrier formulation produced by microwave assisted technique produced particles in nm range with narrow polydispersity index and high entrapment efficiency. X-ray study confirmed that the crystalline nature of ketoconazole changed to amorphous form in the process of nanostructured lipid carrier formulation and thermal behavior analyzed by differential scanning calorimetry confirmed inclusion of drug into lipid matrix in its amorphous form. After performing the optimization and evaluations of nanostructured lipid carriers it can be concluded that nanostructured lipid carriers bear the potential to be explored further for the topical and other pharmaceutical applications.
Keywords
Nanostructured lipid carriers, ketoconazole, microwave, ex vivo permeation, confocal laser scanning microscopy
Development of colloidal carrier system like oleo gels, w/o or o/w creams, Solid Lipid Nanoparticles (SLNs) and more recently Nanostructured Lipid Carriers (NLCs) has been the most popular technique for the delivery of drugs via skin. NLCs are potential delivery systems in which partially-crystallized lipid particles with mean radii ≤100 nm are dispersed in an aqueous phase containing emulsifier(s)[1-4]. NLCs have been developed to deluge the shortcomings associated with SLNs which were earlier proposed as an alternate carrier to emulsions, liposomes and polymeric nanoparticles. Advantages of NLCs can be enumerated as better physical stability, ease of preparation scale- up, increased dispersibility in an aqueous medium, high entrapment of lipophilic drug, hydrophilic drugs, controlled particle size, an advanced efficient carrier system in particular for lipophilic substances, increase of skin occlusion, extended release of the drug, improve benefit/risk ratio, increase of skin hydration and elasticity[5-10]. Although several research reports on lipid nanoparticles prepared by different methods have already been published including phase inversion temperature method to encapsulate beta (β)-carotene and alpha (α)-tocopherol in NLCs of murumuru butter, curcumin loaded NLCs using hot emulsification process followed by probe sonication method, red ginger NLCs by high shear homogenization, methotrexate loaded NLCs by high shear homogenization, clotrimazole loaded SLNs/NLCs by emulsification ultrasonication and NLCs loaded with minoxidil were prepared by melt dispersion ultrasonication method and Ketoconazole (KTZ) NLCs for transdermal application were prepared using melt dispersion ultra-sonication method etc.,[11-17]. The physicochemical stability of SLNs and NLCs of KTZ using Compritol® 888 ATO and α-tocopherol has been reported[18] and also the antifungal activity of KTZ loaded chitosan-gellan gum nanocomplexes has been shown to be enhanced[19]. However, these methods remain with particular drawbacks such as high energy inputs, inefficient thermal heating and the risk of metal contamination[20]. These shortcomings lead to further investigations to improve more. In recent studies, microwave energy is used to replace the involvement of thermal heat in producing NLCs which highlighted several advantages[21,22]. Synthetic approaches utilizing microwave include producing silver nanostructures[23], trilaurin, trimyristin, or miglyol 812 as nanoparticle lipid core[24] and Hibiscus sabdariffa lipid nanoparticles[25] etc. The replacement of the thermal heating process by a temperature-controlled microwave heating process produced NLCs with smaller particle sizes, narrow polydispersity, higher encapsulation efficiency and loading capacity and increased physical stability[21].
KTZ is an imidazole compound belonging to Biopharmaceutical Classification System (BCS)-II category, possesses wide spectrum antifungal activity that is used to cure systemic and superficial fungal infections and may be administered orally and topically[26]. Local application is generally preferred as it eliminates/minimizes the systemic contact[27,28]. The mechanism of KTZ involves inhibiting the cytochrome P450 mediated 14 α-demethylase enzyme which interfere with the synthesis of vital fungal membrane sterol, thus, inhibits the conversion of lanosterol to ergosterol[29,30].
The objective of the present study is to prepare, optimize and evaluate the KTZ-loaded NLCs utilizing novel and quick microwave-assisted microemulsion method employing 2 factor 3 level central composite experimental design (Design-Expert 12, State-Ease Inc., Minneapolis, USA) and developing sustained release system for topical administration. The optimized batch of KTZ-loaded NLC formulation was extensively characterized regarding morphology, Field Emission Scanning Electron Microscopy (FESEM), Fourier Transform Infrared (FTIR), Differential Scanning Calorimetry (DSC) and X-Ray Diffraction (XRD) analysis and further evaluated for in vitro drug release profile, cell uptake studies of NLCs by Confocal Laser Scanning Microscopy (CLSM), ex vivo permeation study and stability studies.
Materials and Methods
Materials:
KTZ was purchased from Hi-Media laboratories Pvt Ltd. (Mumbai, india), Compritol® 888 ATO (glyceryl behenate) and Labrafac PG (Propylene glycol dicaprolate) were obtained from Gattefosse India Pvt. Ltd. (Saint Priest, France). Methanol and chloroform were obtained from Fischer Scientific (Mumbai, India). Soya lecithin was supplied by Hi-Media laboratories Pvt Ltd. (Mumbai, India). Unless otherwise stated, all chemicals were used as received without further purification.
Methods:
Experimental design: NLCs of KTZ were prepared by microwave assisted technique deploying 2 factors, |3 levels central composite experimental design (Design-Expert version 12). Based on preliminary trials, concentration of liquid lipid (Labrafac PG) (0.3 %-1 %) and surfactant (soya lecithin) (1 % |-2 %) were selected as critical independent factor at three levels (+1, 0, -1) whereas p-size and Percentage (%) entrapment efficiency were taken as response variables[31-34].
Preparation of KTZ loaded NLC by microwave assisted method (MW-KTZ-NLC): NLCs containing KTZ was prepared by a single step microwave assisted method. The selection of both lipids i.e., solid and liquid lipid was done according to the solubility of KTZ in these lipids. The physical mixtures of solid and liquid lipid with were heated 5°-10° above the phase transition temperature of solid lipid and visualized for any precipitate. Both lipids i.e., Compritol® 888 ATO and Labrafac PG form a uniform stable homogeneous mixture on melting with no phase separation, were considered suitable to prepare NLC formulation[21,35].
In this technique all the constituents i.e., solid lipid (Compritol® 888 ATO), liquid lipid (Labrafac PG), surfactant (soya lecithin), distilled water and/or KTZ (0.2 %) were mixed and heated above the melting temperature of solid lipid that is 65°-77° in a borosilicate glass vessel with continuous stirring (around 900 rpm) and microwave power not exceeding 16-18 W for about 10 min in a synthesizer (CEM, Discover). After completion of the process the dispersion was rapidly cooled to 70° under Nitrogen (N2) atmosphere by the microwave reactor. Finally, the dispersion so obtained were cooled at room temperature to solidify the matrix[21,36]. The matrix so achieved was frozen at -80° for 4 h followed by lyophilisation in a laboratory model freeze-dryer (Alpha 2-4 LD Plus, Martin Chirst, Germany) at -90° and 0.0010 mbar pressure for 24 h.
Preparation of NLCs hydrogel: For improving the acceptability and patient compliance, optimized batch of MW-KTZ-NLC as suggested by the design was incorporated into a hydrogel using Carbopol® 934 as a gelling agent. Carbopol® 934 (500 mg) was added in optimized batch of MW-KTZ-NLC formulation (25 ml) and kept overnight for swelling. To neutralize the dispersion triethanolamine was added with continuous stirring till the translucent hydrogel was obtained[34,37].
Characterization of the NLCs:
Particle size, Polydispersity Index (PDI) and zeta potential of KTZ loaded NLC formulation was measured by Malvern zetasizer ZF90. All the samples were suitably diluted (1:200) with distilled water to avoid the multiple scattering and viscosity effect generated by the concentrated dispersion[33]. Dilutions have no impact on the z-average diameter, PDI and zeta potential of these formulations[21].
Total Drug Content (TDC) and % entrapment efficiency:
TDC was determined by dispersing 1 ml of MW- KTZ-NLC dispersion and 1 gm of MW-KTZ-NLC hydrogel in solvent system of chloroform: methanol (1:1, v/v) separately followed by centrifugation at 5000 rpm. The supernatant was filtered and analyzed by spectrophotometer by taking chloroform:methanol as blank at λmax of 244 nm. Finally, the standard calibration curve was used to calculate the TDC by the following equation (1).
TDC (%)=(Weight of drug in nanoparticles)/(Weight of nanoparticles)×100 (1)
For determining entrapment efficiency, the dialysis membrane (previously soaked in distilled water) was used having pore size 2.4 nm, molecular weight 12-14 kDa. Then, 1 ml of MW-KTZ-NLC dispersion and 1 gm of hydrogel was transferred in dialysis membrane and both ends of the dialysis membrane was hermetically sealed which was then dialyzed in methanol at 25° for 45 min. The receptor media was analyzed spectrophotometrically for total amount of drug. By disrupting the retained NLCs and hydrogel in the dialysis membrane using chloroform:methanol (1:1, v/v), the amount of total drug in NLC formulations and its hydrogel were calculated[29].
Entrapment efficiency (%) was calculated by the following equation (2)
Entrapment efficiency (%)=(Total amount of druguntrapped drug)/(Total amount of drug )×100 (2)
FESEM:
The morphology of optimized MW-KTZ-NLC formulation was studied by FESEM (HITACHI SU8010). The lyophilized NLC samples were dusted onto a double adhesive carbon tape on an aluminum stub which was then coated with gold under argon atmosphere[38]. Visualization of the NLCs was done by FESEM and photomicrographs were taken with an accelerating voltage of 8-20 Kv.
FT-IR analysis:
The FT-IR analysis was conducted for the characterization of any interaction between KTZ and other excipients of NLC formulations[39,40]. The FT- IR spectrum of pure KTZ, Compritol® 888 ATO, soya lecithin, physical mixture and lyophilized NLC formulation were obtained by FT-IR spectrophotometer (PerkinElmer Spectrum Version 10.03.08). The analysis was carried out by holding a small quantity of the NLC sample using Potassium Bromide (KBr) discs in the range of 400-4000 cm-1.
DSC:
Thermal analysis was done by using DSC (TA Instruments, Waters LLC, USA). DSC was used to examine the physical state and the thermal behavior of the Compritol® 888 ATO, pure KTZ and freeze-dried KTZ loaded NLC formulation[41]. For thermal analysis, standard aluminum pans containing small amount of samples (2 mg) was used. Samples were heated over a temperature range 40° to 400° under N2 atmosphere.
Powder XRD (PXRD):
PXRD pattern of pure KTZ, Compritol® 888 ATO and lyophilized MW-KTZ-NLC formulation was obtained using X-ray diffractometer (XPERT-PRO) and Cu, Kα and Kβ as radiations with current and voltage of 30 mA and 40 kV, respectively. The scan range between 0°–50° of the diffraction angle 2? were used to analyze the samples[34].
Stability studies:
For the evaluation of the stability of the NLC formulations, the samples were stored in closed glass vials at 4° for about 3 mo followed by determination of particle size, PDI, % entrapment efficiency and FT-IR study[42].
Evaluation of KTZ loaded NLCs hydrogel:
pH and Viscosity measurement: The pH of the hydrogel was examined by means of digital pH meter (Cyberscan 510, E, Merck, USA) by dipping the tip of the electrode in the hydrogel[38]. The viscosity of the optimized batch of MW-KTZ-NLCs hydrogel was measured by Brookfield viscometer[43] (Anton Paar GmbH, Vienna, Austria) at varied rpm using spindle No. 6.
Spreadability: The spreadability of the gel was examined by putting 0.5 gm gel inside a circle of 1 cm diameter already indicated on a glass plate and over it another glass plate was kept carrying a weight of 500 gm. The rise in diameter of hydrogel was recorded after 5 min [44].
In vitro drug release studies: The in vitro drug release study was done by most utilized dialysis membrane method[45-47]. Phosphate buffer (pH 7.4) added with 0.8 % Tween®80 was used as a release medium. The dialysis membrane (molecular weight cut off 12 000- 14 000 Da) soaked in distilled water for 12 h before use. MW-KTZ-NLC (1 gm) hydrogel was put in dialysis membrane and tied properly at the both ends and immersed in a beaker containing release medium (100 ml). The release medium was maintained at a temperature of (37±0.5°) with a stirring speed of 100 rpm[48]. 5 ml aliquot of sample was withdrawn from the release medium at pre-determined time intervals up to 24 h and replaced with equal amount of fresh medium to maintain sink conditions[49]. The withdrawn samples were analyzed spectrophotometrically to determine the KTZ concentration at λmax of 244 nm.
Ex vivo permeation studies: Ex vivo permeation of KTZ from NLCs hydrogel and marketed formulation (Ketorech KTZ IP 2 %) were performed using excised full thickness pig’s abdominal skin that is obtained from local slaughter house. The skin was mounted on the Franz diffusion cell in such a way that epidermal side was exposed to ambient condition while dermal side faced the receptor medium. Receptor compartment containing 30 ml Phosphate-Buffered Saline (PBS) (pH 7.4) added with 0.8 % Tween® 80 was thermostated at 37±0.5° and stirred at 600 rpm. The skin was soaked with receptor medium for about 1 h prior to the application of sample. Test samples (NLCs hydrogel and marketed formulation i.e., 2 % KTZ cream) equal to 20 mg KTZ was applied onto the donor side of the skin surface, separately. An aliquot of sample (5 ml) was withdrawn from the receptor compartment at various time intervals up to 12 h and instantly replaced with fresh receptor medium[34,47]. After 12 h drug permeation and flux (µg/ cm2/h) was calculated equation 3 and 4.
Cumulative amount of drug permeated=Conc (µg/ml)/ Area of permeation cell×volume of receiver chamber (3)
Flux=(Cumulative amount of drug permeated)/(Time (h) (4)
Cell uptake efficiency of delivery system using CLSM: For examining cell uptake efficiency, CLSM is employed for better visualization of drug transport across the skin. Hydrophillic fluorescent marker i.e., 5(6)-Carboxyfluorescein (CFC) loaded into the NLC formulations produced in a similar way as MW-KTZ- NLC was formulated using novel technique and were finally incorporated into the carbopol and compared with CFC-loaded plain hydrogel. Slides of pig skin treated with CFC-loaded NLCs hydrogel and CFC- loaded plain hydrogel were fixed and visualized for the presence of CFC in the skin layers by using confocal laser scanning microscope (Nikon C2+, CLSM, Japan, ver 4.30)[50-52]. The pictures were taken (10× magnification) at wavelength of 497 nm.
Results and Discussion
Solid lipids viz. Dynasan® 114, Compritol® 888 ATO and stearic acid and liquid lipids viz. oleic acid and Labrafac PG were sorted for screening purpose. Among all these lipids Compritol® 888, stearic acid were selected as solid lipids and Labrafac PG was selected as liquid lipid, as the drug get completely solubilized in these molten lipids. No drug crystals were observed when KTZ, Compritol® 888 ATO or stearic acid (solid lipids) and Labrafac PG (liquid lipid) were melted together. Out of Compritol® 888 ATO and stearic acid, Compritol® 888 ATO was selected for final formulation because of its better stability than stearic acid and also no phase separation was detected upon mixing. Soya lecithin was selected as a surfactant for the stabilization of o/w type microemulsion[21,33,53].
Experimental statistical design was applied to establish the conditions with the constraints of minimum particle size, low PDI and maximum entrapment efficiency (%) for all KTZ-loaded NLC formulations.
On the basis of preliminary trials different concentration of liquid lipid (Labrafac PG) (0.3 %-1 %) and soya lecithin (1 %-2 %) were selected as independent variables, whereas the dependent or response variables include R1-particle size (nm) and R2 % entrapment efficiency. Total 13 batches were suggested by the Design Expert to optimize the level of independent variables to formulate optimized NLC formulation with the desired responses. In Central Composite Design (CCD), it was found that the well fitted model for first response variable (R1) was quadratic and second response variable (R2) was linear. The results of regression analysis for both responses are summarized in Table 1.
| Runs | Independent variables Actual value (Coded value) |
Response variables | ||
|---|---|---|---|---|
| A-Liquid lipid (Labrafac PG) conc. (%) | B-Surfactant (soya lecithin) conc. (%) | R1-P-size (d.nm) |
R2-Entrapment efficiency (%) |
|
| 1 2 3 4 5 6 7 8 9 10 11 12 13 |
0.65 (0) 0.65 (0) 0.65 (0) 1 (+1) 0.65 (0) 0.3 (-1) 0.3 (-1) 1 (+1) 0.65 (0) 1 (+1) 0.65 (0) 0.3 (-1) 0.65 (0) |
1.5 (0) 2 (+1) 1.5 (0) 2 (+1) 1.5 (0) 1 (-1) 1.5 (0) 1 (-1) 1.5 (0) 1.5 (0) 1.5 (0) 2 (+1) 1 (-1) |
149.7 89.54 150.5 60.42 144.6 216.4 160.54 210.47 147.9 120.5 141.7 112.4 217.5 |
79.73 86.28 78.45 89.41 80.47 67.45 77.14 73.47 79.98 82.14 77.78 85.47 70.4 |
Table 1: Preparation MW-KTZ-NLC of by CCD
As per the results summarized in Table 1, the particle size varies from 60.42-217.5 nm and % entrapment efficiency ranges from 67.45 %-89.41 % while the Model F-value of 370.58 for particle size (R1) and 264.69 for % entrapment efficiency (R2) implies the significance of model. p<0.05 indicate terms i.e., A, B, AB, B2 for particle size (R ) and A, B for % entrapment efficiency (R2) were significant model terms. The lack of fit F-value of 1.15 for particle size (R1) and 0.46 for % entrapment efficiency (R2) indicate that the lack of fit was not significant and represents the best fitted model. Moreover, according to the suggested model, polynomial equation for particle size (R1) and % entrapment efficiency (R2) correlating the effect of various independent factors on response variables was generated by Analysis of Variance (ANOVA) test.
Particle size (R1)=146.50-16.33A-63.67B-11.51AB- 5.03A2+7.97B2 (5)
Entrapment efficiency (%) (R2)=79.09+2.49A+8.31B (6)
Where, A and B represent concentrations of liquid lipid and surfactant, respectively.
The positive and negative coefficient value for individual variables in this polynomial equation indicates the direct and indirect effect on responses. The effect of liquid lipid is more prominent at higher level on particle size whereas concentration of surfactant at higher level shows prominent effect on entrapment efficiency.
Table 2 summarizes the result of ANOVA on the response surface model. The polynomial model was found to be significant (p<0.05) with non-significant lack of fit (p>0.05). The higher value of R2 (>0.9) indicates good correlation between the experimental and predicted response. Adequate precision measuring signal to noise ratio was much above the required value of 4 indicates adequate signal and thus the model can be used navigate the design space.
| Response factors | Model | Lack of fit | |||||
|---|---|---|---|---|---|---|---|
| F-value | Prob.>F | R2 | Adq. Prec. | C.V | F-value | Prob.>F | |
| Particle size | 370.58 | 0.0001 | 0.9962 | 62.190 | 2.56 | 1.15 | 0.4323 |
| Entrapment efficiency (%) | 264.69 | 0.0014 | 0.9815 | 48.698 | 1.17 | 0.4593 | 0.8115 |
Table 2: Model Summary Statistics
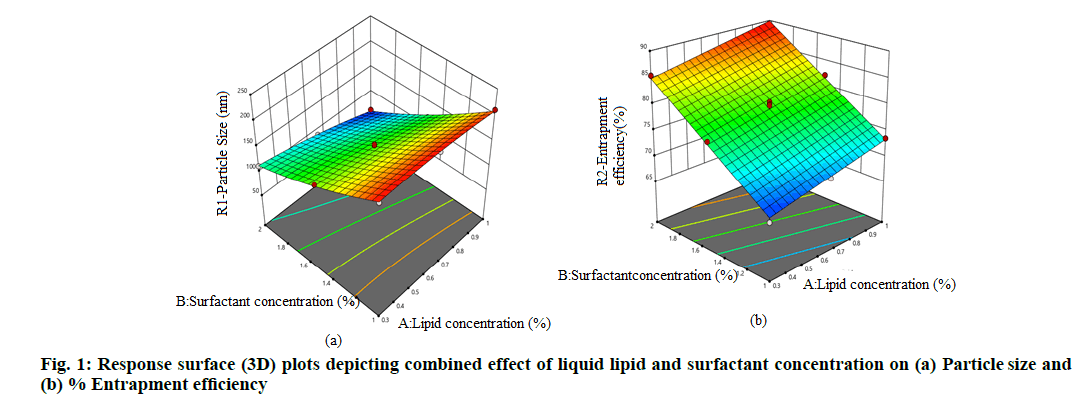
Fig. 1a and fig. 1b displayed combined effect of concentration of liquid lipid and surfactant on particle size and entrapment efficiency, respectively, depicting a linear releltionship between independent and response variables. From 3D response surface graphs fig. 1a and fig. 1b, it was inferred that particle size decreases with increase in concentration of lipid and surfactant whereas, % entrapment efficiency increases with increasing lipid and surfactant concentration.
The parameters suggested for the optimized batch having constraints of minimized p-size and maximised % entrapment efficiency by the design expert were concentration of both liqid lipid and of surfactant is at +1 level. The average p-size (nm), PDI and zeta potential of the optimized NLC formulation was found to be 60.15 nm (predicted 59.563) with PDI of 0.296 having zeta potential of -16.2 mV. Generally, nanoparticle with z-average diameter of 50-250 nm are considered to be promising drug delivery systems as they have the tendency to improve therapy because of their ability to overcome biological barriers[18,28,31]. The TDC of the optimized NLC formulation was found to be 91 % with entrapment efficiency of 89 % (predicted 89.730 %). High values of TDC revealed that non-significant losses occurred during the processes of preparation of NLC by microwave assisted method and higher % entrapment efficiency denote the appropriateness of the technique used for preparing NLCs[32]. The closer agreement between predicted and observed values indicated the high prognostic ability of the model.
Yellowish opaque NLCs formulations were obtained. The particle size mainly affects the characteristics of NLCs and is also considered as a significant indicator of their quality and performance. Particles with smaller size are expected to remain highly stable. Production of nano-sized optimized MW-KTZ-NLCs was confirmed by analyzing particle size, FESEM, FT-IR analysis, thermal analysis and PXRD study.
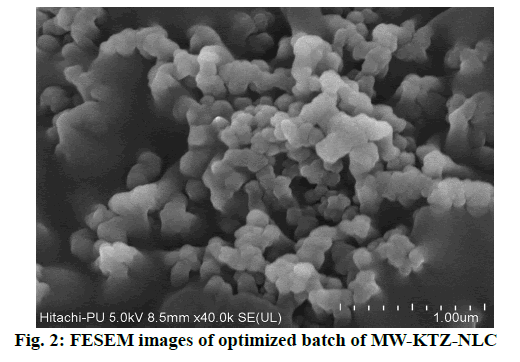
FESEM image or photomicrograph (fig. 2) of MW- KTZ-NLCs revealed that NLCs were spherical in shape. Although it was not common, some particle agglomerates or clumps were also observed. The particle aggregations might be due to sticky nature of the lipid or it may rise from risks associated with shrinkage of NLCs during drying[34,54].
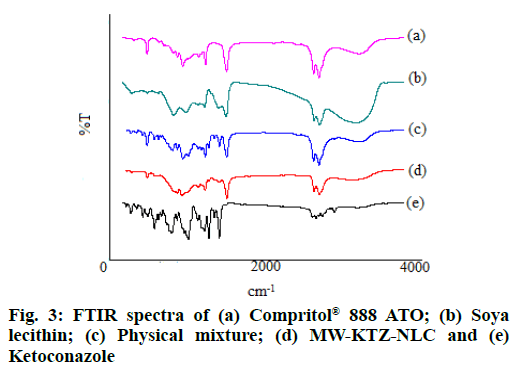
FT-IR spectra of pure KTZ, lipid Compritol® 888 ATO, surfactant soya lecithin and optimized batch of MW-KTZ-NLCs formulation are shown in fig. 3. KTZ displayed intense characteristics peaks at 1645 cm-1 (-C=O stretch), 1511 cm-1 (-C=C aromatic stretch), 1247 cm-1 (-CO stretching of cyclic ether), 1033 cm-1 (-C-O stretching of aliphatic ether) and 815 cm-1 (-C- Cl stretch), respectively. Compritol® 888 ATO showed characteristic peaks at 2919 cm-1, 2850 cm-1 (alkanes stretch) and 1738 cm-1 (-C=O ester stretch). Soya lecithin displayed characteristic peaks at 2925 cm-1, 2855 cm-1 (alkanes stretch) and 1738 cm-1 (-C=O ester stretch). All intense absorption peaks of KTZ, Compritol® 888 ATO and soya lecithin were detected in the spectra of physical mixture. However, a reduction in the sharpness of some peaks was observed when compared to the spectra of pure compounds. The retention of characteristic peaks in optimized MW-KTZ-NLCs formulation revealed absence of interaction of the components and the absence of KTZ characteristic peaks, confirmed embedding of KTZ molecules in lipid matrix.
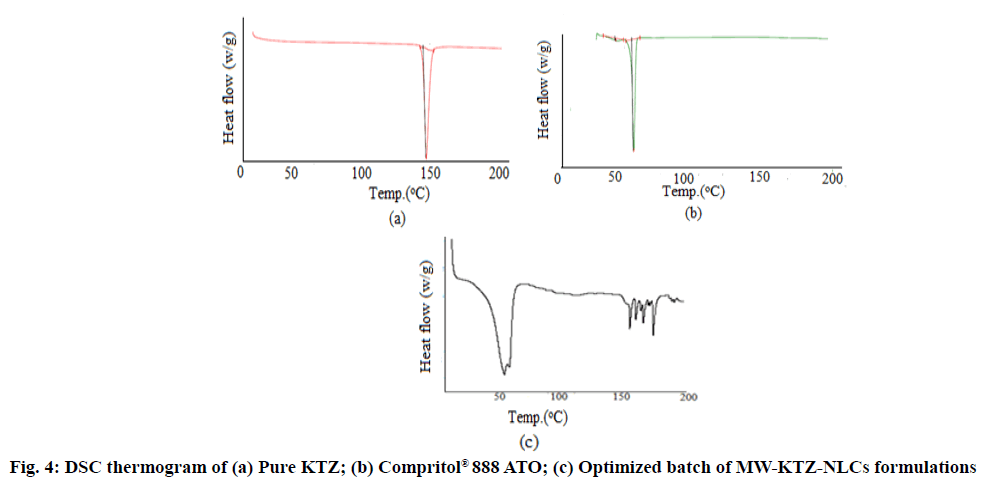
The DSC thermogram of pure Compritol® 888 ATO, pure KTZ and optimized batch of MW-KTZ-NLCs formulation are depicted in fig. 4. Pure Compritol® 888 ATO exhibits an endothermic thermal event attributed to its melting with an onset of 70.21° and a peak temperature of 72.93° with heat of fusion of 127.2 J/g. The melting temperature of MW-KTZ-NLCs formulations (at 63.68° with heat of fusion of 32.415 J/g) was still above the body temperature indicating that NLCs remain solid at normal body temperature. These results indicate the absence of any super cooled melts (lipid not crystallized in a colloidally dispersed state) that may possibly be formed during the production of NLC formulations[21,36]. It should be noted that the thermograms of the optimized lyophilized MW- KTZ-NLCs formulation showed the disappearance of endothermic peak at around 150° that corresponds to the melting point of KTZ confirming the embedding of KTZ in the lipid matrix in its amorphous form[55,56].
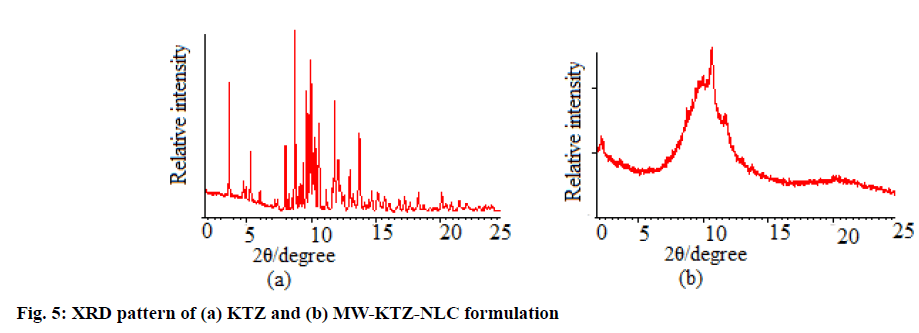
PXRD of pure KTZ and optimized MW-KTZ-NLCs formulation (fig. 5) was studied to look for the changes in crystallinity when drug is encapsulated in lipid matrix[51]. The PXRD pattern of pure KTZ shows intense peaks at 2θ scattered angles of 23° and 48.10° indicating its crystalline state. The PXRD pattern of optimized MW-KTZ-NLCs formulation indicates amorphous nature of the formulations, thus supported the results obtained by DSC[37,40].
Particle size, PDI and % entrapment efficiency of the optimized batch of MW-KTZ-NLC prepared by microwave assisted technique was determined after storing for 3 mo at 4°. The optimized batch showed average p-size 109.1 nm, PDI of 0.219 with 87 % of entrapment efficiency. However, FTIR spectra did not revealed any significant change. Thus, from the results it is indicated that MW-KTZ-NLC are found to be stable.
The optimized batch of NLCs produced microwave assisted method was incorporated into hydrogel by using Carbopol® 934 (1 %).
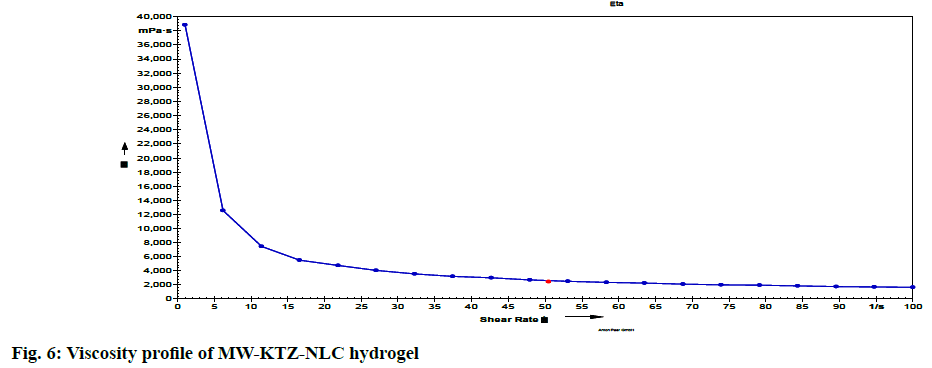
The pH of optimized MW-KTZ-NLC hydrogel was determined using pH meter in triplicate at room temperature and was found to be 6.9±0.47. This pH range is compatible with pH of skin, allowing the safe and effective use of hydrogel on the topical application. The preparation spreads up to diameter of 4.9±0.24 cm indicated good spreadability of hydrogel. The viscosity of MW-KTZ-NLCs hydrogel was measured at different shear rate. By examining the viscosity profiles (shear rate vs. viscosity) (fig. 6) a drop in viscosity was observed by increasing shear rate representing non- newtonian behavior[57].
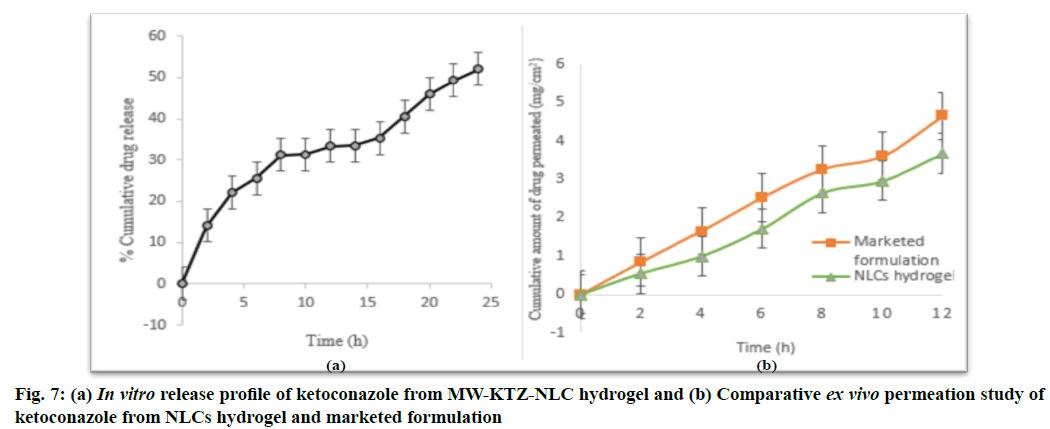
In vitro drug release studies for the optimized batch of NLCs incorporated into hydrogel produced by single- step microwave assisted technique were performed and the % release of KTZ from MW-KTZ-NLC hydrogel is shown in fig. 7. The biphasic release pattern was observed having initial burst release for 5 h followed by slower release upto 24 h. The initial burst release might be occurred because of the following possibilities i.e., presence of free (unencapsulated) drug molecules in the lipid nanoparticles or release of adsorbed drug molecules from the surface of lipid nanoparticles or passage of a few small lipid nanoparticles (10-15 nm) across the dialysis membrane[58].
Approximately 50 % of KTZ was released from MW- KTZ-NLCs hydrogel after 24 h (fig. 7). The release data was fitted into various release kinetic model to determine their release kinetic and mechanism of drug release from the optimized NLCs hydrogel. The release kinetic data of the optimized MW-KTZ-NLCs hydrogel was best fitted into the Higuchi’s square root release kinetic model based on the regression coefficient (R2 of 0.9900 and 0.9932 respectively). Further the value of release exponent n (0.43< n<0.85) determined Fickian diffusion mechanism of drug release (Table 3)[59].
| Formulations | Release rate kinetic models | ||||
|---|---|---|---|---|---|
| Zero order R2 | First order R2 | Higuchi R2 |
Korsmeyer peppas | ||
| R2 | n | ||||
| MW-KTZ-NLC hydrogel | 0.9498 | 0.7689 | 0.9774 | 0.9759 | 0.4393 |
Table 3: Release Kinetics and Modeling Data of Optimized KTZ-NLC and MW-KTZ-NLC Hydrogel
Ex vivo drug permeation studies were performed using Franz diffusion cell for the KTZ loaded NLCs hydrogel and marketed formulation (Ketorech, KTZ IP 2 %). The amount of drug permeated via skin was found to be 4644.78 µg/cm2 and 3670.99 µg/cm2 (fig. 7) with the flux rate of 387.06 µg/cm2/h and 305.91 µg/cm2/h for marketed formulation and KTZ loaded NLCs hydrogel, respectively in 12 h. It was observed that drug released slowly from KTZ loaded NLCs hydrogel as compared with the marketed formulation Ketorech® thus providing the sustained release.
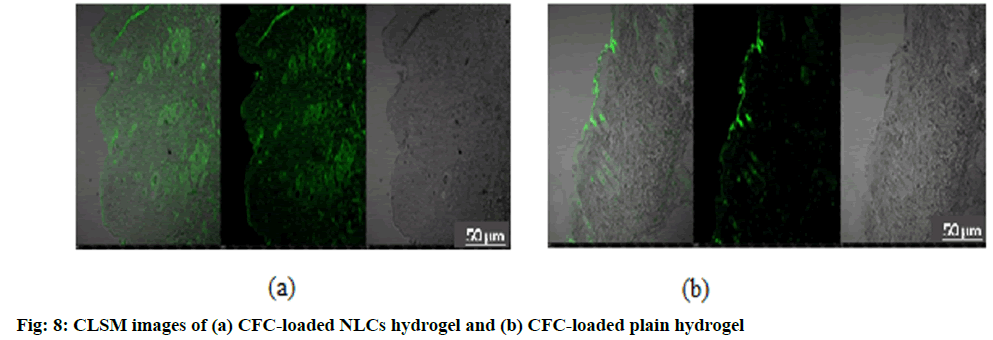
Fig. 8 shows the CLSM images of penetration of CFC-loaded NLCs hydrogel and CFC-loaded plain hydrogel in skin layers. On comparing the images, the CFC-loaded NLCs hydrogel clearly indicated the deep penetration of fluorescent marker as compared to CFC- loaded plain hydrogel. These observations confirm that high drug level can possibly reaches to inner layers of skin which are the target sites for drug action[60].
In the current work, NLCs of KTZ were successfully formulated by a quick single-step microwave assisted technique using solid lipid Compritol® 888 ATO, liquid lipid Labrafac PG and soya lecithin as a surfactant for topical delivery employing Quality by Design (QbD) approach. Optimized batch of MW-KTZ-NLCs produced particles with average p-size of 60.15 nm with narrow PDI and high entrapment efficiency. PXRD study confirmed that the crystalline nature of KTZ changed to amorphous form in the NLC formulation and thermal behavior was analyzed by DSC that also confirmed inclusion of KTZ into lipid matrix in its amorphous form in the NLC formulations. Further, the optimized batch of MW-KTZ-NLC was incorporated into hydrogel using Carbopol® 934 as a gelling agent and evaluated for cell uptake efficiency, in vitro release study and ex vivo permeation. In vitro release data of optimized MW-KTZ-NLCs hydrogel formulation exhibited biphasic release, initial burst release followed by slower release upto 24 h and following diffusion mechanism of drug release. After performing the preparation and evaluations it can be concluded that NLCs bear the potential to be explored more for the topical and other pharmaceutical applications.
Acknowledgements:
The authors would like to thank the Department of Pharmaceutical Sciences, GJUS&T Hisar and UGC- NRC, UIPS, Panjab University, Chandigarh, for providing necessary facilities for performing the research work.
Conflict of interests:
The authors declared no conflicts of interest.
References
- Garcês A, Amaral MH, Lobo JMS, Silva AC. Formulations based on solid lipid nanoparticles (SLN) and nanostructured lipid carriers (NLC) for cutaneous use: A review. Eur J Pharm Sci 2018;112:159–167.
[CrossRef] [Google Scholar] [Pub Med]
- Bhowmik D. Recent advances in novel topical drug delivery system. Pharm Innov 2012;1(9).
- Kaur J, Kaur J, Jaiswal S, Gupta G. Recent advances in topical drug delivery system. Pharm Res 2016;6(07):6353-69.
- Singh N, Chawla S. Recent advances in nanostructured lipid carriers for biomedical applications: A review 2017;4(1):40-4.
- Müller R, Maaben S, Weyhers H, Mehnert W. Phagocytic uptake and cytotoxicity of solid lipid nanoparticles (SLN) sterically stabilized with poloxamine 908 and poloxamer 407. J Drug Target 1996;4(3):161-70.
[CrossRef] [Google Scholar] [Pub Med]
- Pardeike J, Hommoss A, Müller RH. Lipid nanoparticles (SLN, NLC) in cosmetic and pharmaceutical dermal products. Int J Pharm 2009;366(1-2):170-84.
[CrossRef] [Google Scholar] [Pub Med]
- Müller RH, Radtke M, Wissing SA. Solid lipid nanoparticles (SLN) and nanostructured lipid carriers (NLC) in cosmetic and dermatological preparations. Adv Drug Deliv Rev 2002;54:S131-55.
[CrossRef] [Google Scholar] [Pub Med]
- Chakraborty S, Keller E, Talley J, Srivastav A, Ray A, Kim S. Void fraction measurement in two-phase flow processes via symbolic dynamic filtering of ultrasonic signals. Meas Sci Technol 2009;20(2):023001.
- Moghimi SM, Symonds P, Murray JC, Hunter AC, Debska G, Szewczyk A. A two-stage poly (ethylenimine)-mediated cytotoxicity: Implications for gene transfer/therapy. Mol Ther 2005;11(6):990-5.
[CrossRef] [Google Scholar] [Pub Med]
- Aditya NP, Macedo AS, Doktorovova S, Souto EB, Kim S, Chang PS, et al. Development and evaluation of lipid nanocarriers for quercetin delivery: A comparative study of solid lipid nanoparticles (SLN), nanostructured lipid carriers (NLC) and lipid nanoemulsions (LNE). LWT-Food Sci Technol 2014;59(1):115-21.
- Gomes GV, Sola MR, Rochetti AL, Fukumasu H, Vicente AA, Pinho SC. β-carotene and α-tocopherol coencapsulated in nanostructured lipid carriers of murumuru (Astrocaryum murumuru) butter produced by phase inversion temperature method: Characterisation, dynamic in vitro digestion and cell viability study. J Microencapsul 2019;36(1):43-52.
[CrossRef] [Google Scholar] [Pub Med]
- Rapalli VK, Kaul V, Waghule T, Gorantla S, Sharma S, Roy A, et al. Curcumin loaded nanostructured lipid carriers for enhanced skin retained topical delivery: Optimization, scale-up, in vitro characterization and assessment of ex vivo skin deposition. Eur J Pharm Sci 2020;152:105438.
- Sadiah S, Anwar E, Djufri M, Cahyaningsih U. Preparation and characteristics of nanostructured lipid carrier (NLC) loaded red ginger extract using high pressure homogenizer method. J Pharm Sci Res 2017;9(10):1889-93.
- Pinto MF, Moura CC, Nunes C, Segundo MA, Lima SA, Reis S. A new topical formulation for psoriasis: Development of methotrexate-loaded nanostructured lipid carriers. Int J Pharm 2014;477(1-2):519-26.
[CrossRef] [Google Scholar] [Pub Med]
- Das S, Ng WK, Tan RB. Are nanostructured lipid carriers (NLCs) better than solid lipid nanoparticles (SLNs): Development, characterizations and comparative evaluations of clotrimazole-loaded SLNs and NLCs? Eur J Pharm Sci 2012;47(1):139-51.
[CrossRef] [Google Scholar] [Pub Med]
- Uprit S, Sahu RK, Roy A, Pare A. Preparation and characterization of minoxidil loaded nanostructured lipid carrier gel for effective treatment of alopecia. Saudi Pharm J 2013;21(4):379-85.
[CrossRef] [Google Scholar] [Pub Med]
- Ranpise HA, Gujar KN, Pawar SC, Awasthi R, Dua K, Mathure D, et al. Formulation, optimization and evaluation of ketoconazole loaded nanostructured lipid carrier gel for topical delivery. Drug Deliv Lett 2020;10(1):61-71.
- Souto EB, Müller RH. SLN and NLC for topical delivery of ketoconazole. J Microencapsul 2005;22(5):501-10.
[CrossRef] [Google Scholar] [Pub Med]
- Kumar S, Kaur P, Bernela M, Rani R, Thakur R. Ketoconazole encapsulated in chitosan-gellan gum nanocomplexes exhibits prolonged antifungal activity. Int J Biol Macromol 2016;93:988-94.
[CrossRef] [Google Scholar] [Pub Med]
- Betts JN, Johnson MG, Rygiewicz PT, King GA, Andersen CP. Potential for metal contamination by direct sonication of nanoparticle suspensions. Environ Toxicol Chem 2013;32(4):889-93.
[CrossRef] [Google Scholar] [Pub Med]
- Shah RM, Malherbe F, Eldridge D, Palombo EA, Harding IH. Physicochemical characterization of solid lipid nanoparticles (SLNs) prepared by a novel microemulsion technique. J Colloid Interface Sci 2014;428:286-94.
[CrossRef] [Google Scholar] [Pub Med]
- Shah RM, Eldridge DS, Palombo EA, Harding IH. Microwave-assisted microemulsion technique for production of miconazole nitrate- and econazole nitrate-loaded solid lipid nanoparticles. Eur J Pharm Biopharm 2017;117:141-50.
[CrossRef] [Google Scholar] [Pub Med]
- Nadagouda MN, Speth TF, Varma RS. Microwave-assisted green synthesis of silver nanostructures. Acc Chem Res 2011;44(7):469-78.
- Dunn SS, Vera DR, Benhabbour SR, Parrott MC. Rapid microwave-assisted synthesis of sub-30 nm lipid nanoparticles. J Colloid Interface Sci 2017;488:240-5.
[CrossRef] [Google Scholar] [Pub Med]
- Pimentel-Moral S, Teixeira MC, Fernandes AR, Borrás-Linares I, Arráez-Román D, Martínez-Férez A, et al. Polyphenols-enriched Hibiscus sabdariffa extract-loaded nanostructured lipid carriers (NLC): Optimization by multi-response surface methodology. J Drug Deliv Sci Technol 2019;49:660-7.
- Paolicellia P, Correntea F, Serricchioa D, Cerretoa F, Cesaa S, Titab B. The system SLN-Dextran hydrogel: An application for the topical delivery of ketoconazole. J Chem Pharm Res 2011;3(4):410-21.
- Alam MA, Al-Janoobi FI, Alzahrani KA, Al-Agamy MH, Abdelgalil AA, Al-Mohizea AM. In vitro efficacies of topical microemulsions of clotrimazole and ketoconazole; and in vivo performance of clotrimazole microemulsion. J Drug Deliv Sci Technol 2017;39:408-16.
- Jain S, Jain S, Khare P, Gulbake A, Bansal D, Jain SK. Design and development of solid lipid nanoparticles for topical delivery of an anti-fungal agent. Drug Deliv 2010;17(6):443-51.
[CrossRef] [Google Scholar] [Pub Med]
- Souto EB, Müller RH. SLN and NLC for topical delivery of ketoconazole. J Microencapsul 2005;22(5):501-10.
[CrossRef] [Google Scholar] [Pub Med]
- Tiwari N, Sivakumar A, Mukherjee A, Chandrasekaran N. Enhanced antifungal activity of ketoconazole using rose oil based novel microemulsion formulation. J Drug Deliv Sci Technol 2018;47:434-44.
- Qumber M, Alruwaili NK, Bukhari SN, Alharbi KS, Imam SS, Afzal M, et al. BBD-based development of itraconazole loaded nanostructured lipid carrier for topical delivery: In vitro evaluation and antimicrobial assessment. J Pharm Innov 2021;16(1):85-98.
- Thapa C, Ahad A, Aqil M, Imam SS, Sultana Y. Formulation and optimization of nanostructured lipid carriers to enhance oral bioavailability of telmisartan using Box–Behnken design. J Drug Deliv Sci Technol 2018;44:431-9.
- Cavalcanti SM, Nunes C, Lima SC, Soares-Sobrinho JL, Reis S. Optimization of nanostructured lipid carriers for Zidovudine delivery using a microwave-assisted production method. Eur J Pharm Sci 2018;122:22-30.
[CrossRef] [Google Scholar] [Pub Med]
- Gaba B, Fazil M, Khan S, Ali A, Baboota S, Ali J. Nanostructured lipid carrier system for topical delivery of terbinafine hydrochloride. Bull Fac Pharm Cairo Univ 2015;53(2):147-59.
- Waghule T, Rapalli VK, Singhvi G, Manchanda P, Hans N, Dubey SK, et al. Voriconazole loaded nanostructured lipid carriers based topical delivery system: QbD based designing, characterization, in vitro and ex vivo evaluation. J Drug Deliv Sci Technol 2019;52:303-15.
- Shah RM, Eldridge DS, Palombo EA, Harding IH. Microwave-assisted formulation of solid lipid nanoparticles loaded with non-steroidal anti-inflammatory drugs. Int J Pharm 2016;515(1-2):543-54.
[CrossRef] [Google Scholar] [Pub Med]
- Kakkar V, Kaur IP, Kaur AP, Saini K, Singh KK. Topical delivery of tetrahydrocurcumin lipid nanoparticles effectively inhibits skin inflammation: In vitro and in vivo study. Drug Dev Ind Pharm 2018;44(10):1701-12.
[CrossRef] [Google Scholar] [Pub Med]
- Wei L, Yang Y, Shi K, Wu J, Zhao W, Mo J. Preparation and characterization of loperamide-loaded dynasan 114 solid lipid nanoparticles for increased oral absorption in the treatment of diarrhea. Front Pharmacol 2016;7:332.
[CrossRef] [Google Scholar] [Pub Med]
- Üner M, Karaman EF. Preliminary studies on solid lipid microparticles of loratadine for the treatment of allergic reactions via the nasal route. Trop J Pharm Res 2013;12(3):287-93.
- Kakkar S, Karuppayil SM, Raut JS, Giansanti F, Papucci L, Schiavone N, et al. Lipid-polyethylene glycol based nano-ocular formulation of ketoconazole. Int J Pharm 2015;495(1):276-89.
[CrossRef] [Google Scholar] [Pub Med]
- Saedi A, Rostamizadeh K, Parsa M, Dalali N, Ahmadi N. Preparation and characterization of nanostructured lipid carriers as drug delivery system: Influence of liquid lipid types on loading and cytotoxicity. Chem Phys Lipids 2018;216:65-72.
[CrossRef] [Google Scholar] [Pub Med]
- Elmowafy M, Shalaby K, Badran MM, Ali HM, Abdel-Bakky MS, Ibrahim HM. Multifunctional carbamazepine loaded nanostructured lipid carrier (NLC) formulation. Int J Pharm 2018;550(1-2):359-71.
[CrossRef] [Google Scholar] [Pub Med]
- Bhatia M, Saini M. Formulation and evaluation of curcumin microsponges for oral and topical drug delivery. Prog Biomater 2018;7(3):239-48.
[CrossRef] [Google Scholar] [Pub Med]
- Joshi M, Patravale V. Formulation and evaluation of nanostructured lipid carrier (NLC)–based gel of Valdecoxib. Drug Dev Ind Pharm 2006;32(8):911-8.
[CrossRef] [Google Scholar] [Pub Med]
- Luo Y, Chen D, Ren L, Zhao X, Qin J. Solid lipid nanoparticles for enhancing vinpocetine's oral bioavailability. J Control Release 2006;114(1):53-9.
[CrossRef] [Google Scholar] [Pub Med]
- Pinheiro M, Ribeiro R, Vieira A, Andrade F, Reis S. Design of a nanostructured lipid carrier intended to improve the treatment of tuberculosis. Drug Des Devel Ther 2016;10:2467.
[CrossRef] [Google Scholar] [Pub Med]
- Sanap GS, Mohanta GP. Design and evaluation of miconazole nitrate loaded nanostructured lipid carriers (NLC) for improving the antifungal therapy. J App Pharm Sci 2013;3(1):46.
- Abousamra MM, Mohsen AM. Solid lipid nanoparticles and nanostructured lipid carriers of tolnaftate: Design, optimization and in vitro evaluation. Int J Pharm Pharm Sci 2016;10:100.
- Khan S, Baboota S, Ali J, Narang RS, Narang JK. Chlorogenic acid stabilized nanostructured lipid carriers (NLC) of atorvastatin: Formulation, design and in vivo evaluation. Drug Dev Ind Pharm 2016;42(2):209-20.
[CrossRef] [Google Scholar] [Pub Med]
- Gupta V, Trivedi P. Ex vivo localization and permeation of cisplatin from novel topical formulations through excised pig, goat and mice skin and in vitro characterization for effective management of skin-cited malignancies. Artif Cells Nanomed Biotechnol 2015;43(6):373-82.
[CrossRef] [Google Scholar] [Pub Med]
- Pople PV, Singh KK. Targeting tacrolimus to deeper layers of skin with improved safety for treatment of atopic dermatitis. Int J Pharm 2010;398(1-2):165-78.
[CrossRef] [Google Scholar] [Pub Med]
- Wadhwa S, Singh B, Sharma G, Raza K, Katare OP. Liposomal fusidic acid as a potential delivery system: A new paradigm in the treatment of chronic plaque psoriasis. Drug Deliv 2016;23(4):1204-13.
[CrossRef] [Google Scholar] [Pub Med]
- Patel MN, Lakkadwala S, Majrad MS, Injeti ER, Gollmer SM, Shah ZA, et al. Characterization and evaluation of 5-fluorouracil-loaded solid lipid nanoparticles prepared via a temperature-modulated solidification technique. AAPS PharmSciTech 2014;15(6):1498-508.
[CrossRef] [Google Scholar] [Pub Med]
- Das S, Ng WK, Tan RB. Are nanostructured lipid carriers (NLCs) better than solid lipid nanoparticles (SLNs): Development, characterizations and comparative evaluations of clotrimazole-loaded SLNs and NLCs? Eur J Pharm Sci 2012;47(1):139-51.
[CrossRef] [Google Scholar] [Pub Med]
- Anantachaisilp S, Smith SM, Treetong A, Pratontep S, Puttipipatkhachorn S, Ruktanonchai UR. Chemical and structural investigation of lipid nanoparticles: Drug–lipid interaction and molecular distribution. Nanotechnology 2010;21(12):125102.
[CrossRef] [Google Scholar] [Pub Med]
- Chen H, Chang X, Du D, Liu W, Liu J, Weng T, et al. Podophyllotoxin-loaded solid lipid nanoparticles for epidermal targeting. J Control Release 2006;110(2):296-306.
[CrossRef] [Google Scholar] [Pub Med]
- Ortan A, Parvu CD, Ghica MV, Popescu LM, Ionita L. Rheological study of a liposomal hydrogel based on carbopol. Rom Biotechnol Lett 2011;16(1):47-54.
- Bhandari R, Kaur IP. Pharmacokinetics, tissue distribution and relative bioavailability of isoniazid-solid lipid nanoparticles. Int J Pharm 2013;441(1-2):202-12.
[CrossRef] [Google Scholar] [Pub Med]
- Dash S, Murthy PN, Nath L, Chowdhury P. Kinetic modeling on drug release from controlled drug delivery systems. Acta Pol Pharm 2010;67(3):217-23.
- Betts JN, Johnson MG, Rygiewicz PT, King GA, Andersen CP. Potential for metal contamination by direct sonication of nanoparticle suspensions. Environ Toxicol Chem 2013;32(4):889-93.
[CrossRef] [Google Scholar] [Pub Med]
