- *Corresponding Author:
- Y. Ozalp
Department of Pharmaceutical Technology, Faculty of Pharmacy, Near East University, Nicosia 943, Cyprus, Turkey
E-mail: yildiz.ozalp@neu.edu.tr
| Date of Received | 12 May 2021 |
| Date of Revision | 21 June 2023 |
| Date of Acceptance | 02 August 2023 |
| Indian J Pharm Sci 2023;85(4):1015-1024 |
This is an open access article distributed under the terms of the Creative Commons Attribution-NonCommercial-ShareAlike 3.0 License, which allows others to remix, tweak, and build upon the work non-commercially, as long as the author is credited and the new creations are licensed under the identical terms
Abstract
This study investigates the feasibility of directly compressing high doses of metformin hydrochloride despite its poor compressibility. With regards to clearly outlined scientific principles, Quality by Design places a great emphasis on the systematic development of products. However, it is highly helpful and essential to understanding the causes and the interactions between the product components through a set of desired tests. Metformin hydrochloride powder was compressed using flat faced Euro B punch of 15 mm diameter, using Compaction Simulator (Stylcam 200R) at different compaction forces. Quality control tests were done on the compressed tablets and were evaluated. Utilizing the quality by design method with Umetric MODDE software, the necessity to develop direct compressible metformin hydrochloride was addressed. Tablet tensile strength, friability and disintegration time were evaluated. The effect of formulation components and variables was assessed. Binder types implemented as a singular unit or as combination showed their effect on formulation. By evaluating the variations in formulations and optimization of metformin hydrochloride, a design space was established through the identification of the critical process parameters, critical quality attributes, and the risk assessment with the aid of Modde Pro 12.1 software. Design of experiment was applied for a better understanding of the interactions between formulation variables and process parameters to achieve an optimum formulation. Metformin hydrochloride was successfully developed by direct compression and the simultaneous application of quality by design assisted in obtaining a robust formulation.
Keywords
Quality by design, direct compression, metformin hydrochloride, Compressibility, tableting
The biguanide class of antihyperglycemic drug metformin hydrochloride is used to treat type II diabetes mellitus by decreasing the liver's synthesis of glucose and improving the body's sensitivity to insulin[1]. Metformin hydrochloride (HCl) has high aqueous solubility (˃300 mg/ml at 25°), it exhibits hygroscopic behavior[2-3]. Due to its high solubility and low permeability, metformin HCl is categorized as class III in the Biopharmaceutical Classification System (BCS). Metformin HCl's relatively poor bioavailability (50-60 %) and short, erratic biological half-life are explained by the BCS classification[4]. In formulation development, understanding the BCS classification of a drug plays a vital role in the formulation design. The approach in designing a formulation of metformin HCl will be different with respect to other antidiabetic drugs such as Pioglitazone. This is a result of differences in BCS classifications and some physicochemical properties.
To date, tablets remain the most commonly used dosage form due to the ease of manufacturing, high patience compliance, dosage accuracy, and drug stability advantages[3]. Tablets are solid dosage forms mainly for oral use, consisting of one or more Active Pharmaceutical Ingredients (API) and complimentary excipients which are added for various reasons. Tablets are formulated according to API tableting properties and intended kinetics of the medication (immediate release, delayed-release, or extended-release) in the body.
Direct compression method is the simplest unit process for tableting of all known tablet unit process methods. Flowability, compressibility and dilution potential of a powder are highly influential characteristics for direct compression. In drug development, there is no single drug entity or excipient which possesses every physicochemical property required for a direct-compression manufacturing process. It is common in drug formulations that the majority of drugs (70 %-80 %) contain higher excipient concentration in the tablets than API. This notion could prove to be challenging for drugs with high therapeutic doses and poor compressibility characteristics, such as Metformin HCl, thus, creating a problem with the final weight being beyond acceptable limits[2].
For improved flowability/compressibility, the grade, amount, and particle size of functional excipients (like binder and filler) have an impact on the formulation's effectiveness and final quality. The tablet strength contributes significantly to determining the final quality and performance of the formulation. Hence, the mechanism responsible for attaining a suitable tensile strength is associated with the addition of binder[5].
The importance of binder concentration in a formulation focuses on how much void can be filled in a tablet, which plays a role in tablet porosity and the tensile strength of the tablet[6-8]. The implementation of Quality by Design (QbD) has proven to be imperative in the optimization and development of formulations.
The International Conference on Harmonization (ICH) guidelines encourage the methodical procedure known as "QbD" for the development of pharmacological dosage forms (ICH). In order to achieve a specific product quality objective, it includes designing, formulations, and manufacturing procedures. The drug regulatory agencies have advocated for this approach recently to create higher-quality products (ICH, 2005; ICH 2009)[9].
QbD approach applied product design process helps in decreasing end product tests by ensuring product control at the design stage. QbD approach also helps in giving more clarity to formulations and manufacturing process dynamics when compared with traditional development approaches. Moreover, the formulation contributes to understanding the effect of production processes on production reliability and efficacy[10]. QbD gives an emphasis on the systemic development of products in regard to strong laid out scientific principles (FDA guidance 2006). Understanding the dynamics and the relations between product components with a set of desired experiments is however very useful and vital[11].
The aim of this study is to optimize the formulation of metformin HCl tablets using the direct compression method and QbD approach, to demonstrate the effectiveness of QbD approach in identifying Critical Quality Attributes (CQAs), understanding how they are affected by formulation and process variables, and achieving the desired product quality with minimal variability. The study will also aim to develop a metformin HCl tablet formulation with desirable tablet properties, including tensile strength, friability, disintegration, and dissolution rate, using the QbD approach.
Materials and Methods
Materials:
Metformin HCl was gifted by Sanovel İlaç (Turkey), Avicel®102 (FMC, USA), and different types of binders used for comparison: Kollidon® VA 64 Fine (BASF, Germany), and LHPC-21 (Harke Group, Germany), Starch 1500® (Colorcon) was used, Primojel® (DFE), and Magnesium Stearate (Peter Greven, Switzerland) were used.
Methods:
Experimental design: QbD was utilized in the Design of Experiment (DoE), to investigate the impact of risk on the formulation's CQAs. A factorial design was used for the optimization of the formulation parameters and to evaluate the effect of the excipients on the drug release and tablet compaction characteristics. Based on risk analysis, the independent variables were selected. The amounts of Kollidon® VA 64 Fine (X1), LHPC-21(X2), and Primojel® (X3) were selected as the three variables of the formulations. Based on preliminary trials, the levels for these three factors were determined. The responses (dependent variables) studied were tensile strength of tablets, friability, and disintegration time. A software called Modde Pro 12.1 (Umetrics, Sweden) was used to develop the assessment of the experimental design.
Preparation of tablets: Table 1 shows the list and varying compositions of the trial formulations prepared with different amounts of excipients. To understand the compressibility of metformin HCl, different ratios (1:0.5, 1:0.75, and 1:1) were mixed. Binder amounts were kept at different concentrations. Starch 1500 and magnesium stearate were kept constant. Mixing of the excipients was done using a cubic mixer (Erweka KB 15, Germany) 75 rpm at room temperature. Metformin HCl was passed through 30# sieve and mixed with excipients for 5 min. Magnesium stearate was added to the blend and mixed for an additional 5 min. The final mixture was compacted using various compaction forces (20 kN and 30 kN). Utilizing a compaction simulator (Stylcam 200R, Medelpharm) with data gathering software (Analis, version 2.01, Medelpharm), tablets were made using a flat-faced Euro B punch with 15 mm diameter.
| Code | Metformin | Avicel-102 | L-HPC 21 | Kollidon® VA 64F | Starch 1500 | Primogel® | Magnesium Stearate | Tablet Weight (mg) |
|---|---|---|---|---|---|---|---|---|
| R1 | 500 | 250 | 0 | 0 | 0 | 0 | 5 | 755 |
| R2 | 500 | 375 | 0 | 0 | 0 | 0 | 5 | 880 |
| R3 | 500 | 500 | 0 | 0 | 0 | 0 | 5 | 1005 |
| M1 | 500 | 375 | 0 | 0 | 25 | 0 | 5 | 905 |
| M2 | 500 | 375 | 10 | 0 | 25 | 0 | 5 | 915 |
| M3 | 500 | 375 | 25 | 0 | 25 | 0 | 5 | 930 |
| M4 | 500 | 375 | 50 | 0 | 25 | 0 | 5 | 955 |
| M5 | 500 | 375 | 0 | 10 | 25 | 0 | 5 | 915 |
| M6 | 500 | 375 | 0 | 25 | 25 | 0 | 5 | 930 |
| M7 | 500 | 375 | 0 | 50 | 25 | 0 | 5 | 955 |
| M8 | 500 | 375 | 0 | 50 | 25 | 10 | 5 | 965 |
| M9 | 500 | 375 | 0 | 50 | 0 | 10 | 5 | 940 |
| M10 | 500 | 375 | 25 | 50 | 0 | 0 | 5 | 955 |
| M11 | 500 | 375 | 25 | 50 | 0 | 10 | 5 | 965 |
Note: Formulations codes with ‘R’ are preformulation formulations used to test API to filler ratio compressibility.
Table 1: Formulation composition of Metformin Hydrochloride immediate release tablet.
Evaluation of tablets:
Tensile strength:Tablet hardness was measured using a hardness tester (Erweka TBH 225, Germany). Thickness values were obtained from data produced by the compaction simulator. The tensile strength of each tablet was determined by calculating the values derived from hardness, thickness, and diameter of the tablet. This was done using the equation below.
σX=2F/πDH (1)
Where, X is tensile strength, H is tablet thickness, F is breaking force and D is tablet diameter.
Friability: Friability test was performed using a friability tester (Erweka TA 220, Germany). The ten tablets were randomly selected, dusted, and precisely weighted. Tablets were put inside a friability tester and rotated 100 times (4 mins, 25 rpm). The tablets were reweighed, after carefully removing dust. The weight percentage loss from the tablets was calculated using the equation below[12].
% weight loss=(W1–W2)/W1×100 (2)
Disintegration: Disintegration test was done using a disintegration tester (Erweka ZT 322, Germany). Six tablets were selected randomly for each formulation. Tablets were placed in the disintegration apparatus tubes and immersed in distilled water at 37±2°. Following each tablet's complete disintegration, the disintegration time was logged for each one separately[12].
Dissolution: In vitro drug release study for a selected formulation was performed using the Dissolution tester (Erweka DT 720, Germany), in accordance with United States Pharmacopeia (USP) paddle method (apparatus II)[12]. 1000 ml 6.8 phosphate buffer as dissolution medium, maintained at 370±0.5° at 75 rpm. Samplings were withdrawn at 5, 10, 15, 30, 45, and 60 min. Withdrawn samples were diluted with buffer solution and the absorbance was measured using a Ultraviolet (UV) spectrophotometer (UV- 1800 Shimadzu spectrophotometer, Tokyo, Japan) at 233 nm. The percentage of drug release was calculated and plotted against time (n= 6).
Similarity factor (f2): The In vitro drug release profiles for the optimum formulation and a market product were compared using the f2 equation to determine the similarity factor. The dissolution test for both test samples were done under the same conditions as aforementioned. This was done in accordance with United States Pharmacopeia specifications. The formula for calculating the f2 value is given below.
f2=50.log{[1+1/n Σ n n-1(Rt-Tt)2]-0.5×100} (3)
Mathematical modelling and optimization of experimental data:
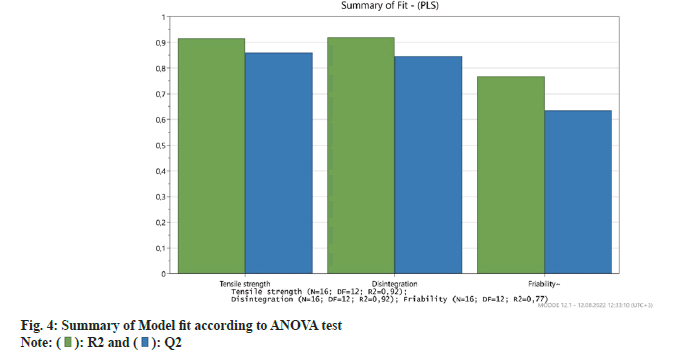
With Modde Pro 12.1 software investigates the multivariate effects between independent variables throughout the formulation and process to describe the response as a function of these variables. The Analysis of Variance (ANOVA) test was used to determine whether the experimental design was valid. ANOVA indicates that a model has a relatively low significance when the R2 (coefficient of determination) is 0.5. To have a significant model and a good model, Q2 (the model's predictive power) should be higher than 0.1 and greater than 0.5, respectively. A decent model should also have an R2 and Q2 difference that is less than 0.3[13]. The factor and response definition for the experimental design are displayed in Table 2.
| Name | Abbr. | Units | Type | Settings | Name | Abbr. | Units | Min | Target | Max |
|---|---|---|---|---|---|---|---|---|---|---|
| Compaction Force | Com | kN | Quantitative | 20-30 | Tensile strength | Ten | Mpa | 1,2 | 1,7 | 2,4 |
| Starch 1500 | Sta | Fraction | Formulation | 0-3 % | Disintegration | Dis | s | 300 | 355 | 420 |
| LHPC 21 | LHP | Fraction | Formulation | 0-6 % | Friability | Fri | % | 0 | 0,6 | 1 |
| Kollidon VA 64F | Kol | Fraction | Formulation | 0-6 % | ||||||
| Primojel® | Pri | Fraction | Formulation | 0-2 % |
Table 2: Defining factors and responses for modelling.
Optimization and design Space:
After modelling the experimental data; Design Space (DS) was formed with the created model. Alternative set points were recommended by the optimizer, and the initial set point was determined according to Defects Per Million Opportunities (DPMO) outside of specification and normalized distance to the target (Log(D)). DS is generated from the chosen initial set point using the find robust' set point function that performs the Monte Carlo simulation (resolution 1 650 000 iterations, and 95 % confidence level)[13,14]. The study used a robust setpoint, an artificial edge point, and the edge of the Normal Operation Range (NOR) in design space to verify the design space.
Results and Discussion
As seen in table 1, different formulation compositions were tested for compressibility at different compression pressure. Results from the study were used for deciding the appropriate API to filler ratio for other formulations (M1 to M11). Metformin tablets was made for only formulation R2, which was selected as the suitable ratio. It is known form literature that metformin HCl has poor compressibility, hence at different API to filler ratios (1:0.5) there was no compressibility seen[15]. Formulation R3 (ratio 1:1) was un-compressible due to high powder bulk which is a limitation for metformin high dose.
Metformin HCl was compressed at different forces (20 kN and 30 kN) for all formulations. Tablet compaction force was set from preformulation study of metformin HCl powder. The relationship between compaction pressure and tensile strength were seen, which is understood to be independently directly proportional[16]. Tensile strength was seen to be increased compaction force. All formulations followed the same trend when tensile strength and compression pressure were taken into considerations as variable and response.
However, with the comparison made between formulations at same compression pressure, there were differences seen in tensile strength. These differences can be attributed to formulation composition and binder amount or type between formulations. Particle size, surface area, and formulation packing ability can have an impact on tensile strength of tablet formulation[17-19].
Results of the quality control tests for all formulations were obtained. An increase in tensile strength was observed with the addition of the binders Kollidon® VA 64 (X1) (2.07, 1.98, and 2.47 Mpa) and L-HPC 21 (X2) (1.26, 1.87, and 1.53 Mpa) at different concentrations (2 %, 5 %, and 10 % respectively). Formulations containing L-HPC 21 showed significant difference (p<0.05) with increase in binder concentration. The highest tensile strength for L-PHC 21 (X2) containing formulations was seen at 5 % binder concentration. Kollidon® VA 64 (X1) showed highest tensile strength at 10 % binder concentration as expected. Given that binder concentrations and tensile strength are proportionally related, increasing the binder will result in harder tablets, as suggested by literature[20]. Tensile strength data can be seen to have improved due to an increase in dependent variable (compaction force)[21]. This is seen in all formulation compressed at two forces (M1 to M6).
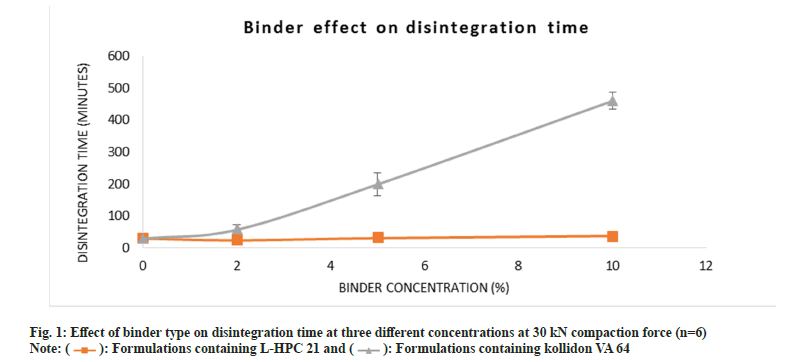
Fig. 1 gives an illustration on the role of binder on disintegration time. L-HPC 21 disintegration time was observed to be faster than Kollidon® VA 64 fine because L-HPC 21 is a dual functional excipient with disintegrant and binder properties[22]. An increase in binder concentration of Kollidon® VA 64 fine was recorded to give a linear increase in disintegration time, the results show a steady pattern as binder concentration increased. This constant increase showed a correlation between tensile strength and disintegration time. As seen in literature, the disintegration time is mostly governed by the tensile strength of the tablet, which increases with an increase in binder concentration[7]. Immediate-release tablets are formulated to completely dissolve and degrade quickly when exposed to physiological fluids (2.5 to 10 min)[23].
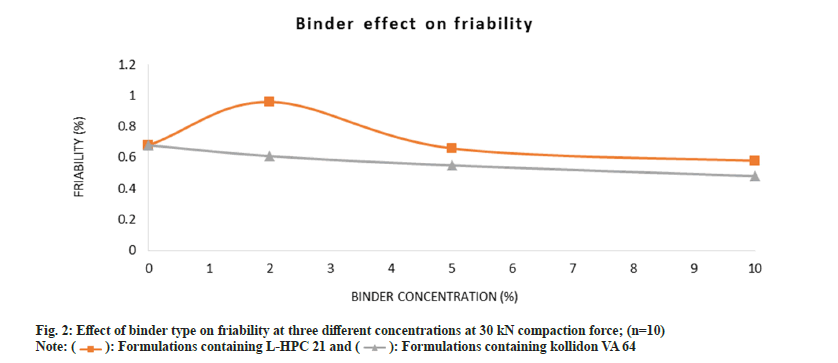
All formulations passed the friability test (<1 %) with exceptions to formulations M1 and M2, when pressed at 20 kN compaction force as seen in Table 4. Fig. 2 shows friability results which are in correlation with the tensile strength. The binder concentration and binder type where all within the acceptable value for friability ˂1 %. However, in comparison to the effect of binder on tablet friability, Kollidon® VA 64 showed improved friability values than L-HPC 21.
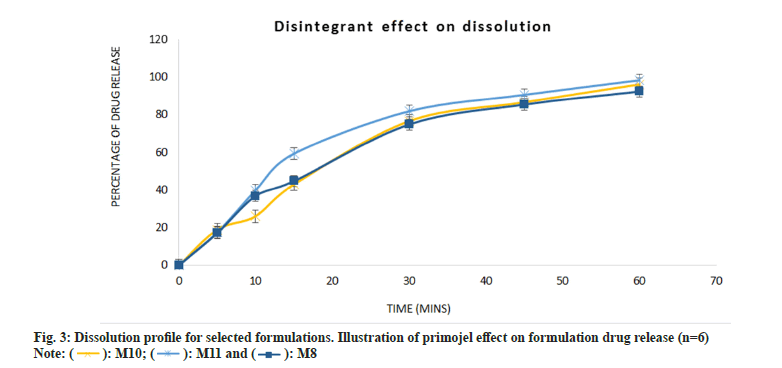
The dissolution profile of selected formulations is illustrated in fig. 3. Starch 1500 (X) and L-HPC 21 (X2) are dual functional excipient with binder and disintegrant effect. The selected formulations had interchangeable variations as seen in Table 1. Formulations M8 and M11 with Starch 1500 and L-HPC 21 (in combination with Primojel® (X3) as super disintegrant) respectively, show a slight difference in percentage of drug release at 30 mins. It is seen that L-HPC 21 by itself (M10) failed to achieve the 80 % drug release required by USP National Formulary monograph. This is also observed in formulation M8 (74.76 %) at 30 min. However, L-HPC 21 gave more promising results in combination with Primojel® (M11), achieving 81.77 % drug release at 30 min. This is expected with the addition of super disintegrant which enhances the drug release rate when added to a formulation[24]. The p value for all selected formulations suggested there was no significant difference (p>0.05) between them. However, the synergic effect of L-HPC 21 and Primojel® (M11) proved to be more effective in comparison to other formulations.
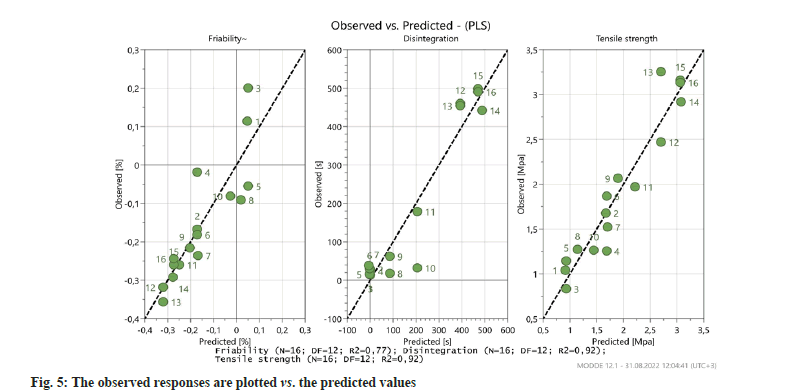
According to the model fit; the higher R2 and Q2 indicate that the function is a suitable fitting of the data and that the predictive ability is high. As seen in fig. 4 and Table 3 the R2 and Q2 values show that a significant mathematical model was formed for each response.
| R2 | R2 Adj. | Q2 | SDY | RSD | N | |
|---|---|---|---|---|---|---|
| Tensile strength | 0,92 | 0,90 | 0,86 | 0,82 | 0,27 | 16 |
| Disintegration | 0,92 | 0,90 | 0,85 | 208,5 | 65,71 | 16 |
| Friability | 0,77 | 0,71 | 0,64 | 0,16 | 0,08 | 16 |
Table 3: List of model fit summary according to anova test
According to PLS modelling results, the observed responses are plotted vs. the predicted values presented in fig. 5. All points would lay on the diagonal line where the observed and predicted values would be equal, even though there is some noise in the data, the model represented by the line does follow the general data as it should.
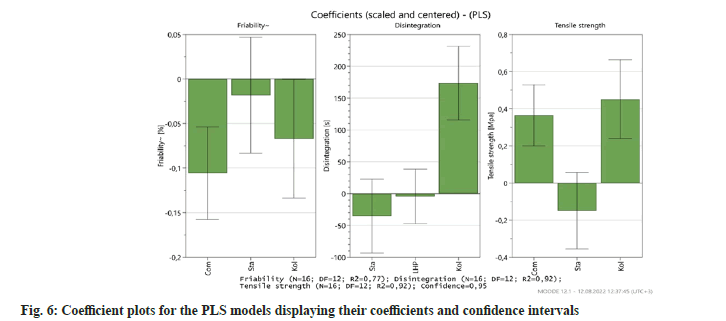
The scaled and centered coefficients of the functions are presented in fig. 6. The coefficient histograms show each variable the model contributes to the resulting responses. The coefficient plot is a graphical depiction of the model terms to ascertain their significance and illustrate the prominence of the impacts of factors on the responses, while their sign indicates a positive or a negative effect on the answer. One that is distant from y=0 and has an uncertainty level that does not cross y=0 is considered to be significant[13].
It can be seen for tensile strength that the most effective variable is the amount of Kollidon® VA 64 used in the formulation, increasing its amount causes higher tensile strength values as well as disintegration time and lower friability. Even Though, uncertainty level extended across y=0 line, the Starch 1500 amount used in the formulation decreases each response. And compression pressure effects on responses were as expected according to the results.
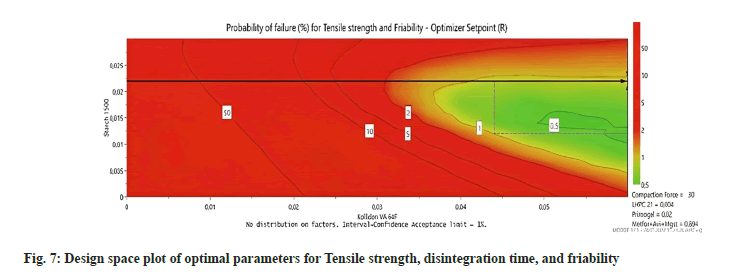
The probability that the response specifications won't be met is depicted in fig. 7 by a color scale. The chance of failure in the green spaces, which are a part of the design space, is less than 1 %. The regions that have a higher probability of failing are shown from yellow to red. The present upper and lower bounds of the formulas' usual working range are depicted by the gray-dashed box. An arrowed cross represents this optimum robust setpoint. In the case of multi-dimensional DS, another way to represent the DS is to describe a hypercube that encapsulates its edges. Table 4 illustrates the setpoint's lowest and highest values, which are the hypercube edges of DS with the standard operating range.
| Opt (g) | Set Point (g) | Low (g) | High (g) | NOR LOW (g) | NOR HIGH (g) | |
|---|---|---|---|---|---|---|
| Starch 1500 | 21,04 | 21,66 | 16,57 | 27,22 | 11,81 | 21,66 |
| LHPC 21 | 2,82 | 3,94 | 0,00 | 8,00 | 0,00 | 5,6 |
| Kollidon VA 64F | 58,16 | 59,06 | 38,28 | 79,84 | 43,31 | 59,06 |
| Primojel® | 19,63 | 19,7 | 16,64 | 22,74 | 19,7 | 19,7 |
| Metformin+Avicel+MgSt | 880 | 880 | 880 | 880 | 880 | 880 |
| Total | 981,7 | 984,4 | 951,5 | 1018 | 954,82 | 1035,54 |
Table 4: The Hypercube Edges of the design space for the responses (Friability, Tensile Strength, and Disintegration Time).
Formulations were prepared in accordance with the test robust setpoint, lowest and highest values of the set point, edge points of the normal operating range, and final product control tests were conducted in which the friability, tensile strength, and disintegration were measured. This was done in order to verify the Design space. All of the results in Table 5 demonstrate that they fall within the quality target product profile-established permissible limits.
| Friability (%) | Disintegration time (sec) | Tensile strength (Mpa) | |
|---|---|---|---|
| Opt (g) | 0.6 | 390 | 2.6953 |
| Set Point (g) | 0.5 | 385 | 2.7444 |
| Low (g) | 0.9 | 184 | 1.5592 |
| High (g) | 0.6 | 317 | 2.0832 |
| NOR LOW (g) | 0.81 | 333 | 1.7036 |
| NOR HIGH (g) | 0.65 | 302 | 1.9922 |
Table 5: Quality test results of formulations to verify design space.
Table 6 illustrates the drug release profile of the optimum formulation in vitro dissolution profile in comparison with the reference product. As seen, data derived from drug release rate showed similarity between optimum formulation and reference product at pH 6.8 buffer solution, with f2 value given as 52.02. However, at pH 4.5 the f2 value just feel short of the 50 requirements for two drugs to be deemed similar. In context, due to the closeness of the f2 value at pH 4.5, given as 49.96 one can presume the two products to be similar by approximation[25]. The results show that the optimized formulation produced by QbD approach had a similar drug release rate as the reference product.
| Time (mins) | pH 6.8 | pH 4.5 | ||
|---|---|---|---|---|
| Opt. | Ref. | Opt. | Ref. | |
| Avg % release | Avg % release | |||
| 5 | 34 | 34 | 25 | 22 |
| 10 | 51 | 62 | 48 | 33 |
| 15 | 82 | 71 | 67 | 41 |
| 30 | 92 | 86 | 88 | 62 |
| 45 | 103 | 90 | 91 | 77 |
| 60 | 93 | 92 | 89 | 93 |
| f2 | 52.02 | 49.96 | ||
Note: Opt: Optimum formulation; Ref: Reference product; f2: Similarity factor; % release rates are given as mean for six samples.
Table 6: Dissolution profile for f2 similarity factor results.
In conclusion, with the utilization of QbD methodology, the evaluation of metformin HCl formulation designed using direct compression was implemented to see the effect of input variables on Critical Quality Attributes (CQA’s). Kollidon® VA 64 showed superior binding characteristics over L-HPC 21, this was made evident via QbD modelling approach. With the addition of Primojel®, L-HPC 21 increased the percent drug release of metformin HCl, indicating that they are complementary for the drug release properties in the formulation. In hindsight, a combination of both binders proved to have a more improved effect on the desired outcome. With the aid of Modde Pro 12.1 (Sartorious, Sweden) software, modeling the experimental design proved that an optimum formulation can be achieved by a validated design space that establishes the limits to get required quality attributes.
Conflict of interests:
The authors declared no conflict of interests.
References
- Maruthur NM, Tseng E, Hutfless S, Wilson LM, Suarez-Cuervo C, Berger Z, et al. Diabetes medications as monotherapy or metformin-based combination therapy for type 2 diabetes: A systematic review and meta-analysis. Ann Intern Med 2016;164(11):740-51.
[Crossref] [Google Scholar] [PubMed]
- Barot BS, Parejiya PB, Patel TM, Parikh RK, Gohel MC. Development of directly compressible metformin hydrochloride by spray drying technique. Acta Pharm 2010;60(2):165-75.
[Crossref] [Google Scholar] [PubMed]
- Barot BS, Parejiya PB, Patel TM, Parikh RK, Gohel MC. Compactibility improvement of metformin hydrochloride by crystallization technique. Adv Powder Technol 2012;23(6):814-23.
- Corti G, Cirri M, Maestrelli F, Mennini N, Mura P. Sustained-release matrix tablets of metformin hydrochloride in combination with triacetyl-β-cyclodextrin. Eur J Pharm Biopharm 2008;68(2):303-9.
[Crossref] [Google Scholar] [PubMed]
- Mattsson S, Nyström C. Evaluation of critical binder properties affecting the compactibility of binary mixtures. Drug Dev Ind Pharm 2001;27(3):181-94.
[Crossref] [Google Scholar] [PubMed]
- Ozalp Y, Jiwa N. The role of compaction simulator equipment in formulation design. Istanbul J Pharm 2021;51(2):277-83.
- Morkhade DM. Comparative impact of different binder addition methods, binders and diluents on resulting granule and tablet attributes via high shear wet granulation. Powder Technol 2017;320:114-24.
- Mattsson S, Nystrom C. Evaluation of strength-enhancing factors of a ductile binder in direct compression of sodium bicarbonate and calcium carbonate powders. Eur J Pharm Sci 2000;10(1):53-66.
[Crossref] [Google Scholar] [PubMed]
- Porfire A, Muntean DM, Rus L, Sylvester B, Tomuta I. A quality by design approach for the development of lyophilized liposomes with simvastatin. Saudi Pharm J 2017;25(7):981-92.
[Crossref] [Google Scholar] [PubMed]
- Güncan G, Yegen G, Mesut B, Aksu B, Ozsoy Y. Formulation design of the oral disintegrating tablets including alfuzosin hydrochloride with risk evaluation via quality by design. Acta Pharm Sci 2017;55(2):1-20.
- Lee YL, Kim MS, Park MY, Han K. Quality by design: Understanding the formulation variables and optimization of metformin hydrochloride 750 mg sustained release tablet by box–Behnken design. J Pharm Investig 2012;42(4):213-20.
- The United States pharmacopeia. The national formulary. Rockville, Md.: United States Pharmacopeial Convention, Inc.; 2023.
- Jiwa N, Ozalp Y, Yegen G, Aksu B. Critical tools in tableting research: Using compaction simulator and Quality by Design (QbD) to evaluate lubricants’ effect in direct compressible formulation. AAPS PharmSciTech 2021;22(4):151.
[Crossref] [Google Scholar] [PubMed]
- Taipale-Kovalainen K, Karttunen AP, Ketolainen J, Korhonen O. Lubricant based determination of design space for continuously manufactured high dose paracetamol tablets. Eur J Pharm Sci 2018;115:1-10.
[Crossref] [Google Scholar] [PubMed]
- Kumar V. Direct compression metformin hydrochloride tablets. United States Patent 6117451 2000.
- Garlapati VK, Roy L. Utilization of response surface methodology for modeling and optimization of tablet compression process. J Young Pharm 2017;9(3):417-21.
- Sebhatu T, Alderborn G. Relationships between the effective interparticulate contact area and the tensile strength of tablets of amorphous and crystalline lactose of varying particle size. Eur J Pharm Sci 1999;8(4):235-42.
[Crossref] [Google Scholar] [PubMed]
- Herting MG, Kleinebudde P. Studies on the reduction of tensile strength of tablets after roll compaction/dry granulation. Eur J Pharm Biopharm 2008;70(1):372-9.
[Crossref] [Google Scholar] [PubMed]
- Khomane KS, More PK, Raghavendra G, Bansal AK. Molecular understanding of the compaction behavior of indomethacin polymorphs. Mol Pharm 2013;10(2):631-9.
[Crossref] [Google Scholar] [PubMed]
- Okoye EI, Onyekweli AO, Ohwoavworhua FO, Kunle OO. Comparative study of some mechanical and release properties of paracetamol tablets formulated with cashew tree gum, povidone and gelatin as binders. Afr J Biotechnol 2009;8(16):1-4.
- Newton JM, Rowley G, Fell JT, Peacock DG, Ridgway K. Computer analysis of the relation between tablet strength and compaction pressure. J Pharm Pharmacol 1971;23(Suppl 1):195S-201S.
[Crossref] [Google Scholar] [PubMed]
- Kleinebudde P. Application of low substituted hydroxypropylcellulose (L-HPC) in the production of pellets using extrusion/spheronization. Int J Pharm 1993;96(1-3):119-28.
- Markl D, Zeitler JA. A review of disintegration mechanisms and measurement techniques. Pharm Res 2017;34(5):890-917.
[Crossref] [Google Scholar] [PubMed]
- Bolhuis GK, Zuurman K, Te Wierik GH. Improvement of dissolution of poorly soluble drugs by solid deposition on a super disintegrant. II. The choice of super disintegrants and effect of granulation. Eur J Pharm Sci 1997;5(2):63-9.
- Shah VP, Tsong Y, Sathe P, Liu JP. In vitro dissolution profile comparison-statistics and analysis of the similarity factor, f2. Pharm Res 1998;15(6):889-96.
[Crossref] [Google Scholar] [PubMed]
 .
.
 .
.
 .
.
 .
.