- *Corresponding Author:
- S. G. Ghane Plant Physiology Laboratory, Department of Botany, Shivaji University, Kolhapur, Maharashtra 416004, India E-mail: sgg.botany@unishivaji.ac.in
| Date of Received | 01 October 2019 |
| Date of Revision | 08 April 2021 |
| Date of Acceptance | 10 July 2021 |
| Indian J Pharm Sci 2021;83(4):679-694 |
This is an open access article distributed under the terms of the Creative Commons Attribution-NonCommercial-ShareAlike 3.0 License, which allows others to remix, tweak, and build upon the work non-commercially, as long as the author is credited and the new creations are licensed under the identical terms
Abstract
The present study was intended to evaluate nutrition and antioxidant potential of four Cucumis species from the Western Ghats of India. All the studied Cucumis species were found to be an excellent source of nutraceuticals. Leaves and fruits of Cucumis indicus were rich source of energy (296.84±0.20 and 333.52±0.15 kcal/100 g respectively) and several minerals. Cucumis maderaspatanus exhibited the highest flavonoids, tannins and terpenoids along with highest antioxidant potential. Chemometric analysis highlighted the influence of phytochemicals on the antioxidant activities from the organic and aqueous solvents extracts of four Cucumis species, wherein organic extracts found superior. Ethanolic leaf and fruit extracts of Cucumis maderaspatanus demonstrated highest alpha-amylase inhibitory activity (58.58±0.63 and 45.43±0.27 % at 1 mg extract). Similar trend was observed for alpha-glucosidase inhibition from the fruit extract of maderaspatanus (74.31±3.75 % at 100 μg extract). Acetone fruit extract of Cucumis indicus revealed the highest acetylcholinesterase inhibitory activity (31.63±0.16 % at 100 μg extract). Further, extensive research work is needed to explore the Cucumis species as functional food to manage diabetes mellitus and Alzheimer’s diseases.
Keywords
Nutraceutical, antioxidant, antidiabetic, acetylcholinesterase, principal component analysis
The information about nutrition, antinutritional factors and bioactive metabolites of biological resources is the most important feature to understand their potential value for the dietary purpose, pharmaceutical and biotechnology industries. Plants are always good source of nutrition and other metabolites with no or lesser side effects. In addition, several studies have been proved that intake of nutritionally rich plant based-diet can reduce the risk of many chronic diseases such as diabetes, obesity, cardiovascular diseases and cancer[1]. Hence, interest has been increased among the researchers to screen health promoting properties of nutritional factors and bioactive metabolites from different plant parts. Consumption of locally grown wild plant has been routinely used by many communities in the world. As compared to Western civilizations, tribal communities are utilizing diverse plant-based diet as a rich source of nutrition. It was revealed that wild plants are vital source of nutrition and several bioactive compounds. Therefore, exploitation of the health- promoting functionalities of locally available, culturally acceptable and economically viable functional food is an urgent need to alleviate malnutrition, hunger and illness within the society[2,3].
Diabetes mellitus (DM) and Alzheimer’s diseases (AD) are the most prevalent diseases all over the world. Recent study diagnosed that around 171 million peoples in the world suffer from diabetes which will progressively increase to 366 million by 2030[4]. Diabetes is a metabolic disorder characterized by hyperglycemia due to the alteration in insulin secretion, insulin action or both. Hyperglycemia could be due to the inappropriate action of α-amylase and α-glucosidase enzymes. Inhibition of these enzymes play key role in controlling the blood sugar level and subsequent disorders[5]. Synthetic drugs available in the market have several side effects. Therefore, in order to address problem associated with diabetes, there is need to search novel bioactive metabolites. Similarly, alteration in chlorogenic system of brain caused neurodegenerative diseases including AD. Decreased level of neurotransmitter ‘acetylcholine’ in the brain caused damage to central cholinergic neurons led to memory loss as well as behavioural and emotional changes. Acetylcholinesterase enzyme (AChE) is the key enzymes responsible for reduction of acetylcholine level in the brain. Several bioactive metabolites such as phenols, flavonoids, alkaloids, terpenes etc. present in the different tissues found responsible for the inhibition of AChE. Therefore, exploration of natural AChE inhibitors is the key step to treat AD[6]. Several researchers proven the antidiabetic potential of various cucurbits including Momordica charantia, Citrullus vulgaris, Cucumbis sativus and Lagenaria siceraria[7]. Shukla et al.[8] also noted the antidiabetic potential of 32 cucurbitaceous plant through in vitro glucose utilization assay. Nagarani et al.[9] revealed the efficiency of Momordica species in the treatment of DM and AD based on α-amylase, α-glucosidase and acetylcholine esterase inhibitory activities. In addition, antidiabetic and anti-Alzheimer potential of Lagenaria siceraria and Diplocyclos palmatus have been also reported[10,11].
The genus Cucumis is one of the economically most important genera’s that include many commonly grown vegetables as well as ornamentals. The genus comprises total 52 species in the world of which 11 species found in India[12]. C. sativus and C. melo are the most widely cultivated vegetables in the world after tomatoes and onions. Extensive work has been done on pharmaceutical aspects of these species[13]. Several studies has been revealed the bioactive metabolites especially cucurbitacins from Cucumis[14]. Cucumis species from India are still unexplored for their nutraceutical potential. Therefore, present study has been undertaken to evaluate nutritional, antinutritional, antioxidants and some important bioactivities such as α-amylase, α-glucosidase and AChE enzyme inhibition of selected Cucumis species.Materials and Methods
Plant materials and processing:
Fresh leaves and fruits of selected genotypes like Cucumis indicus, Cucumis maderaspatanus, Cucumis ritchiei and Cucumis setosus were collected from the Western Ghats, Maharashtra, India during the rainy season in 2017. Plant materials were identified by Dr. M. M. Lekhak (Plant Taxonomist) at Department of Botany, Shivaji University, Kolhapur using available literature. All the specimens were deposited in the Herbarium (SUK) of Shivaji University, Kolhapur. All the collection details along with voucher specimen were depicted in Table 1. The leaves and fruit were stored at -20° and also oven dried at 50° for 72 h. The dried leaves and fruit were powdered using electric mixer grinder.
| S. No. | Species | Locality | Coordinates | Voucher specimen no. |
|---|---|---|---|---|
| 1. | Cucumis indicus | Bhuibavada | N 16°32.982’ E 073° 49.954’ | UAA4 |
| 2. | Cucumis maderaspatanus | Amboli | N 16°10.270’ E 074° 14.736’ | UAA5 |
| 3. | Cucumis ritchiei | Panhala | N 16°48.346’ E 074° 06.515’ | UAA6 |
| 4. | Cucumis setosus | Panhala | N 16°48.350’ E 074° 06.515’ | UAA7 |
Table 1: Collection Details of Selected Cucumis Species
Preparation of extracts:
Leaf and fruit powder (2 g) were extracted with acetone, ethanol, methanol and water using Soxhlet apparatus. All the extracts were evaporated to dry at room temperature and re-dissolved in known volume of respective solvent.
Proximate composition:
Moisture, ash, crude protein, crude fat, crude fibre, carbohydrate, vitamin C and energy value of leaf and fruit were determined by methods of Association of Official Analytical Chemists[15]. Moisture content was calculated by subtracting dry weight (DW) from fresh weight of the sample. Ash content was estimated by incineration at 600±5°. Crude fat was determined by extracting a known weight of sample with petroleum ether using Soxhlet apparatus. Acid and alkaline digestion method was used to estimate crude fibre. Total carotenoids were quantified by method described earlier[16]. Energy values of leaves and fruits were calculated by following equation: Energy (kcal) =(4×g protein)+(4×g carbohydrates)+(9×g fat).
Antinutritional factors:
Antinutritional factors (phytic acid and nitrate content) were examined by using standard protocols[17,18] and expressed in percentage.
Ionomic profiling:
Sample preparation: Acid digested samples were prepared by adapting the method of Toth et al.[19]. The dried sample (1 g) was added to the conical flask containing 10 ml of concentrated HNO3. The mixture was heated on a hot plate until all material was completely digested. After that, 10 ml of perchloric acid was added, mixer was heated till the solution became colourless and concentrated up to 2-3 ml. The mixture was cooled at room temperature, diluted up to 100 ml with distilled water and used for analysis.
Mineral analysis: Total 7 minerals were analyzed by using atomic absorption spectrophotometer (AAS) and flame photometer (FP). Microelement (iron, copper, zinc and manganese) were estimated by using AAS, whereas macroelement (sodium, potassium and calcium) were determined by using FP. Mineral content in the sample was expressed in mg/100 g DW of the sample.
Total phenolics content (TPC), total flavonoids content (TFC), total tannins content (TTC): TPC was determined by Folin-Ciocalteu method with minor modifications[20]. Tannic acid was used as standard and results were expressed as mg tannic acid equivalent (TAE)/g extract. TFC was quantified by following method of Attar and Ghane[2] with some modifications. Catechin was used as standard and results were expressed as mg catechin equivalents (CE)/g extract. TTC was estimated as per Patel et al.[21]. Catechin was used as standard and results were presented as mg CE/g extract.
Total alkaloids content (TAC) and total terpenoid content (TTTC): TAC was estimated by adapting protocol of Ghane et al.[22] and results were expressed as galanthamine equivalent (GE)/g extract. TTTC was quantified as per the method used by Attar and Ghane 2019[10] with minor modifications. TTTC was calculated using ursolic acid calibration curve and results were expressed as mg ursolic acid equivalent (UAE)/g extract.
In vitro antioxidant assay:
2,2-diphenyl-1-picrylhydrazyl (DPPH) radical scavenging activity: DPPH radical scavenging activity was determined according to the method reported by Attar and Ghane[20]. A known volume of extract was added to the 1 ml freshly prepared DPPH solution (0.025 g/l) and incubated for 30 min. The bleaching of DPPH measured spectrophotometrically (Jasco, Japan) at 515 nm. Ascorbic acid was used as standard and activity was expressed as mg ascorbic acid equivalents (AAE)/g extract.
2,2'-azino-bis-3-ethylbenzothiazoline-6-sulfonic acid (ABTS) radical scavenging activity: ABTS radical scavenging activity was performed as per the method published earlier[21]. In brief, a known volume of extract was mixed with 1 ml of ABTS solution and kept at room temperature for 30 min. Inhibition of ABTS radical was measured at 734 nm using a spectrophotometer. Trolox was used as standard and activity was expressed as mg trolox equivalents (TE)/g extract.
Metal chelating activity (MC): The chelation activity towards the Fe2+ was performed as per the method used by Attar et al.[10]. Ethylenediaminetetraacetic acid (EDTA) was used as standard and results were expressed as mg EDTA equivalents (EE)/g extract.
Ferric reducing antioxidant property assay (FRAP): FRAP assay was performed according to the method adopted by Ghane et al.[22]. Aliquots of extract was added to 1 ml FRAP reagent and incubated at 37° for 30 min. After incubation the absorbance was measured at 593 nm. FeSO4.7H2O was used as standard and results were expressed as mg Fe (II) equivalent/g extract.
Phosphomolybdenum reduction assay: Antioxidant activity was studied by using phosphomolybdenum reduction assay[11]. An aliquot of extract was mixed with 1 ml reagent (0.6 M sulfuric acid, 28 mM sodium phosphate and 4 mM ammonium molybdate). The vials were capped and incubated in water bath at 95° for 90 min. After cooling the samples, absorbance was read at 695 nm. Ascorbic acid was used as standard and results were expressed as mg AAE/g extract.
In vitro anti-diabetic assay:
α-Glucosidase inhibition activity: α-Glucosidase inhibition activity was performed using our earlier protocols with some modifications[10]. Aliquot of extract 30 µl (mg/ml) was mixed with 100 µl α-glucosidase solution (unit/ml) and volume made up to 0.5 ml with 0.1 M phosphate buffer (pH 6.9). After preincubation at 25° for 5 min, 100 µl p-nitrophenyl-α-D- glucopyranoside (5 mM) solution was added to it. The reaction mixture was incubated at 25°. The reaction was stopped immediately by adding 1 ml of 0.1 M Na2CO3. Absorbance was measured at 405 nm. The control was prepared as above without any extract. Acarbose was used as a positive control and α-glucosidase inhibition activity was calculated on a percent basis.
α-Amylase inhibition activity: α-Amylase inhibition activity was evaluated by following the method of Attar et al.[10]. An aliquot of extract 100 µl (mg/ml) was mixed with 70 µl enzyme solution (18 units/ml) and volume adjusted to 1 ml with 0.02 M sodium phosphate buffer (pH 6.9). Further, the reaction mixture was incubated at 25° for 10 min. Further, 500 µl starch solution (1 %) was added to the reaction mixture followed by incubation at 25° for 30 min. Post- incubation, reaction was stopped by adding 0.5 ml of dinitrosalicylic acid reagent. The reaction mixture was kept in water bath at 100° for 5 min then allowed to cool at room temperature, diluted (5 fold) with distilled water and measured at 540 nm. Control was prepared as above without any extract and the percent inhibition of α-amylase enzyme was calculated and compared with standard acarbose.
AChE inhibitory activity: AChE inhibitory activity was performed as per the method specified earlier[22]. An aliquot of extract (mg/ml) was added to the 11 µl (0.5 unit/ml) AChE solution and volume made up to 940 µl with 0.1 M phosphate buffer (pH 8.0). The mixture preincubated for 15 min at room temperature followed by adding 30 µl 5, 5-dithiobis-(2-nitrobenzoic acid) (DTNB) (0.5 mM) and 0.71 mM acetylthiocholine iodide. The reaction mixture was kept for 30 min at room temperature and absorbance was taken at 412 nm. The control was prepared as above without any extract and galanthamine hydrobromide was used as a positive control. AChE inhibitory activity was calculated and expressed in percentage.
Statistical analysis:
Results are presented as mean±standard error (SE) of at least three independent replicates. Statistical analyses were performed using analysis of variance (ANOVA) and the significances of the differences between samples were determined using Duncan’s multiple range test (DMRT) using statistical package for the social sciences (SPSS) software ver. 16. Statistical significance was set at a level of p<0.05. For principal component analysis (PCA), data from phytochemicals and antioxidant activities was analyzed using software Minitab ver. 18.
Results and Discussion
Proximate composition of leaf and fruits of Cucumis indicus, C. maderaspatanus, C. ritchiei and C. setosus were depicted in the Table 2. The highest moisture recorded in the fruits of C. ritchiei (88.36±0.25 %) while least was noted in leaves of C.setosus (73.86±0.20 %). It was observed that fruits contain the highest moisture content than leaves. These results in accordance with Attar et al.[2] who reported moisture content from leaf and fruit of Cucumis sativus forma hardwickii. Determination of ash content is an important parameter to index nutraceutical potential. In the present study, wide range of ash content was recorded (6.00 ±0.15-31.50±0.50 %) from the leaves of C. setosus and fruits of C. maderaspatanus. Leaves had high ash content than the fruits; hence, it could be a good source of minerals. These results are in good agreement with the leaf and fruit of Cucumis sativus forma hardwickii[2]. Macromolecules such carbohydrate, protein and fats play an important role in signaling, recognition and adhesion molecules in various physiological process for the normal growth and development. Leaves of C. indicus revealed the highest protein content (47.45±0.23 %) followed by C. maderaspatanus. In the present study, recorded protein value found higher than pumpkin (8.29-12.56 %), Cucumis sativus forma hardwickii (1.77-5.77 %) and Citrullus lanatus (0.34-0.53 %)[2,23,24]. The highest fat content (9.25 ±0.25 %) was found in fruits of C. maderaspatanus while lowest in the leaves C. ritchiei (1.65±0.01 %). In the present study, we noted higher fat content than Citrullus lanatus (0.13-0.21 %)[24]. Fruits of studied Cucumis species had notable fats, hence could be recommended as source of oil. It is well known fact that fat is good source of energy and also assist in transportation of many biomolecules[25]. Total carbohydrates were in the range of 21.36-41.35 %, wherein fruits of C. setosus revealed the highest content followed by C. indicus. These findings are in contrast with Franca et al.[26]. However, we report higher carbohydrate than different parts of pumpkin[27]. The highest crude fibre content was recorded in fruits of C. ritchiei (45.61±0.28 %) while lowest in the leaves of C. maderaspatanus (10.05 ±0.15 %). Similar trend was noted in Cucumis sativus forma hardwickii and Cucurbita maxima[2,27]. We report, higher crude fibre content than various cucurbits[24,28]. It is proved that fibre is the most crucial in human nutrition and play vital role in enhancing digestibility, lowering blood cholesterol and blood sugar. In addition, it also reduces the risk of diseases such as hypertension, obesity, diabetes and gastro intestinal disorders[29]. Among the tested Cucumis species, high energy value was noted from the fruits of C. indicus (333.52 ±0.15 kcal/100 g). Similar trend was noted in the leaf (263.46 kcal/100 g) and fruits (237.41 kcal/100 g) of C. sativus forma hardwickii[2]. In contrast, different energy values from Citrullus lanatus and pumpkin seeds have been reported earlier[24,30]. Carotenoids are the potent radical scavenger in biological system and reduces risk of various degenerative diseases like cardiovascular, cataract, cancer and diabetes[31]. Total carotenoids were recorded that ranged from 3.80 ±0.23 to 277.23±0.12 mg/100 g; wherein, highest content was recorded in the leaves of C. setosus (277.23 ±0.12 mg/100 g). Our results showed the highest carotenoid content than gourd vegetables[32]. Vitamins are the biomolecules required in trace amount for various biological processes. Vitamin C is a potent antioxidant molecule that prevents various oxidative stress related diseases[33]. The study exhibited considerable range of vitamin C (30.86±2.25-1100±0.79 mg/100 g DW) from all the tested species. Maximum and minimum vitamin C content recorded in fruits and leaves of C. maderaspatanus and C. setosus, respectively. Blessing et al.[23] reported considerable vitamin C content (0.701-3.473 mg/100 g) from 10 pumpkin accessions. In contrast, Attar et al.[2] and Amin et al.[27] reported least vitamin C content from pumpkin and wild progenitor of cucumber.
| Proximate analysis | C. indicus | C. maderaspatanus | C. ritchiei | C. setosus | ||||||||
|---|---|---|---|---|---|---|---|---|---|---|---|---|
| Leaf | Fruit | Leaf | Fruit | Leaf | Fruit | Leaf | Fruit | |||||
| Moisture (%) | 81.94±0.56d | 92.26±0.37a | 77.00±0.06f | 80.00±0.01e | 74.58±0.10g | 88.36±0.25b | 73.86±0.20h | 85.94±0.15c | ||||
| Ash (%) | 15.35±0.15d | 12.20±0.20f | 20.00±0.05c | 06.00±0.15h | 23.30±0.25b | 9.60±0.43g | 31.50±0.50a | 13.05±0.30e | ||||
| Carbohydrate (%) | 21.36±0.10h | 41.22±0.20f | 27.70±0.20b | 24.45±0.22a | 34.27±0.10e | 34.69±0.35d | 28.92±0.15g | 41.35±0.25c | ||||
| Crude protein (%) | 47.45±0.23a | 26.41±0.29d | 39.00±0.72b | 27.00±0.08c | 7.85±0.13a | 8.00±0.33f | 8.10±0.24f | 10.53±0.52e | ||||
| Crude fat (%) | 2.40±0.10e | 7.00±0.10b | 03.25±0.25d | 09.25±0.25a | 1.65±0.01h | 2.10±0.05f | 1.85±0.04g | 4.40±0.01c | ||||
| Crude fibre (%) | 13.44±0.43f | 13.17±0.66g | 10.05±0.15h | 33.30±1.06b | 32.92±3.0c | 45.61±0.28a | 29.62±1.37e | 30.66±0.11d | ||||
| Energy value (kcal/100 g) | 296.84±0.20a | 333.52±0.15c | 296± 0.50b | 289±0.80d | 183.33±1.0g | 189.66±0.90f | 164.73±2.0h | 247.12±0.50e | ||||
| Vitamin C (mg/100 g) | 329.48±6.01d | 540.04±8.61c | 942±4.43b | 1100±0.79a | 57.69±6.58g | 105.12±9.51f | 30.86±2.25h | 277.10±17.38e | ||||
| Carotenoids (mg/100 g) | 191.67±0.10d | 118.54±0.23e | 248.18±0.20b | 11.78±0.68g | 244.37±0.83c | 3.80±0.23h | 277.23±0.12a | 15.51±0.06f | ||||
| Antinutritional factors | ||||||||||||
| Phytic acid (%) | 2.26±0.04b | 1.53±0.03c | 3.17±0.07d | 2.32±0.05a | 0.40±0.05h | 0.97±0.01f | 0.89±0.03g | 1.11±0.03e | ||||
| Nitrate (%) | 0.20±0.006c | 0.14±0.01e | 0.79±0.01a | 0.19±0.01d | 0.0410.007g | 0.005±0.001h | 0.26±0.005b | 0.080±0.009f | ||||
All values are means of triplicate determination expressed on DW basis±SE (N=3, p˂0.05). Mean values with different alphabets in the same row showed statistically significant differences (p˂0.05) according to DMRT
Table 2: Proximate Composition and Antinutritional Factors of C. Indicus, C. Maderaspatanus, C. Ritchiei and C. Setosus
It was observed that leaves and fruits showed significant differences in all the tested parameters (p<0.05) except protein content from C. ritchiei. C. setosus found to be rich in ash, carbohydrate and carotenoids; while, C. maderaspatanus ranked at the top due to its high fat and vitamin C content. Similarly, C. ritchiei distinguished from other species due to high fibre content. Similarly, C. indicus was highlighted due to the elevated protein content and energy values. In addition, an importance of C. indicus and C. setosus have been supported by previous researchers[34,35]. The present study assisted us to distinguish nutritive value of this rare, endemic and underutilized wild species of Cucumis that could contributed to the nutrients, energy requirement for humans and animal through biofortification.
The antinutritional factors produced naturally as a part of normal metabolism. These compounds exert adverse effect due to reduction in the intake, digestion, absorption, utilization of various nutrients in the human and animals[36]. Wild plants are well known for their potential source of nutrients but due to the anti-nutrients led to cause serious health problems[37]. Therefore, screening of antinutritional factors is an essential step to decide edibleness of these wild resources. In the present study, antinutritional factors such as phytic acid and nitrate were analyzed and results are depicted in Table 2. The highest and lowest phytic acid content was noted in the leaf of C. maderaspatanus and C. ritchiei, respectively. Phytic acid was found higher when compared with Cucurbita pepo and C. sativus forma hardwickii[2,30]. Similarly, nitrate content was recorded in the range from 0.005 to 0.79 %. The highest (0.79 %) and lowest (0.005 %) nitrate content was recorded in C. maderaspatanus leaf and C. ritchiei fruit, respectively. Higher nitrate content in the food can lead to a disease called methemoglobianaemia. Elinge et al.[30] recorded comparatively higher nitrate content in the pumpkin seeds than our calculated value. Similar trend was noted from the wild progenitor of cucumber[2]. In present work, significant variations (p<0.05) were found in proximate composition and antinutritional factors for all tested Cucumis species. Such variation could be attributed to the interspecies variability, ecological factors, harvesting place, time and method of extraction of biomolecules[38].
Ionomic profile of C. indicus, C. maderaspatanus, C. ritchiei and C. setosus was studied and results are presented in Table 3. The significant variations were recorded in the macro (sodium, potassium, calcium) and micro elements (iron, copper, zinc and manganese) from the leaf and fruits. In mineral analysis, Na was recorded highest in C. indicus fruit (45.6 mg /100 g). Leaves and fruits of C. ritchiei and C. setosus revealed considerable Na content while least content was recorded in C. maderaspatanus. These results are in good agreement with Amin et al.[27]. However, Elinge et al.[30] also reported higher Na content (170 mg /100 g) from the pumpkin seeds. Na is an essential to regulate blood pressure, blood volume and functioning of the muscles and nerves. Similarly, highest Ca was recorded from the leaves of C. setosus (3200 mg /100 g) followed by C. indicus, C. maderaspatanus and C. ritchiei. Among the fruits, C. ritchiei and C. setosus revealed with highest Ca (800 mg/100 g) but least content was noted in C. maderaspatanus (240 mg/100 g). It was observed that leaves were rich source of Ca than the fruits. In contrast, least Ca content have been reported from Cucumis sativus, Citrullus lanatus, Cucurbita maxima and Luffa cylindrica[24,27,28]. Chandran et al.[39] and Nivedhini et al.[40] reported high Ca content from the C. dipsaceus. Calcium play an important role in normal growth and development like strengthening of bone, teeth and muscles. Similarly, K was abundant in fruits of C. setosus (1600 mg /100 g) and least in leaves of C. indicus. Interestingly, leaf and fruit of same species had similar K content except C. indicus. Similar trend was observed in Cucurbita maxima[27]. All the species under investigation showed high Ca and K; wherein, Ca was identified as the most predominant among all other macroelements. Similarly, highest Fe (1.22 mg/100 g) was reported from C. setosus leaves followed by fruits of C. indicus. Cu (0.041 mg/100 g) and Zn (0.054 mg/100 g) were recorded higher from the leaves of C. indicus. Similarly, maximum Mn (0.088 mg/100 g) was recorded in the fruits of C. indicus. Considerable differences were recorded for Fe (0.13-1.22 mg/100 g), Cu (0.022-0.041 mg /100 g), Zn (0.027-0.054 mg/100 g) and Mn (0.035-0.088 mg/100 g). Similar observations have been reported by earlier researchers from various cucurbits such as Cucumis sativus, Citrullus lanatus, Cucurbita maxima and Luffa cylindrica[24,27,28,39,40]. Significant variation in ion profile could be due to the climate, species, soil type, water and several ecogeographical factors[41]. These minerals have vital role in several physiological processes for normal growth and development. Among the microelements, Fe was found abundant in all the Cucumis taxa. When compared to fruit, leaves noted as an appreciable source of microelements such as Fe, Cu, Zn and Mn. In addition, C. indicus and C. setosus had an excellent ionomic profile while C. ritchiei had considerable minerals that could be recommended as a dietary supplement to alleviate mineral deficiency diseases from the society.
| Species | Plant part | Na | Ca | K | Fe | Cu | Zn | Mn |
|---|---|---|---|---|---|---|---|---|
| C. maderaspatanus | Leaf | 12 | 2320 | 696 | 0.96 | 0.024 | 0.030 | 0.070 |
| Fruit | 9.6 | 240 | 624 | 0.13 | 0.022 | 0.028 | 0.035 | |
| C. indicus | Leaf | 24 | 2480 | 336 | 0.23 | 0.041 | 0.054 | 0.021 |
| Fruit | 45.6 | 400 | 960 | 1.18 | 0.028 | 0.047 | 0.088 | |
| C. ritchiei | Leaf | 16.8 | 2080 | 696 | 0.96 | 0.026 | 0.031 | 0.062 |
| Fruit | 13.6 | 800 | 624 | 0.18 | 0.026 | 0.034 | 0.035 | |
| C. setosus | Leaf | 15.2 | 3200 | 1580 | 1.22 | 0.034 | 0.037 | 0.063 |
| Fruit | 24.8 | 800 | 1600 | 0.15 | 0.035 | 0.027 | 0.041 |
Values (mg/100 g) are means of triplicate determination expressed on DW basis±SE (N=3, p˂0.05)
Table 3: Mineral Profiling of C. Indicus, C. Maderaspatanus, C. Ritchiei and C.Setosus
Phytochemicals (TPC, TFC and TTC) were studied from the different plant parts extracted with various solvents and results are depicted in Table 4. Significant differences (p<0.05) were recorded in terms of TPC, TFC and TTC from different plants parts and extract studied. Phenolic compounds are the diverse group of secondary metabolites categorized in several sub groups like flavonoids, flavonons and tannins. These phenolics demonstrated wide biological activities including antioxidants that prevent many chronic diseases like arteriosclerosis, cancer and cardiovascular disorders[2,20,21]. Therefore, determination of TPC, TFC and TTC is an important aspect to assess the biological potential of the extracts. Level of TPC was varied for C. indicus (21.73±0.10-36.44±1.18), C. maderaspatanus (20.59±0.24-50.79±0.19), C. ritchiei (29.77±2.00- 64.33±2.07) and C. setosus (29.41±3.88-68.82±3.99). Acetone leaf extract of C. setosus showed the highest TPC (68.82±3.99 mg TAE/g extract); while, least was found in acetone fruit extract of C. maderaspatanus (20.59±0.24 mg TAE/g extract). However, among the solvent extracts of same species, C. indicus aqueous fruit extract, C. ritchiei methanolic fruit extract and C. maderaspatanus, C. setosus acetone leaf extract were registered with higher level of TPC. Similarly, between plant parts studied, fruit of C. indicus and C. ritchiei and leaves of C. maderaspatanus and C. setosus revealed appreciable TPC. In addition, polar solvents (methanol and water) found superior for the extraction of TPC from C. indicus and C. ritchiei. However, leaf and fruits of C. maderaspatanus and C. setosus showed substantial TPC when extracted with less polar solvent i.e. acetone. These findings are in lined with the phenolics content observed in gourd vegetables[32]. In contrast, least TPC was reported from Cucumis dipsaceus[39].
| Test | Leaf extract | Fruit extract | ||||||||||||||||||||||
|---|---|---|---|---|---|---|---|---|---|---|---|---|---|---|---|---|---|---|---|---|---|---|---|---|
| Acetone | Ethanol | Methanol | Aqueous | Acetone | Ethanol | Methanol | Aqueous | |||||||||||||||||
| Cucumis indicus | ||||||||||||||||||||||||
| TPC1 | 21.73±0.10f | 24.43±0.14e | 33.20±0.61b | 27.20±0.57d | 25.62±0.85d | 28.32±0.29c | 29.06±0.18c | 36.44±1.18a | ||||||||||||||||
| TFC2 | 4.57±0.05f | 18.74±0.35a | 17.07±0.50b | 1.20±0.09g | 9.95±0.52e | 14.16±0.70c | 11.90±0.16d | 2.17±0.26g | ||||||||||||||||
| TTC2 | 33.23±1.23c | 21.11±1.45e | 5.77±0.33f | 0.72±0.11g | 122.02±1.90b | 174.95±0.51a | 26.27±0.49d | 6.08±0.29f | ||||||||||||||||
| TTTC3 | 241.32±3.97b | 32.09±2.81d | 47.40±5.84e | 6.43±0.43g | 532.39±2.11a | 502.08±20.28c | 32.94±0.38f | 10.31±0.32g | ||||||||||||||||
| TAC4 | 13.30±1.66a | 1.89±0.12e | 4.76±0.14c | 2.50±0.61d | 7.46±0.77b | 6.63±0.37b | 1.33±0.04e | 2.86±0.14d | ||||||||||||||||
| Cucumis maderaspatanus | ||||||||||||||||||||||||
| TPC1 | 50.79±0.19a | 32.59±0.71d | 28.74±0.74e | 43.48±0.71b | 20.59±0.24f | 40.75±0.67c | 32.48±0.25d | 28.70±0.57e | ||||||||||||||||
| TFC2 | 90.89±3.98a | 52.12±1.73c | 34.22±2.93d | 19.36±0.54f | 65.88±1.57b | 23.04±0.70f | 30.25±4.09e | 11.37±0.52g | ||||||||||||||||
| TTC2 | 338.02±13.74b | 10.38±1.57g | 12.45±1.21f | 14.24±1.85e | 449.57±4.72a | 15.71±1.18e | 28.07±0.37d | 52.12±2.43c | ||||||||||||||||
| TTTC3 | 339.77±1.01a | 41.95±0.91c | 63.48±0.99d | 22.16±1.09f | 585.90±1.00b | 167.80±0.99d | 70.37±1.03e | 25.20±0.94f | ||||||||||||||||
| TAC4 | 15.35±1.92b | 9.54±0.58c | 8.76±0.25c | 1.94±0.48f | 3.98±0.41e | 18.53±1.04a | 3.18±0.09e | 4.79±0.23d | ||||||||||||||||
| Cucumis ritchiei | ||||||||||||||||||||||||
| TPC1 | 56.10±3.22b | 29.77±2.00d | 45.85±2.48c | 58.20±0.18ab | 44.28±1.87c | 27.83±2.91d | 64.33±2.07a | 45.40±0.24c | ||||||||||||||||
| TFC2 | 33.42±1.57c | 51.31±1.01a | 30.44±0.30c | 16.91±0.16d | 41.22±0.45b | 41.26±1.72b | 41.25±1.24b | 13.71±0.37e | ||||||||||||||||
| TTC2 | 281.42±1.93a | 221.59±3.87b | 51.33±1.56e | 31.51±0.38f | 99.74±1.36c | 71.05±1.10 | 76.59±8.92d | 27.13±1.39f | ||||||||||||||||
| TTTC3 | 211.55±10.3a | 31.87±7.46c | 31.38±3.99f | 2.75±0.36g | 487.89±15.89b | 171.97±5.92d | 57.51±1.60e | 10.57±0.41g | ||||||||||||||||
| TAC4 | 3.24±0.42d | 11.78±0.60bc | 9.36±2.08c | 2.00±0.31d | 15.57±0.64b | 15.99±1.78b | 29.06±2.49a | 2.56±0.32d | ||||||||||||||||
| Cucumis setosus | ||||||||||||||||||||||||
| TPC1 | 68.82±3.99a | 37.66±2.24bc | 65.27±4.17a | 61.03±1.12a | 67.50±1.16a | 45.51±3.88b | 29.41±3.88c | 36.78±1.01bc | ||||||||||||||||
| TFC2 | 62.87±0.36a | 56.20±1.31b | 41.42±0.74c | 18.07±1.61e | 35.83±0.36d | 9.90±0.68f | 5.64±0.13g | 3.65±0.06h | ||||||||||||||||
| TTC2 | 291.60±15.71a | 224.26±5.04b | 113.77±0.35d | 32.43±1.68e | 158.58±2.74c | 5.92±0.18f | 6.28±0.35f | 9.28±0.32f | ||||||||||||||||
| TTTC3 | 103.42±9.90a | 28.10±9.87c | 19.55±3.39e | 5.42±0.43fg | 254.56±6.42b | 146.56±1.39d | 28.38±0.83f | 8.89±0.20g | ||||||||||||||||
| TAC4 | 21.86±0.95a | 2.06±0.99c | 2.20±0.31c | 1.45±0.34c | 11.27±2.83b | 2.60±0.86c | 2.08±0.26c | 1.01±0.07c | ||||||||||||||||
1mg tannic acid equivalent (TAE)/g extract, 2mg catechin equivalent (CE)/g extract, 3mg ursolic acid equivalent (UAE)/g extract, 4mg galanthamine equivalent (GE)/g extract. Values were the means of three replicates±SE (N=3, p˂0.05). Mean value with different alphabets in same row showed statistically significant differences (p˂0.05) according to DMRT
Table 4: TPC, TFC, TTC, TTTC and TAC Analysis in Leaf and Fruit of C. Indicus, C. Maderaspatanus, C. Ritchieiand C. Setosus
Flavonoids are one of the most important natural antioxidant compounds that exhibit several biological activities[42]. Among all the tested extracts, highest (90.89±3.98 mg CE/g extract) and lowest (18.74±0.35 mg CE/g extract) TFC were reported from the acetone leaf extract of C. maderaspatanus and ethanol leaf extract of C. indicus, respectively. Ethanol was found to be the excellent solvent for the extraction TFC from C. indicus and C. ritchiei. Leaf tissue showed comparatively highest TFC than the fruits. Similar trend was observed in Lagenaria siceraria, Cucumis sativus forma hardwickii and Momordica species[2,9,21].
Tannins are well recognized group of polyphenols having chain-breaking antioxidant activities and also believed to prevent many degenerative diseases[43]. In the present study, all the extracts contained considerable levels of extractable tannins (TTC) that ranged from 0.72 ±0.11-174.95±0.51 mg CE/g extract (C. indicus), 10.38±1.57-449.57±4.72 mg CE/g extract (C. maderaspatanus), 27.13±1.39-281.42±1.93 mg CE/g extract (C. ritchiei) and 5.92±0.18-291.60 ±15.71 mg CE/g extract (C. setosus). Acetone fruit extract of C. maderaspatanus had relatively higher TTC (449.57±4.72 mg CE/g extract) while least content was observed in aqueous leaf extract of C. indicus (0.72±0.11 mg CE/g extract). Acetone extraction revealed the highest recovery of tannins followed by ethanol. In the present study, higher tannin content was found in the studied taxa when compared with C. dipsaceus, Diplocyclos palmatus, Cucumis sativus forma hardwickii and Lagenaria siceraria[2,20,21,40].
Alkaloids are wide spread group of chemical compounds that exhibit antitumor, anti-malarial, AChE inhibitory activities[44]. In the present investigation, TAC was dependent on taxa, plant parts and solvent used. Significantly, highest TAC was found in methanol fruit extract of C. ritchiei (29.06±2.49 mg GE/g extract) and lowest from the aqueous fruit extract of C. setosus (1.01±0.07 mg GE/g extract) (Table 4). Organic solvent particularly acetone showed superior responses for alkaloid extraction from C. indicus, C. setosus and C. maderaspatanus. Our findings are in contrast with Shamsa et al.[45].
Similarly, terpenoids play important role in defense mechanism against biotic and abiotic stresses and also used as signalling molecules in pollination. In addition, it also exhibit several biological activities[46]. In the present investigation, highest TTTC was observed in acetone fruit extract of C. maderaspatanus (585.90 ±1.0 mg UAE/g extract) and least in aqueous leaf extract of C. ritchiei (6.43±0.43 mg UAE/g extract) (Table 4). Acetone noted as a superior solvent for the efficient extraction of TTTC from leaves and fruits of all the tested Cucumis taxa. Similar result have been noted in Diplocyclos palamatus and Lagenaria siceraria[10,20].
In the present study, performance of selected solvents and tissue used for the extraction of various phytochemicals (TPC, TFC, TTC, TTTC and TAC) was varied. Among the polar solvents, methanol and ethanol found to be the best for extraction of phytochemicals (TPC, TFC) from C. indicus and C. ritchiei. However, acetone was the most suitable for maximizing recovery of TPC and TFC from C. maderaspatanus and C. setosus. Tannins and terpenoids were recovered efficiently with acetone from all the taxa. Therefore, it was quite difficult to decide single solvent that efficiently extracted all the tested phytochemicals viz. TPC, TFC, TTC, TTTC and TAC. These observations are strongly supported by previous studies[2,10,20,21].
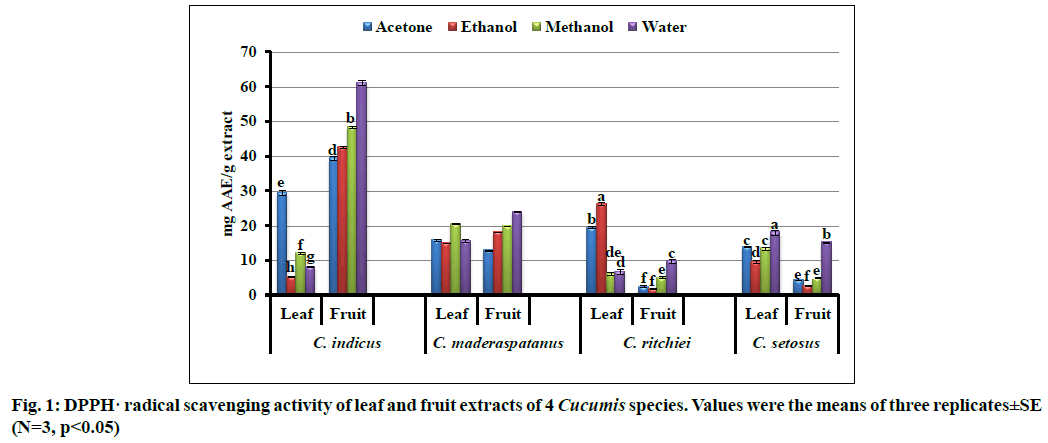
The assay of DPPH radical scavenging activity is simple, fast and reliable method for determination of antioxidant potential of plant sample. In the present study, DPPH radical scavenging activity was solvent and tissue dependent (fig. 1). The highest radical scavenging activity was shown by aqueous fruit extract of C. indicus (61.00±0.76 mg AAE/g extract) followed by methanol, ethanol and acetone fruit extract of C. indicus. Aqueous fruit extracts of all the Cucumis taxa exhibited appreciable radical scavenging activity. Similar results have been recorded from aqueous extract of Lagenaria siceraria, Luffa cylindrica and C. maxima[47]. Efficient radical scavenging potential of selected gourd vegetables have been also reported[32].
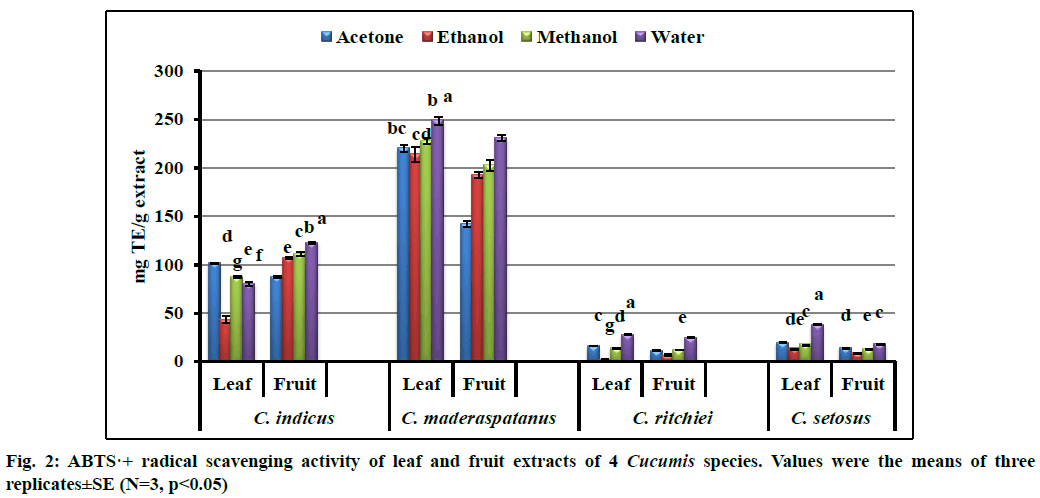
ABTS radical scavenging activity was studied and results are expressed in mg TE/g extract (fig. 2). Aqueous extracts of leaf and fruit revealed strong ABTS radical scavenging activity. Among the plant parts, leaves showed strong radical scavenging activity than the fruit. The highest and lowest activity was recorded in aqueous leaf extract of C. maderaspatanus (249.28±4.17 mg TE/g extract) and ethanol leaf extract of C. ritchiei (2.20±0.16 mg TE/g extract), respectively. It was noted that C. maderaspatanus had strong activity than the other tested taxa. These findings are similar with the precedent reports from C. dipsaceus, Diplocyclos palamatus and Lagenaria siceraria[20,21,40].
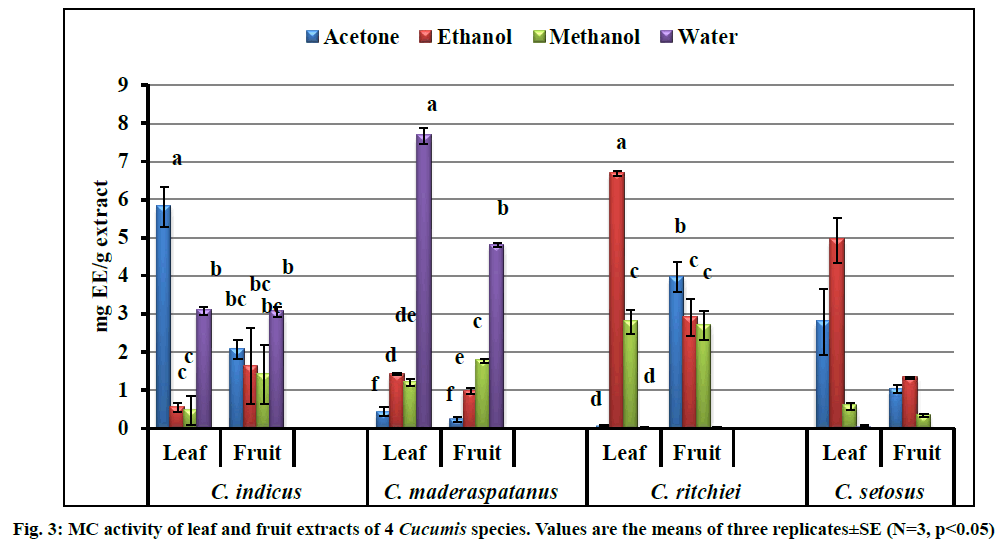
Ability of all the extracts to chelate Fe2+ was estimated and results are expressed in mg EDTA equivalent/g extract (fig. 3). Antioxidant molecules from the extract attached to Fe2+ ion that catalyzed oxidation reaction and subsequently prevent the formation of the red colour complex Fe(II)-ferrozine. The highest metal chelation properties were shown by aqueous leaf extract of C. maderaspatanus (7.67±0.20 mg EE/g extract)>ethanol leaf extract of C. ritchiei (6.68±0.07 mg EE/g extract)>C. setosus (4.94±0.59 mg EE/g extract). Among the solvents studied, water performed better for extraction of antioxidant molecules from C. maderaspatanus and C. indicus. However, ethanol was the best solvent for promising MC activity in C. ritchiei and C. setosus. Leaves showed significant metal chelating properties due to the presence of antioxidant molecules. These findings are in lined with earlier reports[10,20,21].
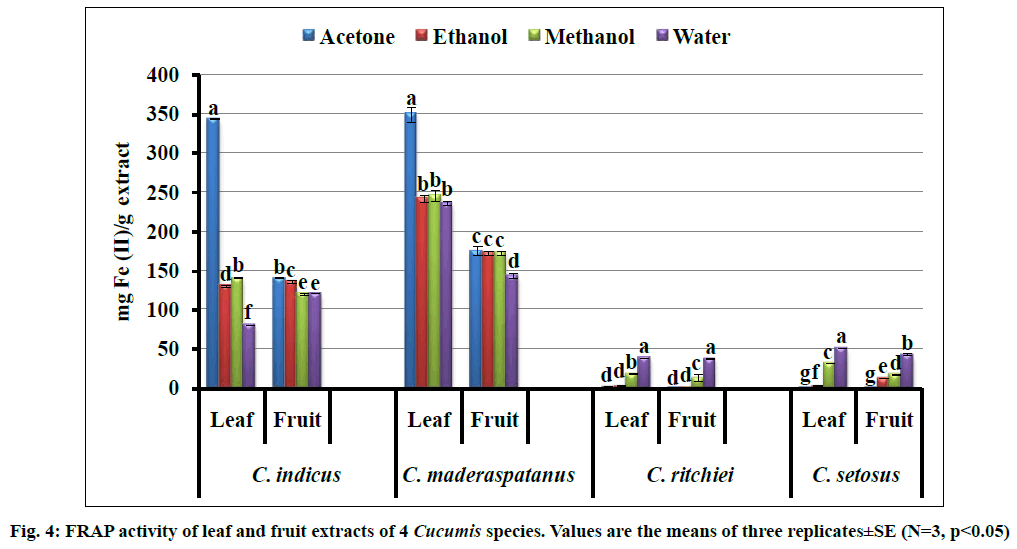
FRAP assay is based on the measurement of the reducing potential of antioxidant molecules reacting with a ferric tripyridyltriazine (Fe3+-TPTZ) complex and producing a colored ferrous tripyridyltriazine (Fe2+-TPTZ) complex. Reducing potential of extract is directly related to presence of antioxidant compounds which exert their action through scavenging of free radical. The highest reducing potential was shared by acetone and water extracts, wherein acetone leaf extract of C. maderaspatanus (350.09±8.95 mg Fe(II)/g extract) demonstrated highest reducing potential followed by acetone leaf extract of Cucumis indicus (fig. 4). The least activity was comprised by acetone fruit extract of C. ritchiei and remaining taxa (C. setosus, C. indicus and C. maderaspatanus) demonstrated appreciable reducing potential with acetone extract. The efficient reducing properties have been also reported from Diplocyclos palmatus, Cucumis sativus forma hardwickii, Lagenaria siceraria and Momordica species [2,9,10,20,21].
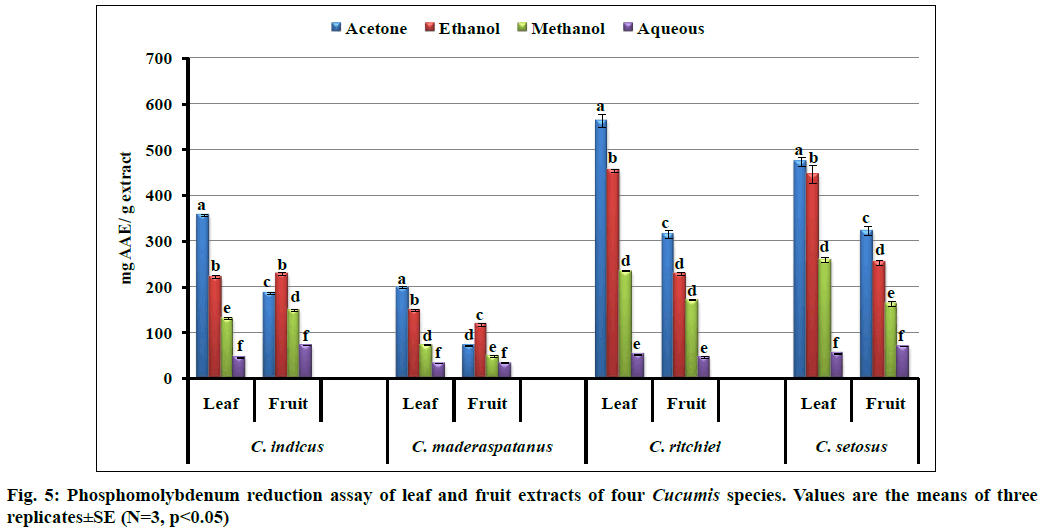
In phosphomolybdenum reduction assay the antioxidant potential of extract was evaluated and results are expressed in mg AAE/g extract (fig. 5). Assay is based on the reduction of molybdenum (Mo) (Mo VI to Mo V) by antioxidants present in extract and subsequent formation of a green color phosphate- Mo (V) complex. Promising antioxidant potential was recorded in acetone extract followed by ethanol. In the study, significant variations (p<0.05) were observed in all tested solvents and plant parts wherein acetone leaf extract of C. ritchiei (563.56±14.60 mg AAE/g extract) exhibited highest activity followed by C. setosus, C. indicus and C. maderaspatanus. Our study also supported by precedent reports from Diplocyclos palmatus, Cucumis sativus forma hardwickii and Lagenaria siceraria[2,10,20,21].
From the present investigation, we observed that acetone and water revealed significantly highest antioxidants coupled with higher antioxidant activities. However, leaves of all the tested Cucumis taxa proved to be the excellent source of natural antioxidants. Besides, C. maderaspatanus was noted with the highest antioxidant activities. Several reports pointed out that bioactive profile of plant sample has been largely affected by soil, environmental conditions, genotype, agronomic practices, harvesting and post-harvest practices. Instead of this, selection of plant part, solvent, method of extraction also affects the recovery of bioactive metabolites[10,48].
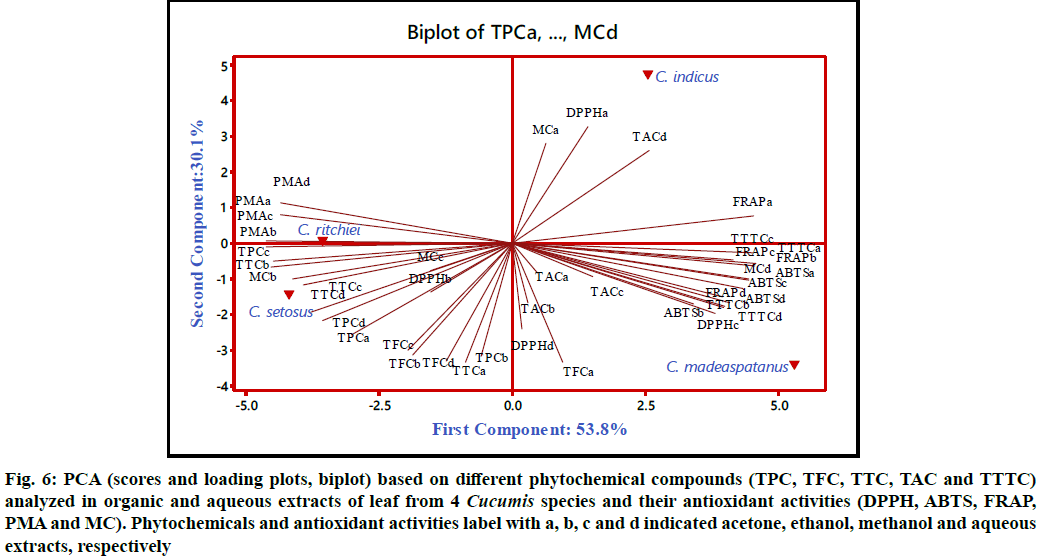
All the variables derived from leaves were subjected to PCA and association between phytochemicals (TPC, TFC, TTC, TTTC and TAC) and antioxidant activities (DPPH, ABTS, MC, FRAP, phosphomolybdate assay (PMA)) was studied (fig. 6). All the solvents used viz. acetone, ethanol, methanol and water were labelled as a, b, c and d respectively. The loading plots, score plots and percentage of variance of first two components from all the leaf parameters were taken into consideration, which contributed 83.9 % of total variance. The first principal component (PC) accounted 53.8 % variability and represented positive load of variables viz. TTTC (a-d), TAC (a-d), FRAP (a-d), ABTS (a-d), DPPH (c, d) and MC (a, d). Similarly, second component contributed 30.1 % variability along with positive load of variables viz. TAC (d), MC (a) DPPH (a). However, variables like TPC (a-d), TTC (a-d), TFC (c-d), DPPH (b) and MC (b,c) were positioned at negative quadrant of both PC1 and PC2. PCA of leaves distinguished the Cucumis taxa into two groups based on their position on loading plot. Group one include C. maderaspatanus and C. indicus which positioned at positive quadrant of PC1 and PC2. C. maderaspatanus characterized by higher TTTC and TAC which exhibited correlation with higher FRAP, ABTS and DPPH. However, second group includes C. setosus and C. ritchiei which positioned at negative quadrant of PC1 and PC2. Further, C. setosus was characterized by elevated level of TPC, TTC and TFC which showed positive correlation PMA.
Figure 6: PCA (scores and loading plots, biplot) based on different phytochemical compounds (TPC, TFC, TTC, TAC and TTTC) analyzed in organic and aqueous extracts of leaf from 4 Cucumis species and their antioxidant activities (DPPH, ABTS, FRAP, PMA and MC). Phytochemicals and antioxidant activities label with a, b, c and d indicated acetone, ethanol, methanol and aqueous extracts, respectively
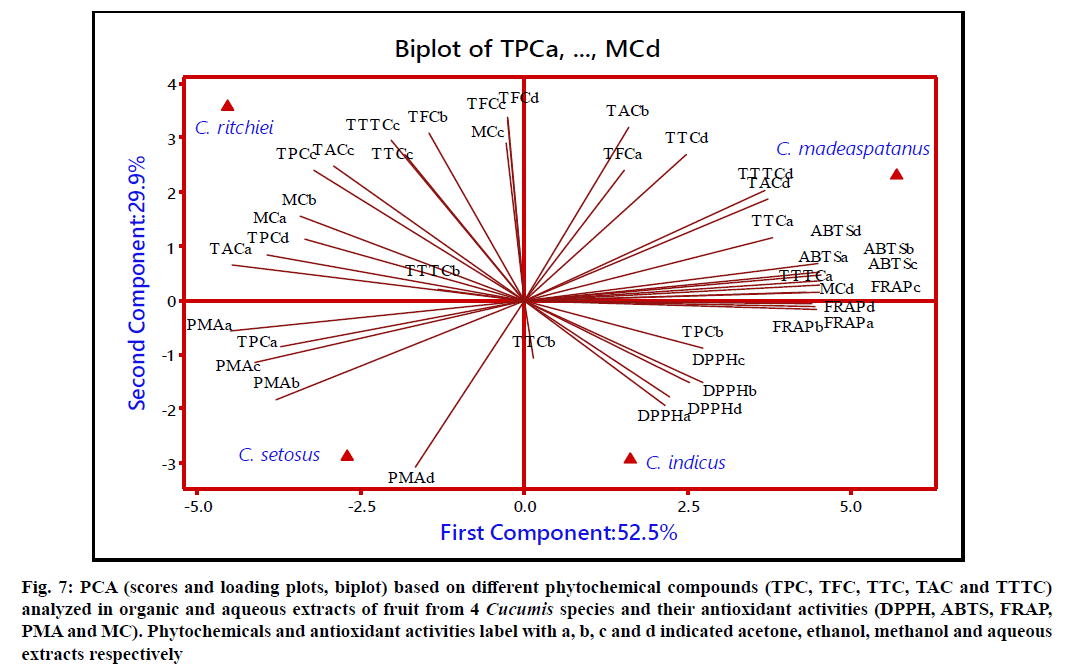
The score plot, loading plot and the percentage of variance of first two PC for fruits of Cucumis taxa is represented in fig. 7. The loading plot demonstrated 52.5 and 29.9 % of variance for PC1 and PC2, respectively. Variables viz. TPC (b), TFC (a), TTC (a, b, d), TAC (b, d), TTTC (a, d), FRAP (a-d), DPPH (a-d) and ABTS (a-d) were loaded at positive side of PC1. However, PC2 demonstrated positive load of variables like TFC (a-d), TTC (a, c, d) and TAC (a-d), ABTS (a-d) and MC (a-d). Based on loading plot and proximity between phytochemicals and antioxidant activities, Cucumis taxa were differentiated from each other. C. maderaspatanus positioned at positive quadrant of PC1 and PC2 which was mainly characterized by higher TTTC, TAC, TTC, ABTS and FRAP. However, the elevated level of TFC, TAC and TPC strongly influenced the MC activity in C. ritchiei. In addition, PCA enlightened that presence of elevated level of studied phytochemicals which was strongly correlated with higher antioxidant activities in both leaf and fruit of C. maderaspatanus. Attar et al.[10] and Ghane et al.[22] also demonstrated the relationship between phytoconstituents and antioxidant properties from the different parts of wild bottle gourd and Crinum species.
Figure 7: PCA (scores and loading plots, biplot) based on different phytochemical compounds (TPC, TFC, TTC, TAC and TTTC) analyzed in organic and aqueous extracts of fruit from 4 Cucumis species and their antioxidant activities (DPPH, ABTS, FRAP, PMA and MC). Phytochemicals and antioxidant activities label with a, b, c and d indicated acetone, ethanol, methanol and aqueous extracts respectively
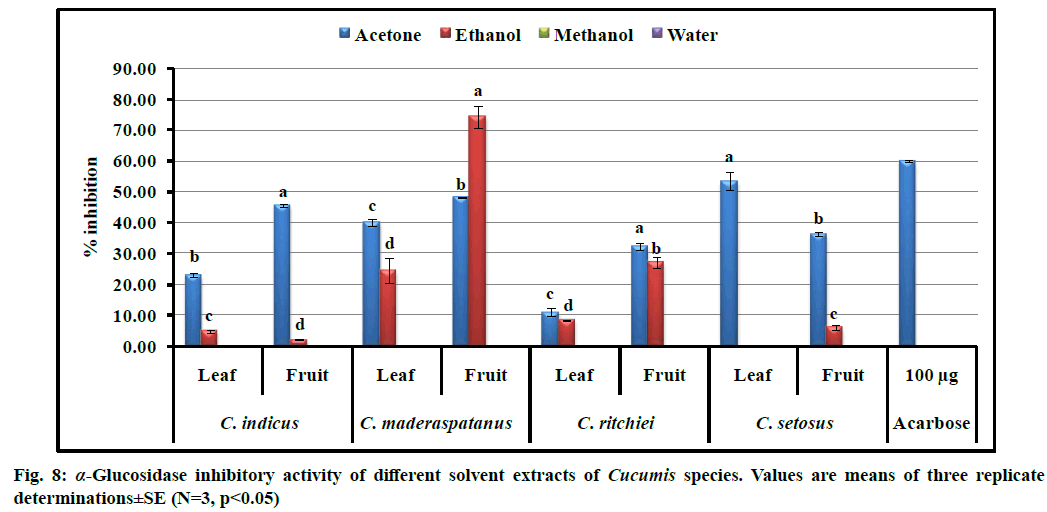
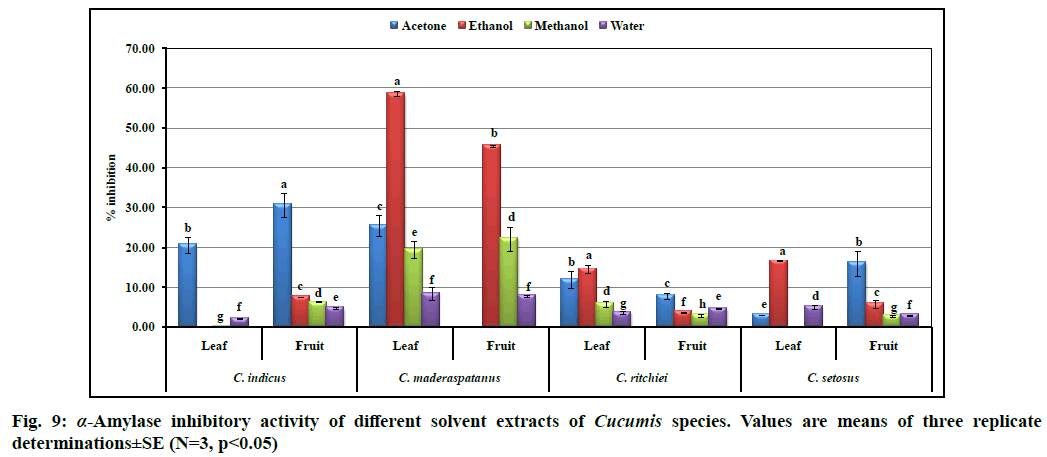
In the present study, different solvent extracts of four Cucumis taxa were evaluated for their inhibitory effects on α-amylase and α-glucosidase enzymes (fig. 8 and fig. 9). Ethanolic extract derived from the fruits of C. maderaspatanus showed the highest α-glucosidase inhibition (74.31±3.75 %) as compared to standard acarbose (59.9±0.40 % at 100 µg concentration). However, the lowest inhibitory activity was recorded in ethanolic fruit extract of C. indicus. Acetone followed by ethanol was found to be a suitable solvent for extraction of α-glucosidase inhibitor. Furthermore, α-glucosidase inhibition was recorded higher in the fruits extracts than leaves. Similar trend was recorded in all the taxa for α-amylase inhibitory activity. Range of α-amylase inhibition was observed from 0.17±0.01 to 58.58 ±0.63 % at 1000 µg extract. Significant activity was recorded in ethanolic leaf (58.58±0.63 %) and fruit (45.43±0.27 %) extracts of C. maderaspatanus. However, the least activity (0.17±0.01 %) was found in methanolic leaf extract of C. indicus. From the study, we noted that acetone or ethanol proved to be the ideal solvents to isolate α-glucosidase and α-amylase inhibitors. Previous studies also revealed that bioactive metabolites present in plant extracts are the novel and potential sources of α-amylase and α-glucosidase inhibitors which provides an effective therapeutic strategy to control hyperglycemia[49]. These results are comparable with α-amylase and α-glucosidase inhibitory activities from the leaf extracts of Momordica dioica, Lagenaria siceraria and Diplocyclos palmatus[9,10,11].
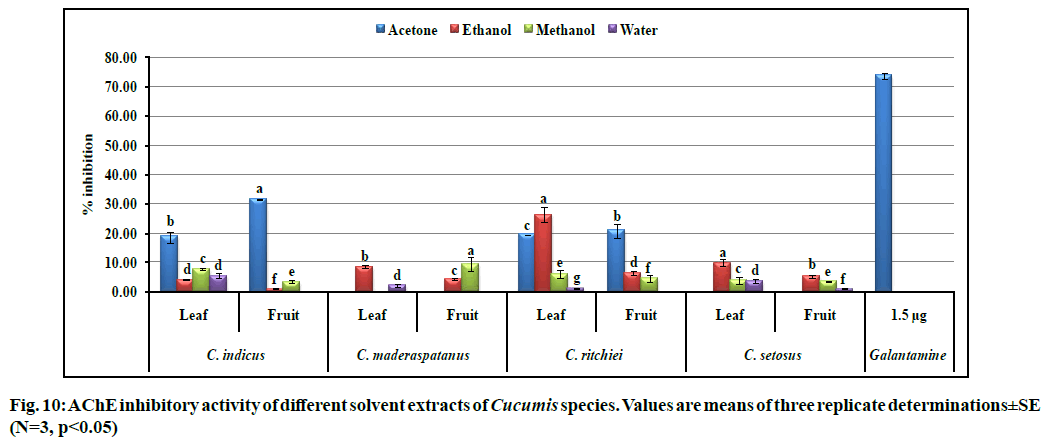
AChE catalyzes the breakdown of the neuro- transmitter ‘acetylcholine’ which disturbed the chlorogenic system of brain associated with memory and cognition. Decreased level of acetylcholine led to several neurological disorders such as AD, senile dementia, ataxia and Myasthenia gravis[50]. In the present study, AChE inhibition was evaluated and results are presented in fig. 10. The highest and lowest AChE inhibition was recorded in acetone (31.63 ±0.16 %) and water (1.03±0.17 %) fruit extracts of C. indicus and C. setosus, respectively. Second highest inhibitory activity was shown by ethanol leaf (26.39±2.45 %) and fruit extract (20.74±2.35 %) of C. ritchiei followed by acetone leaf extract of C. indicus (18.78±1.88 %) against standard galanthamine (73.59±0.92 % at 1.5 µg concentration). Previous studies also reported that flavonoids and terpenoids in the plant extracts are the potent of inhibitors of AChE. Nagarani et al.[9] and Attar et al.[10] recorded the highest AChE inhibitory activity from the Lagenaria siceraria and Momordica species. Recently, Patel et al.[51] reported promising AChE inhibition from the leaves (88.91 %) and fruits (81.87±0.9 %) of Luffa echinata which could be due to the presence of several bioactive metabolites.
Present study revealed the nutritional, antinutritional and ionic status of these underutilized species of the genus Cucumis. Our findings supported the palatability of tested Cucumis species due to high nutritional and less antinutritional contents. Ionomic profiling revealed that Cucumis species are the excellent source of minerals. Significant variation was noted in phenolics, flavonoids, tannins, terpenoids and alkaloids which were depend on solvents, plant parts and genotypes. From the phytochemical evaluation, C. maderaspatanus identified as a promising source of flavonoids, tannins and terpenoids. PCA efficiently demonstrated the positive and significant relation between phytochemicals and antioxidant activities from the leaf and fruit extracts of Cucumis taxa. Leaves and fruits of C. maderaspatanus extracted with acetone or ethanol found to be the substantive source to isolate α-amylase, α-glucosidase and AChE inhibitors. Based on the findings, we concluded that all the Cucumis taxa revealed as a potential source of nutrients, minerals, phytochemicals, antioxidants and inhibitors of carbohydrate digestive and AChE enzyme. Further, detailed study is needed on active constituents for their extensive use in pharmaceutical and cosmetic applications.
Acknowledgements:
Authors wish to express our gratitude to Research Strengthening Scheme, Shivaji University, Kolhapur, Maharashtra for the financial assistance (Ref. No.: SU/ C&U.D. Section/27/1340 dated 28th March 2019). The help of the Department of Botany, Shivaji University, Kolhapur and DST-FIST and UGC-DRS-SAP programs are duly acknowledged.
Conflicts of interest:
The authors declare that they have no conflict of interest.
References
- Rochfort S, Panozzo J. Phytochemicals for health, the role of pulses. J Agric Food Chem 2007;55(20):7981-94.
- Attar UA, Ghane SG. Proximate composition, antioxidant activities and phenolic composition of Cucumis sativus forma hardwickii (Royle) WJ de Wilde & Duyfjes. Int J Phytomed 2017;9:101-12.
- Ghane SG, Lokhande VH, Ahire ML, Nikam TD. Indigofera glandulosa Wendl. (Barbada) a potential source of nutritious food: underutilized and neglected legume in India. Genet Resour Crop Evol 2010;57(1):147-53.
- Wild S, Roglic G, Green A, Sicree R, King H. Global prevalence of diabetes: estimates for the year 2000 and projections for 2030. Diabetes Care 2004;27(5):1047-53.
- Kwon YI, Apostolidis E, Kim YC, Shetty K. Health benefits of traditional corn, beans and pumpkin: In vitro studies for hyperglycemia and hypertension management. J Med Food 2007;10(2):266-75.
- Anand P, Singh B, Singh N. A review on coumarins as acetylcholinesterase inhibitors for Alzheimer’s disease. Bioorg Med Chem 2012;20(3):1175-80.
- Simpson R, Morris GA. The anti-diabetic potential of polysaccharides extracted from members of the cucurbit family: A review. Bioact Carbohydr Diet Fibre 2014;3(2):106-14.
- Shukla M, Naik VR, Almeida AK, Saklani A. In vitro screening of cucurbitaceous plants for antidiabetic potential. Indian J Tradit Knowl 2019;18(2):209-25.
- Nagarani G, Abirami A, Siddhuraju P. A comparative study on antioxidant potentials, inhibitory activities against key enzymes related to metabolic syndrome and anti-inflammatory activity of leaf extract from different Momordica species. Food Sci Hum Wellness 2014;3(1):36-46.
- Attar UA, Ghane SG. In vitro antioxidant, antidiabetic, antiacetylcholine esterase, anticancer activities and RP-HPLC analysis of phenolics from the wild bottle gourd (Lagenaria siceraria (Molina) Standl.). S Afr J Bot 2019;125:360-70.
- Patel SB, Attar UA, Sakate DM, Ghane SG. Efficient extraction of cucurbitacins from Diplocyclos palmatus (L.) C. Jeffrey: Optimization using response surface methodology, extraction methods and study of some important bioactivities. Sci Rep 2020;10(1):1-2.
- Renner SS, Pandey AK. The Cucurbitaceae of India: Accepted names, synonyms, geographic distribution and information on images and DNA sequences. PhytoKeys 2013(20):53-118.
- Petkova Z, Antova G. Proximate composition of seeds and seed oils from melon (Cucumis melo L.) cultivated in Bulgaria. Cogent Food Agric 2015;1(1):1018779.
- Gill NS, Sharma G, Arora R. Cucumis trigonus roxb: a review. Int J Recent Adv Pharma Res 2015;5:45-50.
- Association of official analytical chemists (AOAC). Official methods of analysis of AOAC International. AOAC International, 19th ed. Gaithersburg, Maryland, USA; 2012.
- Ikan R. In: Natural products. A laboratory guide. Academic Press, New York; 1969.
- Gao Y, Shang C, Maroof MS, Biyashev RM, Grabau EA, Kwanyuen P, et al. A modified colorimetric method for phytic acid analysis in soybean. Crop Sci 2007;47(5):1797-803.
- Cataldo DA, Maroon M, Schrader LE, Youngs VL. Rapid colorimetric determination of nitrate in plant tissue by nitration of salicylic acid. Commun Soil Sci Plant Anal 1975;6(1):71-80.
- Toth SJ, Prince AL, Wallace A, Mikkelsen DS. Rapid quantitative determination of eight mineral elements in plant tissue by a systematic procedure involving use of a flame photometer. Soil Sci 1948;66(6):459-66.
- Attar UA, Ghane SG. Phytochemicals, antioxidant activity and phenolic profiling of Diplocyclos palmatus (L.) C. Jeffery. Int J Pharm Pharm Sci 2017;9(4):101-6.
- Patel SB, Attar UA, Ghane SG. Antioxidant potential of wild Lagenaria siceraria (Molina) Standl. Thai J Pharm Sci 2018;42(2):90-6.
- Ghane SG, Attar UA, Yadav PB, Lekhak MM. Antioxidant, anti-diabetic, acetylcholinesterase inhibitory potential and estimation of alkaloids (lycorine and galanthamine) from Crinum species: An important source of anticancer and anti-Alzheimer drug. Ind Crops Prod 2018;125:168-77.
- Blessing AC, Ifeanyi UM, Chijioke OB. Nutritional evaluation of some Nigerian pumpkins (Cucurbita spp.). Fruit Veg Cereal Sci Biotech 2011;5(2):64-71.
- Olayinka BU, Etejere EO. Proximate and Chemical Compositions of Watermelon (Citrullus lanatus (Thunb.) Matsum and Nakai cv Red and Cucumber (Cucumis sativus L. cv Pipino). Int Food Res J 2018;25(3):1060-6.
- Pamela CC, Richard AH, Denise RF. Lippincott illustrated Reviews Biochemistry 3rd ed. Lippincott Williams and Wilkins, Philadelphia 2005; 335-88.
- Franca ON. Proximate analysis and protein solubility of four cucurbits found in Nigeria. Pak J Nutr 2013;12(1):20-2.
- Amin MZ, Islam T, Uddin MR, Uddin MJ, Rahman MM, Satter MA. Comparative study on nutrient contents in the different parts of indigenous and hybrid varieties of pumpkin (Cucurbita maxima Linn.). Heliyon 2019;5(9):e02462.
- Ogunyemi TC, Ekuma CM, Egwu JE, Abbey DM. Proximate and Mineral Composition of Sponge Gourd (Luffa cylindrica) Seed Grown in South-Western Nigeria. J Sci Res Rep 2020;26(4):61-7.
- Das L, Bhaumik E, Raychaudhuri U, Chakraborty R. Role of nutraceuticals in human health. J Food Sci Technol 2012;49(2):173-83.
- Elinge CM, Muhammad A, Atiku FA, Itodo AU, Peni IJ, Sanni OM, et al. Proximate, mineral and anti-nutrient composition of pumpkin (Cucurbita pepo L) seeds extract. Int J Plant Res 2012;2(5):146-50.
- Pandey S, Singh J, Upadhyay AK, Ram D, Rai M. Ascorbate and carotenoid content in an Indian collection of pumpkin (Cucurbita moschata Duch. Ex Poir.). Cucurbit Genet Coop Rep 2003;26:51-3.
- Yadav BS, Yadav R, Yadav RB, Garg M. Antioxidant activity of various extracts of selected gourd vegetables. J Food Sci Technol 2016;53(4):1823-33.
- Lee J, Koo N, Min DB. Reactive oxygen species, aging and antioxidative nutraceuticals. Compr Rev Food Sci Food Saf 2004;3(1):21-33.
- John KJ, Roy YC, Krishnaraj MV, Nissar VA, Latha M, Bhat KV. Ecological and morphological characterisation of two rare and endemic wild edible Cucumis species (Cucurbitaceae) of Western Ghats of India. Genet Resour Crop Evol 2017;64(1):149-58.
- John KJ, Khedasana R, Nissar VM, Scariah S, Sutar S, Rao SR, et al. On the occurrence, distribution and taxonomy of Cucumis setosus Cogn., an endemic wild edible vegetable from India. Genet Resour Crop Evol 2014;61(2):345-55.
- Akande KE, Doma UD, Agu HO, Adamu HM. Major antinutrients found in plant protein sources: their effect on nutrition. Pak J Nutr 2010;9(8):827-32.
- Mavengahama S, McLachlan M, De Clercq W. The role of wild vegetable species in household food security in maize based subsistence cropping systems. Food Secur 2013;5(2):227-33.
- Bankole SA, Osho A, Joda AO, Enikuomehin OA. Effect of drying method on the quality and storability of ‘egusi’ melon seeds (Colocynthis citrullus L.). Afr J Biotechnol 2005;4(8):799-803.
- Chandran R, Nivedhini V, Parimelazhagan T. Nutritional composition and antioxidant properties of Cucumis dipsaceus Ehrenb. ex Spach leaf. Sci World J; 2013.
- Nivedhini V, Chandran R, Parimelazhagan T. Chemical composition and antioxidant activity of Cucumis dipsaceus Ehrenb. Ex Spach fruit. Int Food Res J 2014;21(4):1465-72.
- Watanabe T, Maejima E, Yoshimura T, Urayama M, Yamauchi A, Owadano M, et al. The ionomic study of vegetable crops. PLoS One 2016;11(8):e0160273.
- Liu X, Zhao M, Wang J, Yang B, Jiang Y. Antioxidant activity of methanolic extract of emblica fruit (Phyllanthus emblica L.) from six regions in China. J Food Compost Anal 2008;21(3):219-28.
- Roginsky V. Chain-breaking antioxidant activity of natural polyphenols as determined during the chain oxidation of methyl linoleate in Triton X-100 micelles. Arch Biochem Biophys 2003;414(2):261-70.
- Hao B, Shen SF, Zhao QJ. Cytotoxic and antimalarial amaryllidaceae alkaloids from the bulbs of Lycoris radiata. Molecules 2013;18(3):2458-68.
- Shamsa F, Monsef H, Ghamooshi R, Verdian-rizi M. Spectrophotometric determination of total alkaloids in some Iranian medicinal plants. Thai J Pharm Sci 2008;32:17-20.
- Singh B, Sharma RA. Plant terpenes: defense responses, phylogenetic analysis, regulation and clinical applications. 3 Biotech 2015;5(2):129-51.
- Irshad M, Ahmad I, Mehdi SJ, Goel HC, Rizvi MM. Antioxidant capacity and phenolic content of the aqueous extract of commonly consumed cucurbits. Int J Food Prop 2014;17(1):179-86.
- Attar UA, Ghane SG. Optimized extraction of anti-cancer compound–cucurbitacin I and LC–MS identification of major metabolites from wild Bottle gourd (Lagenaria siceraria (Molina) Standl.). S Afr J Bot 2018;119:181-7.
- Mosaddegh M, Naghibi F, Moazzeni H, Pirani A, Esmaeili S. Ethnobotanical survey of herbal remedies traditionally used in Kohghiluyeh va Boyer Ahmad province of Iran. J Ethnopharmacol 2012;141(1):80-95.
- Khadri A, Neffati M, Smiti S, Fale P, Lino AR, Serralheiro ML, et al. Antioxidant, antiacetylcholinesterase and antimicrobial activities of Cymbopogon schoenanthus L. Spreng (lemon grass) from Tunisia. LWT Food Sci Technol 2010;43(2):331-6.
- Patel SB, Ghane SG. Phyto-constituents profiling of Luffa echinata and in vitro assessment of antioxidant, anti-diabetic, anticancer and anti-acetylcholine esterase activities. Saudi J Biol Sci 2021;28(2):3835-46.
