- Corresponding Author:
- W. Yin
College of Pharmacy, Nanjing University of Chinese Medicine, Nanjing 210023,P. R. China
E-mail: wyin@nju.edu.cn
| Date of Submission | 17 September 2014 |
| Date of Revision | 01 February 2015 |
| Date of Acceptance | 20 November 2015 |
| Indian J Pharm Sci 2015;77(6):715-722 |
This is an open access article distributed under the terms of the Creative Commons Attribution-NonCommercial-ShareAlike 3.0 License, which allows others to remix, tweak, and build upon the work non-commercially, as long as the author is credited and the new creations are licensed under the identical terms.
Abstract
Psoralea Fructus, the dried and ripe fruit of Psoralea corylifolia L., have been used as traditional medicine. There is substantial evidence that multiple constituents are responsible for the beneficial effects of this medicine. To effectively control the quality of this herbal medicine, HPLC fingerprint analysis was performed on a SinoChrom ODS-BP column with mobile phase of a gradient prepared from H2O and CH3CN, which the conditions used for gradient elution were: 0–10 min, 5–45% CH3CN; 10–45 min, 45–70% CH3CN; 45–50 min, 70–100% CH3CN; 50–60 min, 100–100% CH3CN, and the flow rate was 1.0 ml/min. It was obtained on the basis of the chromatographic data from 28 batches of samples, which contained 26 common peaks and 13 peaks were identified by the electrospray ionization-mass spectrometry as psoralen, isopsoralen, isobavachin, neobavaisoflavone, bavachin, corylin, broussochalcone B, psoralidin, isobavachalcone, bavachinin, corylifol A, bavachalcone and backuchiol. The contents of these 13 compounds were also simultaneously examined. By using principal component analysis, 28 batches of samples collected from 6 producing locations with different collecting time were evaluated and differentiated. In summary, the data as described in this study offer valuable information for quality control and proper use of Psoralea Fructus.
Keywords
Psoralea fructus, high performance liquid chromatography fingerprint, multi-components analysis, principal component analysis.
Herbal medicines have gained increasing attention for their unique effectiveness and relatively minor side effects. However, the poor quality of traditional medicine has limited their application in disease therapy[1,2]. Previously, quality control of herbal medicines was mainly performed by determining the contents of several active components, and the major limitation of it is that the drugs efficiency is a combined effect of all components in the medicine. Therefore, one or several components can not represent the whole quality of a specified herbal medicine. To circumvent this deficiency, fingerprint technology, due to its integrity and fuzzy, has recently been introduced and accepted by the WHO and the State Food and Drug Administration (SFDA) of China as a strategy for evaluation of the quality of herbal medicines and their products[3,4]. Among these fingerprinting techniques, chromatographic fingerprint is a very useful and popular analytical approach because it emphasizes the systemic characterization of sample composition[5-7]. Chromatographic methods currently available for fingerprint include high performance liquid chromatography (HPLC), capillary electrophoresis (CE), gas chromatography (GC), thin-layer chromatography (TLC) and so on[8].
Psoralea Fructus, the dried and ripe fruit of Psoralea corylifolia L. (Leguminosae), are widely used in Asian country as a traditional medicine, because it demonstrates unique effectiveness against infectious diseases, inflammatory disorder, tumor and depression[9-11]. Lots of active components have been isolated and identified in Psoralea Fructus, most of them belong to coumarins and flavonoids[12]. Among them, psoralen, isopsoralen, and psoralidin are the representative components of coumarins[13], while bavachin, isobavachalcone and neobavaisoflavone can be appreciated as the representative components of flavonoids[14]. Besides, backuchiol are the representative component of monoterpene phenols[15]. Lines of evidence demonstrated that these compounds are mainly responsible for the pharmacological effects of Psoralea Fructus[16-18]. Notably, although active components of Psoralea Fructus have been intensively examined, the effective approaches to control the quality of Psoralea Fructus are lacking. As a matter of fact, quality of Psoralea Fructus varied greatly depending on the habitant conditions and collecting time.
To address these deficiencies, 28 batches of Psoralea corylifolia L. were collected from China and Burma. A high performance liquid chromatography (HPLC) equipped with diode array detector (DAD) method was used for generating a fingerprint to evaluate the quality, and meanwhile, for measuring 13 main compounds in this herbal medicine. As a result, HPLC conditions including solvent, extraction method, analytical time and analytical conditions were optimized, and subsequently, a common HPLC-DAD fingerprint pattern for Psoralea Fructus was established based on chromatographic data from 28 batches samples, in which 26 common peaks were included. By using this fingerprint combined with similarity evaluation and principal-component analysis, quality assessment of Psoralea Fructus collected at different places and time were achieved.
Materials and Methods
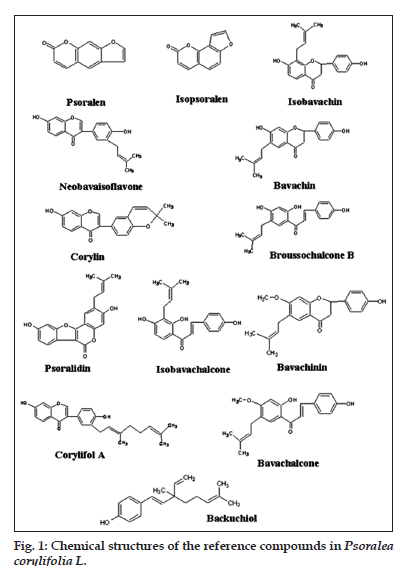
The major compounds in Psoralea Fructus including psoralen, isopsoralen, isobavachin, neobavaisoflavone, bavachin, corylin, broussochalcone B, psoralidin, isobavachalcone, bavachinin, corylifol A, bavachalcone and Backuchiol were isolated from Psoralea Fructus in our laboratory, and characterized by the analytical methods of UV, IR, NMR and MS. The purity of the compounds was >98.0%, as confirmed by HPLC-DAD. The chemical structures of these 13 standards are shown in fig. 1.
HPLC-grade acetonitrile was purchased from Merck Company (Darmstadt, Germany). High purity deionized water (18.2 MΩ cm) was obtained from a Milli-Q water purification system (Millipore Bedford, MA, USA). Methanol of analytical grade used for sample extraction was from Shanghai Chemical Corporation (Shanghai, China).
The 28 batches samples of Psoralea Fructus were collected from Anhui (4 batches), Guangxi (6 batches), Henan (4 batches), Jiangsu (5 batches) and Yunan (8 batches) provinces of China, Burma (1 batches) during the year from 2009 to 2012. The samples were identified at Nanjing University of Chinese Medicine. The voucher specimens were deposited at College of Pharmacy of the Nanjing University of Chinese medicine. Details of the samples were listed in Table 1.
HPLC apparatus and conditions
HPLC analysis was performed with Agilent series 1100 equipment consisting of G1311A quaternary pump, G1315B-Diode array detector and G1316A column compartment. Samples were separated on a SinoChrom ODS-BP C18 column (4.6 mm i.d.×250 mm, 5 μm particle). The mobile phase was a gradient prepared from H2O (component A) and CH3CN (component B), and the conditions used for gradient elution were: 0–10 min, 5–45% CH3CN; 10–45 min, 45–70% CH3CN; 45–50 min, 70–100% CH3CN; 50–60 min, 100–100% CH3CN. The flow rate was 1.0 ml/min. After the 100% acetonitrile, the mobile phase was switched to 5% acetonitrile for 10 min to equilibrate the column, and then the next sample was injected. The injection volume was 10 μl. Chromatograms with good separation were obtained when the column temperature was 30°. The detection wavelengths were 250 nm for fingerprint, 250 nm for measurement of psoralen, isopsoralen, neobavaisoflavone, corylin and backuchiol; 275 nm for isobavachin, bavachin, bavachinin and corylifol A; 375 nm for bavachalcone B, isobavachalcone and bavachalcone; 350 nm for psoralidin, respectively.
| Number | Producing area | Collection data |
|---|---|---|
| S1 | Yunnan, China | 20100911 |
| S2 | Yunnan, China | 20100921 |
| S3 | Yunnan, China | 20101021 |
| S4 | Yunnan, China | 20110919 |
| S5 | Yunnan, China | 20111010 |
| S6 | Yunnan, China | 20121021 |
| S7 | Yunnan, China | 20121021 |
| S8 | Yunnan, China | 20121111 |
| S9 | Guangxi, China | 20100921 |
| S10 | Guangxi, China | 20101203 |
| S11 | Guangxi, China | 20111003 |
| S12 | Guangxi, China | 20121021 |
| S13 | Guangxi, China | 20121101 |
| S14 | Guangxi, China | 20121113 |
| S15 | Henan, China | 20111010 |
| S16 | Henan, China | 20111102 |
| S17 | Henan, China | 20121118 |
| S18 | Henan, China | 20121120 |
| S19 | Jiangsu, China | 20101119 |
| S20 | Jiangsu, China | 20111029 |
| S21 | Jiangsu, China | 20121118 |
| S22 | Jiangsu, China | 20121119 |
| S23 | Jiangsu, China | 20121123 |
| S24 | Anhui, China | 20090923 |
| S25 | Anhui, China | 20101021 |
| S26 | Anhui, China | 20101023 |
| S27 | Anhui, China | 20101102 |
| S28 | Burma | 20101013 |
Table 1: Details Of The Herbal Materials Collected.
Preparation of standard and sample
The standards were accurately weighed and dissolved in methanol to prepare the mixed stock solution consisting of psoralen at 0.406 mg/ml, isopsoralen at 0.236 mg/ml, isobavachin at 0.412 mg/ml, neobavaisoflavone at 0.410 mg/ml, bavachin at 0.274 mg/ml, corylin at 0.436 mg/ml, broussochalcone B at 0.358 mg/ml, psoralidin at 0.278 mg/ml, isobavachalcone at 0.272 mg/ml, bavachinin at 0.236 mg/ml, corylifol A at 0.270 mg/ml, bavachalcone at 0.464 mg/ml and backuchiol at 0.442 mg/ml. A set of standard solutions with six different concentration levels were prepared by further dilution of the stock solution with methanol for assessment of linearity. All standard solutions were kept at 4° and filtered through a 0.45 μm membrane before injection.
Psoralea Fructus were pulverized and sieved (60 mesh). Samples (0.1 g) were extracted with methanol (50 ml) for 2 h by the heating reflux extraction. The extracts were filtered and evaporated to semi-dryness, and the residues were dissolved in 20 ml methanol. Solutions were filtered through a 0.45 μm polytetrafluoroethylene membrane filter (Tianjin Jinteng Instrument Factory, Tianjin, China) before analysis.
Data analysis
Similarity analysis of Psoralea Fructus samples were performed by using the professional software “Similarity Evaluation System for Chromatographic Fingerprint of Traditional Chinese Medicine” (SES, version 2004A) recommended by SFDA of China. The principle of the software is evaluation the similarity of different chromatograms by calculating the correlation coefficient and/or multivariate cosine. Principal component analysis was performed by SIMCA-P11.0 software.
Results and Discussion
To achieve maximum recovery of the components of Psoralea Fructus, the extraction conditions including solvents, method and time were optimized. First, dichloromethane, ethyl acetate, n-Hexane, ethanol, methanol, ethanol-water or methanol-water of different composition (50%, 70%, 95% ethanol or methanol) were evaluated as extraction solvents. As a result, methanol was shown to be the best solvent because it enabled maximum extraction of the most active components with relatively high yield. To examine the effect of extraction methods on recovery, ultrasonic extraction, Soxhlet extraction and extraction under heat-reflux were investigated and compared. Then the extraction duration (1, 2 or 3 h) and extraction times (1 or 2) were optimized. The results revealed that heat-reflux extraction for 2 h can achieve highest extraction efficiency, as the extraction time increased, no significant change in the extraction efficiency occurred.
To improve the resolution of the peaks, mobile phase systems by using methanol-water, acetonitrile-water, acetonitrile-0.1% aqueous formic acid and methanol-0.1% aqueous acetic acid were examined, and the results demonstrated that acetonitrile-water was the most suitable mobile phase systems because it gave a good peak shape. Then the influences of gradient elution, different analytical columns including SinoChrom ODS-BP C18 column (4.6×250 mm, 5 μm), Kromasil KR100-5C18 column (4.6×250 mm, 5 μm), Lichrospher C18 column (4.6×250 mm, 5 μm), different column temperatures (25, 30 and 35°) and detection wavelengths (200–400 nm) on the peak resolution were also carefully evaluated and compared. The result demonstrated that more compounds could be detected on SinoChrom ODS-BP C18 column (4.6×250 mm, 5 μm) with the column temperature was at 30° and the detection wavelength was at 250 nm for fingerprint.
LC-MS identity confirmation
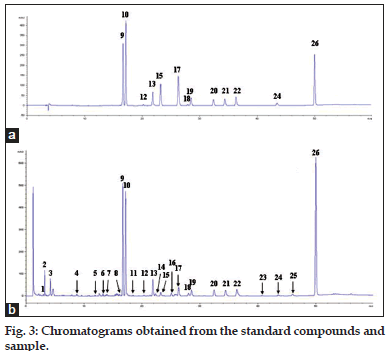
To confirm the chemical constituents, psoralea extracts were subject to HPLC-MS analysis by Aglient 1200 equipped with an electrospray ionization (ESI) source. The chromatographic conditions were the same as those used for HPLC-DAD analysis. The MSD parameters were as follows: drying gas flow rate 10 l/min, fragmentor 100, dying gas temperature 350° and nebulizer pressure 35 psi. The mass spectra were performed in positive and negative ion modes, and spectrometric data were acquired from m/z 100 to 600. As a result, 13 peaks of the methanol extract from Psoralea Fructus well matched with standards on retention times, MS spectra and ultraviolet absorption. Therefore, these chemicals were identified as psoralen (peak 9), isopsoralen (peak 10), isobavachin (peak 12), neobavaisoflavone (peak 13), bavachin (peak 15), corylin (peak 17), broussochalcone B (peak 18), psoralidin (peak 19), isobavachalcone (peak 20), bavachinin (peak 21), corylifol A (peak 22), bavachalcone (peak 24), backuchiol (peak 26), respectively (Table 2).
Method validation of quantitative analysis
Six concentrations of the standard solutions were analyzed in triplicate, and the calibration curves were constructed from peak areas of standards versus their concentrations. The standard solutions were diluted to a series of appropriate concentrations with methanol. The limits of determinations (LODs) (S/N≈3) and limits of quantifications (LOQs) (S/N≈10) under the present conditions were determined, respectively.
| Identification | Molecular weight | MS data |
|---|---|---|
| Psoralen | 186.2 | 187.0[M+H]+, 395[2M+Na]+, |
| 159[M+H−CO]+ | ||
| Isopsoralen | 186.2 | 187.0[M+H]+, 395[2M+Na]+, |
| 159[M+H−CO]+ | ||
| Isobavachin | 324.4 | 325.1[M+H]+ |
| Neobavaisoflavone | 322.3 | 323.1[M+H]+, 321.3[M−H]-, |
| 267 [M−C4H7]+, 239 [M−C4H7−CO]+ | ||
| Bavachin | 324.4 | 325.2[M+H]+, 269 [M-C4H7]+, |
| 323.2[M−H]- | ||
| Corylin | 320.3 | 321.1[M+H]+, 663.1[2M+Na]+, |
| 319.1[M−H]- | ||
| Broussochalcone B | 324.4 | 325.1[M+H]+ |
| Psoralidin | 336.4 | 337.1[M+H]+, 281 [M-C4H7]+, |
| 335.1[M−H]- | ||
| Isobavachalcone | 324.4 | 325.1[M+H]+, 269 [M-C4H7]+, |
| 323.1[M−H]- | ||
| Bavachinin | 338.4 | 339.1[M+H]+, 283 [M-C4H7]+, |
| 337.0[M−H]- | ||
| Corylifol A | 390.5 | 391.2[M+H]+, 389.2[M−H]- |
| Bavachalcone | 338.4 | 339.1[M+H]+, 699 [2M+Na]+, |
| 361[M+Na]+, 337.1[M−H]- | ||
| Backuchiol | 256.4 | 257.2[M+H]+, 255.1[M−H]- |
Table 2: The Mass Data And The Retention Time Of The 13 Components.
The calibration data, linear ranges, R, LOD and LOQ were listed in the Table 3. The data revealed a good linear relationship between the measured 13 compounds concentrations and their peak areas within the test range (R>0.9995).
To assess the intraday and interday precisions of the method, the standard stock was analyzed during a single day or three consecutive days, respectively. The same sample solution was also analyzed at different time (0, 3, 6, 9, 12, 15, 18 and 24 h) to test its stability. The reproducibility of the method was evaluated by analysis of six replicates of the same sample. Accuracy was determined in recovery experiments by adding the standards into 0.05 g of sample, followed by extraction and HPLC analysis. As shown in Table 4, the relative standard deviations (RSD) of intraday precision, interday precision, reproducibility, stability for all the components under the established method were <3%. All results of recovery were within the usually required recovery range of 97.0-103.1%. The above result suggested that the method was fully validated for simultaneous determination of the 13 compounds in Psoralea Fructus.
| Compounds | RT (min) | Regression equation | r | Linear ranges (µg/ml) | LOQ (µg/ml) | LOD (µg/ml) |
|---|---|---|---|---|---|---|
| Psoralen | 16.6 | y=71160x-21.2 | 0.9999 | 10.15-40.60 | 0.295 | 0.092 |
| Isopsoralen | 17.1 | y=165816x-21.7 | 0.9999 | 5.90-23.60 | 0.130 | 0.041 |
| Isobavachin | 20.1 | y=26366x+12.4 | 0.9996 | 1.03-4.12 | 0.468 | 0.146 |
| Neobavaisoflavone | 21.8 | y=42944x-13.0 | 1 | 5.125-20.5 | 0.633 | 0.198 |
| Bavachin | 23.1 | y=30945x-2.3 | 0.9999 | 17.125-68.5 | 0.839 | 0.262 |
| Corylin | 26.2 | y=92959x+6.0 | 0.9998 | 5.45-21.8 | 0.334 | 0.104 |
| Broussochalcone B | 27.9 | y=40000x-3.4 | 0.9995 | 0.448-1.79 | 0.364 | 0.114 |
| Psoralidin | 28.5 | y=55040x-9.9 | 0.9999 | 3.475-13.9 | 0.837 | 0.262 |
| Isobavachalcone | 32.3 | y=113376x-9.7 | 1 | 3.4-13.6 | 0.339 | 0.106 |
| Bavachinin | 34.3 | y=40378x+1.0 | 0.9999 | 5.9-23.6 | 0.932 | 0.291 |
| Corylifol A | 36.3 | y=34921x+2.2 | 1 | 3.375-13.51 | 1.329 | 0.415 |
| Bavachalcone | 43.3 | y=63624x+1.1 | 0.9999 | 2.32-9.28 | 0.746 | 0.233 |
| Backuchiol | 49.9 | y=25260x-37.2 | 1 | 27.625-110.5 | 0.982 | 0.307 |
Table 3: Linearity Calibration Curves Of The 13 Components.
| Compound | Precision (%) | RSD (%) | Accuracy (%) | |||||
|---|---|---|---|---|---|---|---|---|
| Intraday RSD | Interday RSD | Reproducibility | Stability | Mean | RSD | |||
| Psoralen | 0.83 | 0.33 | 1.08 | 0.93 | 100.3 | 1.55 | ||
| Isopsoralen | 0.61 | 1.21 | 1.02 | 0.40 | 102.4 | 0.79 | ||
| Isobavachin | 1.72 | 1.84 | 2.18 | 2.61 | 98.9 | 2.08 | ||
| Neobavaisoflavonoids | 0.64 | 0.64 | 1.55 | 0.86 | 100.7 | 1.30 | ||
| Bavachin | 1.05 | 1.23 | 2.20 | 1.62 | 100.8 | 1.87 | ||
| Corylin | 0.41 | 0.88 | 1.43 | 0.81 | 97.0 | 1.48 | ||
| Broussochalcone B | 2.00 | 2.21 | 2.13 | 2.70 | 100.7 | 2.02 | ||
| Psoralidin | 0.51 | 0.66 | 0.95 | 0.86 | 101.6 | 1.17 | ||
| Isobavachalcone | 0.70 | 1.34 | 1.75 | 0.86 | 102.5 | 1.39 | ||
| Bavachinin | 0.34 | 0.98 | 0.67 | 0.63 | 102.2 | 1.64 | ||
| Corylifol A | 1.08 | 1.45 | 1.88 | 1.52 | 103.1 | 1.11 | ||
| Bavachalcone | 0.92 | 1.99 | 1.69 | 1.82 | 101.5 | 1.12 | ||
| Backuchiol | 0.08 | 0.68 | 0.38 | 0.23 | 101.2 | 0.89 | ||
| RSD: Relative standard deviation | ||||||||
Table 4: Precision, Repeatability, Stability And Accuracy Data Of The Content Determination
Method validation of fingerprint
Data analysis of the chromatographic fingerprint was performed by use of SES software, and similarities between chromatograms were used to evaluate fingerprint quality. The same solution was analyzed during a single day or three consecutive days, respectively to assess the intraday and interday precisions of the method. The same sample solution was also analyzed at different times (0, 3, 6, 9, 12, 15, 18 and 24 h) after preparation to test its stability. The reproducibility of the method was evaluated by analysis of six replicates of the same sample. In the precision and stability test, the average similarity of the different chromatograms was 0.999. The results from the reproducibility test revealed that the average similarity of the chromatograms obtained from six replicate analyses was 0.999. All the RSDs were <3%. Therefore, the analytical method of fingerprint used in this study is precise, reproducible, and samples are stable during the test period.
Sample analysis
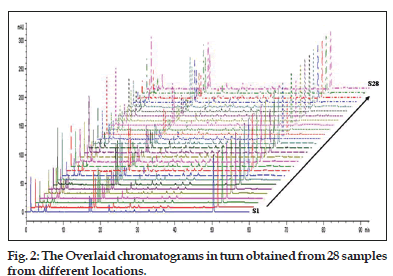
Quantification of 13 compounds in Psoralea Fructus from different provinces of China and Burma was performed by using the established method in section 2.3. Chromatograms obtained from 28 samples from different regions were overlaid, as shown in fig. 2, and the corresponding chemical components were shown in fig. 3. The result demonstrated that all the 13 compounds were baseline separated. The contents and similarity values of these compounds in 28 samples were determined and evaluated. The results shown that backuchiol was the most abundant components in all the samples with a varied content from 3.51 to 7.57%, and occupied 57.8-72.8% of the total content of 13 components determined. Psoralen was ranked as the second abundant constituent with a varied content from 0.23 to 1.29%, followed by neobavaisoflavone, bavachinin, corylifol A, psoralidin, isobavachalcone and isopsoralen, and the average content for them were 0.425, 0.394, 0.249, 0.240, 0.236 and 0.232%, respectively. Isobavachin and broussochalcone B were the compounds of least content. Bavachalcone varied significantly among all the analytes, ranging from 0.01 to 0.12% with about 12 fold variations. In fact, the contents of these 13 compounds in the samples fluctuated with different producing areas and collecting time. Similar results also occurred even in samples from same producing areas or with same collecting time, suggesting besides the producing region and collection time, there still exists other factors in determining the inner quality of Psoralea Fructus.
The above results suggest that it is necessary to develop a more reliable method to control the quality of Psoralea Fructus. In this study, 28 batches of Psoralea Fructus from different provinces were analyzed by HPLC-DAD, and the corresponding chromatograms were overlaid and shown in fig. 2. The common pattern of the HPLC fingerprint of Psoralea Fructus was constructed by using the SES software. Based on the principle of fingerprinting, when the relative standard deviation (RSD) of peaks’ relative retention times for all batches of samples is less than 1%, these peaks belong to the same substance and can be assigned as a “common peak”. In this study, 26 peaks were separated in all batches of samples and regarded as common peaks, which account for over 87.8% of the total peak areas for individual sample as detected at 250 nm. Among them, peak 9, peak 10, peak 12, peak 13, peak 15, peak 17, peak 18, peak 19, peak 20, peak 21, peak 22, peak 24 and peak 26 were identified as psoralen, isopsoralen, isobavachin, neobavaisoflavone, bavachin, corylin, broussochalcone B, psoralidin, isobavachalcone, bavachinin, corylifol A, bavachalcone and backuchiol, respectively. Psoralen (peak 9) was selected as the reference peak. The similarity values for the samples were all >0.90. Taken together, the common HPLC fingerprint pattern for Psoralea Fructus established in this study could be used to assess the quality of this herbal medicine.
Figure 3: Chromatograms obtained from the standard compounds and sample.
Chromatograms obtained from the standard compounds (a) and sample (b). The compounds corresponding to peak 9, 10, 12, 13, 15, 17, 18, 19, 20, 21, 22, 24 and 26 represents psoralen, isopsoralen, isobavachin, neobavaisoflavone, bavachin, corylin, broussochalcone B, psoralidin, isobavachalcone, bavachinin, corylifol A, bavachalcone and backuchiol, respectively.
For further quality evaluation of Psoralea Fructus, principal component analysis (PCA) was applied. This method is superior in reducing the dimensionality of the original dataset by explaining the correlation among a large number of variables in terms of a smaller number of underlying factors without losing much information.
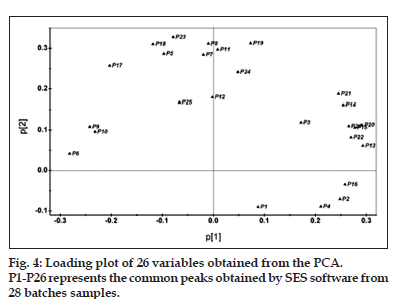
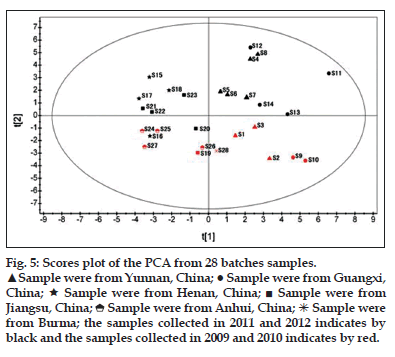
In the present study, we used PCA to summarize the multivariate variation for the wide data matrices in the fingerprinting analyses with more than 20 variables. In the analysis, the PCA computation was performed on a 26×28 data matrix of the fingerprints, in which each row represented a sample, and each column represented the areas under the detected 26 common peaks. The results demonstrated that the eigenvalues of the first and second principal component (PC1 and PC2) were more than 1, and further, 87.6% of the total variance was accounted by the first and second PCs (PC1=58.4%, PC2=29.2%). Therefore, the original data matrix could be reduced to a two-dimensional dataset. The loading plot of the PCA analysis for 26 variables was shown in fig. 4. In general, the peak with a high loading value means the corresponding component varies largely among samples, and thus constituting a dominant variation to classification of the samples. As shown in fig. 4, peak 13 (neobavaisoflavone), peak 20 (isobavachalcone), peak 15 (bavachin), peak 22 (corylifol A) and peak 26 (backuchiol) could be considered as the primary contributing factors for PC1, while peak 23, peak 19 (psoralidin), peak 8, peak 18 (broussochalcone B) and peak 11 largely contribute to PC2. From the score plot shown in fig. 5, it was clear that the samples collected in this study can be classified into 2 major groups based on the value of t[1]. Samples from Yunnan (S1-8), Guangxi (S9-14) of China and from Burma (S28) formed one group on the right of plot because the t[1] values for these samples were also above 0. Accordingly, the t[1] value for samples from Henan (S15-18), Jiangsu (S19-23) and Anhui (S24-27) were all below 0, and thus clustering on the left of plot. To understand why samples of different regions were separated by PCA analysis, we presume that geographical factor might be accounted. In fact, provinces of Yunna and Guangxi were in the south of China, which were adjacent to Burma. However, Henan, Jiangsu and Anhui were in the middle of China. Obviously, different geographical settings in climate, soil can greatly influence the quality of herbal medicine.
Besides the role of t[1] value in differentiating samples of different regions, the value in PCA score plot can be used to distinguish samples with different collecting time. As shown in fig. 5, samples collected in the autumn of 2009 and 2010 including S1, S2, S3, S9, S10, S19, S24, S25, S26, S27, S28 gathered in the bottom of the plot (red), while samples collected in autumn of 2011 and 2012 were on the top (black) except S16 and S20. These two samples were collected in the autumn of 2011 from Henan and Jiangsu, however, peak areas of the 26 common peaks for S16 and S20 were quite close the ones collected in 2010, which may offer explanation why these two samples were clustered with samples collected in 2010 but not in 2011. Taken together, PCA analysis can be effectively used in this study to differentiate samples of different producing regions or with different collecting time.
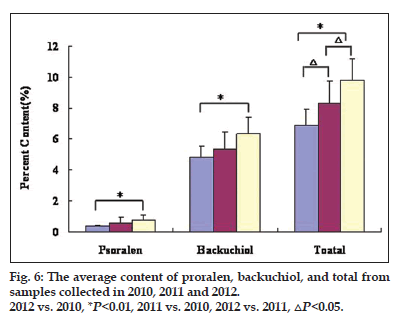
Finally, the differences in samples collected in 2010 (10 batches), 2011 (6 batches) and 2012 (11 batches) were examined. The result demonstrated that the average contents of the 13 major ingredients gradually decreased with the increased storage time (fig. 6). For example, the contents of proralen, backuchiol, and the total contents of 13 constituents in Psoralea Fructus collected in year 2010 were significantly decreased as compared with the samples collected in year 2012 (P<0.01). Similarly, the average contents of the total 13 constituents from samples collected in 2010 were significantly different compared with that in 2011 (P<0.05). These results explained why samples of different collecting time can be clearly differentiated in the PCA diagram.
Figure 5: Scores plot of the PCA from 28 batches samples.
![]() Sample were from Yunnan, China;
Sample were from Yunnan, China; ![]() Sample were from Guangxi, China;
Sample were from Guangxi, China;![]() Sample were from Henan, China;
Sample were from Henan, China; ![]() Sample were from Jiangsu, China;
Sample were from Jiangsu, China; ![]() Sample were from Anhui, China;
Sample were from Anhui, China;![]() Sample were from Burma; the samples collected in 2011 and 2012 indicates by black and the samples collected in 2009 and 2010 indicates by red.
Sample were from Burma; the samples collected in 2011 and 2012 indicates by black and the samples collected in 2009 and 2010 indicates by red.
Acknowledgments
Authors thank prof. Tulin Lu of the Nanjing University of Chinese Medicine.
Financial support and sponsorship
Nil.
Conflicts of interest
There are no conflicts of interest.
References
- Gao H, Wang Z, Li Y, Qian Z. Overview of the quality standard research of traditional Chinese medicine. Front Med 2011;5:195-202.
- Xie PS, Leung AY. Understanding the traditional aspect of Chinese medicine in order to achieve meaningful quality control of Chinese materiamedica. J Chromatogr A 2009;1216:1933-40.
- Liang YZ, Xie P, Chan K. Quality control of herbal medicines. J Chromatogr B AnalytTechnol Biomed Life Sci 2004;812:53-70.
- Zhong XK, Li DC, Jiang JG. Identification and quality control of Chinese medicine based on the fingerprint techniques. Curr Med Chem 2009;16:3064-75.
- Drasar P, Moravcova J. Recent advances in analysis of Chinese medical plants and traditional medicines. J Chromatogr B AnalytTechnol Biomed Life Sci 2004;812:3-21.
- Gong F, Liang YZ, Xie PS, Chau FT. Information theory applied to chromatographic fingerprint of herbal medicine for quality control. J Chromatogr A 2003;1002:25-40.
- Xie P, Chen S, Liang YZ, Wang X, Tian R, Upton R. Chromatographic fingerprint analysis – A rational approach for quality assessment of traditional Chinese herbal medicine. J Chromatogr A 2006;1112:171-80.
- Yi L, Wu H, Liang Y. Chromatographic fingerprint and quality control of traditional Chinese medicines. Se Pu 2008;26:166-71.
- Chopra B, Dhingra AK, Dhar KL. Psoraleacorylifolia L. (Buguchi) – Folklore to modern evidence: review. Fitoterapia 2013;90:44-56.
- Lee SW, Yun BR, Kim MH, Park CS, Lee WS, Oh HM, et al. Phenolic compounds isolated from Psoraleacorylifoliainhibit IL-6-induced STAT3 activation. Planta Med 2012;78:903-6.
- Wang Y, Hong C, Zhou C, Xu D, Qu HB. Screening antitumor compounds psoralen and isopsoralen from Psoraleacorylifolia L. Seeds. Evid Based Complement Alternat Med 2011;2011:363052.
- Ruan B, Kong LY, Takaya Y, Niwa M. Studies on the chemical constituents of Psoraleacorylifolia L. J Asian Nat Prod Res 2007;9:41-4.
- Wu CR, Chang CL, Hsieh PY, Lin LW, Ching H. Psoralen and isopsoralen, two coumarins of Psoraleaefructus, can alleviate scopolamine-induced amnesia in rats. Planta Med 2007;73:275-8.
- Chen X, Yang Y, Zhang Y. Isobavachalcone and bavachinin from Psoraleaefructus modulate Aß42 aggregation process through different mechanisms in vitro. FEBS Lett 2013;587:2930-5.
- Wu CZ, Hong SS, Cai XF, Dat NT, Nan JX, Hwang BY, et al. Hypoxia-inducible factor-1 and nuclear factor-kappaB inhibitory meroterpene analogues of bakuchiol, a constituent of the seeds of Psora leacorylifolia. Bioorg Med ChemLett 2008;18:2619-23.
- Khatune NA, Islam ME, Haque ME, Khondkar P, Rahman MM. Antibacterial compounds from the seeds of Psoraleacorylifolia. Fitoterapia 2004;75:228-30.
- Lim SH, Ha TY, Ahn J, Kim S. Estrogenic activities of Psoraleacorylifolia L. seed extracts and main constituents. Phytomedicine 2011;18:425-30.
- Yin S, Fan CQ, Wang Y, Dong L, Yue JM. Antibacterial prenylflavone derivatives from Psoraleacorylifolia, and their structure-activity relationship study. Bioorg Med Chem 2004;12:4387-92.
