- *Corresponding Author:
- N. Kumar
Department of Analytical Research and Development, IPDO, Dr Reddy’s Laboratories, Hyderabad-500 072
E-mail: nitink@drreddys.com
| Date of Submission | 25 October 2019 |
| Date of Revision | 05 December 2019 |
| Date of Acceptance | 05 January 2020 |
| Indian J Pharm Sci 2020;82(2):20-32 |
This is an open access article distributed under the terms of the Creative Commons Attribution-NonCommercial-ShareAlike 3.0 License, which allows others to remix, tweak, and build upon the work non-commercially, as long as the author is credited and the new creations are licensed under the identical terms
Abstract
Piribedil is an antiparkinson agent, available as Clarius Prolonged release tablet in Germany. No analytical method is reported for estimation of impurities in Piribedil. The objective of this work was to develop a stability indicating method for estimation of impurities in Piribedil Tablets by using quality by design approach. Piribedil and its impurities are having different absorption maxima hence known impurities and unknown impurities were quantified at 210 nm and 238 nm respectively. Phosphate buffer (pH 4.3; 25 mM) and mixture of Phosphate buffer, Methanol, Acetonitrile (30:40:30, v/v respectively) were used in gradient elution mode. Zorbax SB Phenyl (150 x 4.6) mm, 3.5 µm column was used for separation. Mobile phase was delivered at a flow rate of 1.0 mL/minute and column was maintained at 45°. Injection volume was optimized as 10 µl. Critical chromatographic parameters such as Column oven temperature and pH of buffer were optimized by performing Design of experiments. Forced degradation studies were performed and all the degradants formed during forced degradation, were well separated from known impurities and from Piribedil peak. Mass balance was found more than > 98% in all the stressed conditions. The developed method was validated and found specific, precise, linear, accurate, rugged and robust.
Keywords
Quality by design, piribedil, impurities, dual wavelength, high-performance liquid chromatography
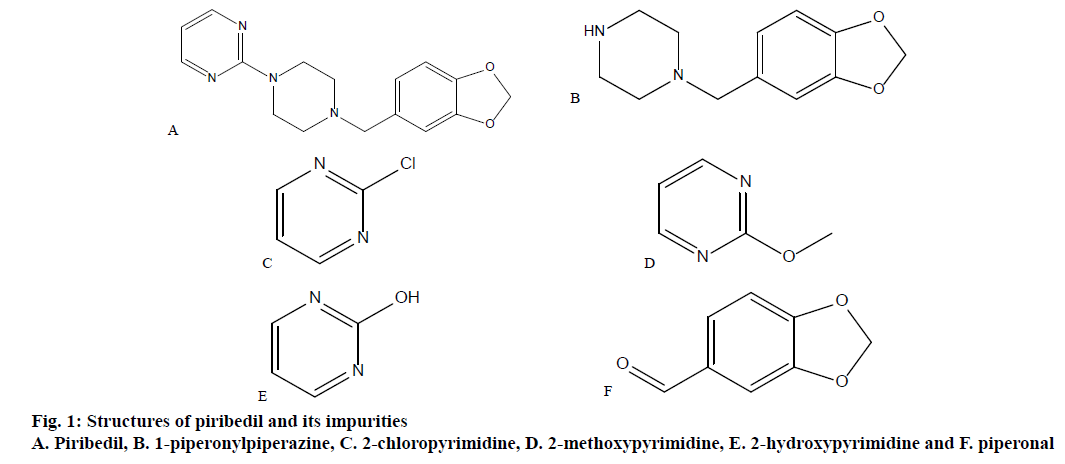
Piribedil, a piperzine derivative, is a non-ergot dopamine receptor agonist, with an unusual pharmacology. Piribedil is used for treating Parkinson’s disease, including drug-induced Parkinson’s. Parkinson’s disease is a neurodegenerative disorder in which a progressive loss of dopaminergic neurons in the substantia pars compacta with a corresponding loss of dopaminergic innervation of the caudate nucleus and the putamen occur [1]. It is also recommended in the treatment of intermittent claudication, degenerative retinal vasculopathies, depression, restless legs syndrome and memory impairment [2]. Molecular weight of piribedil is 298.346 and the IUPAC name is 2-[4-(1,3-benzodioxol-5-ylmethyl)piperazin-1-yl] pyrimidine [3] (figure. 1). Intrinsic solubility of piribedil is 98.0 μg/ml, pKa is 6.94 and the LogP value is 2.84 [1]. Piribedil is available as prolonged release tablets in 50 mg strength. Piribedil prolonged release tablets are available in Germany under the brand name of Clarium marketed by Desitin Arzneimittel GmbH. Piribedil is not approved currently in the United States for therapeutic use. Maximum daily dose of piribedil is 250 mg in 3 to 5 divided doses.
Extensive literature survey was conducted to find out the analytical methods reported for piribedil. Few studies reported estimation of piribedil in drug substance and in tablets using HPLC [4,5]. Potentiometric methods were also reported for estimation of piribedil in pharmaceuticals, and in urine [6,7]. Sarati et al. published a HPLC method for determination of piribedil in plasma samples [8]. A PDA/fluorescence method for estimation of piribedil in rat plasma and brain tissues was reported [9]. Piribedil was estimated in formulations by Yardimci et al. using micellar electrokinetic capillary chromatography [10]. In addition to these analytical methods, few other research articles reported enhancement of dissolution pattern of piribedil [11], optimization of piribedil mucoadhesive tablets [12], characterization of piribedil buccal tablets [13] and in vivo evaluation of piribedil solid lipid micro and nanoparticles [14]. No method has so far been reported for the estimation of impurities in piribedil prolonged release tablets. Piribedil prolonged release tablets are not official in any of the Pharmacopeia [15]. Hence it becomes essential to develop a simple HPLC method for estimation of impurities in piribedil prolonged release tablets. The objective of the current work was to develop a specific, stability-indicating, reversed phase HPLC method for estimation of degradation products and other related impurities in piribedil prolonged release tablets. To get optimum separation for all known and unknown impurities, DoE approach was used and critical chromatographic variables such as column oven temperature, pH of mobile phase buffer and mobile phase B composition were optimized. Based on the maximum daily dose (250 mg), as per ICH guideline, Impurities in New Drug Products Q3B (R2), specification limit for known impurity was decided as 0.2% [16].
Materials and Methods
Potassium dihydrogen phosphate, ortho phosphoric acid, methanol and acetonitrile were of HPLC grade and were procured from Merck India. HPLC grade water for preparation of mobile phase was purchased from Rankem, Gurugram. Piribedil prolonged release tablets, piribedil and its impurities were provided by Dr. Reddy’s Laboratories Ltd., Hyderabad, India. The chemical names of known impurities are 1-(1,3-benzodioxol-5-ylmethyl)piperazine (1-piperonylpiperazine), 2-chloropyrimidine, 2-methoxypyrimidine, 1H-pyrimidin-2-one(2- hydroxypyrimidine), 1,3-benzodioxole-5-carbaldehyde (piperonal). Structures of known impurities are given in figure. 1.
Chromatographic analysis was performed using Waters Alliance high performance liquid chromatograph with quaternary pump, auto sampler, photodiode detector and a column oven (Waters Corporation, Milford, USA). Data was acquired and processed using Empower Networking software (Waters Corporation). Zorbax SB Phenyl, 150×4.6 mm, 3.5 μm HPLC column was received from Agilent Technologies.
Chromatographic conditions:
Mobile phase A was prepared by mixing 25 mM phosphate buffer (pH 4.3) and methanol in the ratio of 95:05, v/v. A mixture of phosphate buffer, methanol and acetonitrile (30:40:30, v/v respectively) was used as mobile phase B. Mobile phases A and B were used in gradient elution mode. Gradient program was optimized as time (min)/mobile phase A (%); 0.0/100, 4/100, 20/65, 25/55, 40/40, 45/0, 50/0, 55/100 and 60/100. Zorbax SB Phenyl 150×4.6 mm, 3.5 μm HPLC column was used for separating all known and unknown impurities and column oven temperature was maintained at 45°. Mobile phase was pumped at a flow rate of 1.0 ml/min. Ten microlitres of each solution was injected and all the known impurities were quantified at 210 nm and all the unknown impurities were quantified at 238 nm.
Preparation of standard solution:
Phosphate buffer and methanol were mixed in the ratio of 55:45 v/v to prepare the diluent. Piribedil standard stock solution was prepared by dissolving appropriate amount of piribedil reference standard in diluent to get a 20 μg/ml stock solution of piribedil. This stock solution was further diluted with the diluent to get a final solution containing 1 μg/ml of piribedil.
Preparation of test solution:
Twenty piribedil prolonged release tablets, were weighed and average tablet weight was calculated. Tablets were crushed to a fine powder in a mortar. Tablet powder equivalent to 50 mg of piribedil was transferred to a 100 ml volumetric flask containing 50 ml of diluent and dissolved by shaking on a mechanical shaker followed by sonication in an ultra sonic bath. After complete drug extraction from sample matrix, volume was made up to 100 ml with diluent. Final solution was centrifuged at 4000 rpm in a centrifuge to make the solution clear before injection in to HPLC.
Method validation:
Analytical method for estimation of degradation products and other related impurities was validated to demonstrate that the method is suitable for its intended purpose. Method was validated as per ICH guideline [17] with respect to specificity, precision, accuracy, ruggedness, robustness, and sensitivity.
System suitability:
System suitability was established before starting the analysis to demonstrate that system is suitable. Three replicate injections of piribedil standard solution (1 μg/ml) were injected into the HPLC and chromatograms were processed at 2 different wavelengths, 210 and 238 nm. USP plate counts, USP tailing and % relative standard deviation (% RSD) were evaluated for piribedil peak at 210 nm, whereas at 238 nm in addition to above system suitability parameters, signal to noise (s/n) ratio was also calculated. The limits for USP plate counts, USP tailing, % RSD and s/n ratio were not less than 20000, not more than 2.0, not more than 5.0 and not less than 40, respectively.
Specificity:
To demonstrate the specificity of the method for estimation of degradation products and impurities of piribedil, a placebo (excipients) solution was prepared by dissolving excipients equivalent to one 50 mg piribedil prolonged release tablet and injected into HPLC following method specified conditions. Placebo chromatogram was assessed for interference at the retention time of piribedil and its impurities.
Furthermore, piribedil prolonged release tablet and its corresponding placebo were stressed to various stress conditions. Solution state stressed conditions included acid hydrolysis (2 N HCl, 70°, 48 h), base hydrolysis (2 N NaOH, 70°, 48 h), water degradation (70°, 48 h) and oxidative degradation (3% H202,40°, 24 h). While solid state degradation involved photolytic stress (1.2 million lux h visible light and 200 wh/square m2 UV light), heat Stress (70°, 48 h) and humidity stress (90 %RH, 7 d). Stressed sample chromatograms were analysed for separation of known and unknown impurities from piribedil and from each other. Stressed sample chromatograms were also evaluated for peak purity of piribedil using Waters Empower Networking software.
Linearity:
Linearity study was performed for piribedil and its known impurities, from limit of quantification (LOQ) level to 150 % of specification level. Based on linearity studies, method ranges were decided. A series of solutions containing piribedil and its impurities; 2-hydroxypyrimidine, 2-chloropyrimidine, 2-methoxypyrimidine, 1-piperonylpiperzine and piperonal, ranging from LOQ to 150 % of specification, were prepared and injected into HPLC. Peak area responses from linearity solutions were plotted against their concentration and correlation coefficient, intercept, and slope were determined
Method precision:
Repeatability and reproducibility studies were performed for piribedil and its impurities to demonstrate that method is precise for estimation of impurities in piribedil. In repeatability study, piribedil test solution was spiked with known impurities, 2-hydroxypyrimidine, 2-chloropyrimidine, 2-methoxypyrimidine, 1-piperonylpiperzine and piperonal to get 0.2% of each impurity. Six spiked test solutions were prepared and injected into HPLC. Per cent impurity content, mean % impurity and % RSD for each impurity were calculated from 6 sample preparations. To show that method is reproducible, intermediate precision was performed on different day, by preparing spiked test solution with all the known impurities at specification level. These spiked test preparations were injected in different HPLCs with different columns. Percent RSD was calculated for % impurities from 6 spiked test solutions.
Accuracy:
Method accuracy was demonstrated by performing the accuracy study. Piribedil test solution was spiked with known amounts of 2-hydroxypyrimidine, 2-chloropyrimidine, 2-methoxypyrimidine, 1-piperonylpiperzine and piperonal. Accuracy study was performed at 3 different levels such as 0.05 (25 % of specification), 0.2 (100 % of specification) and 0.40% (200% of specification). For each level, samples were prepared in triplicate. Micrograms added and μg found for each impurity were calculated for each recovery sample and based on that % recovery values, mean % recovery values were calculated.
Limit of detection and limit of quantification:
Limit of detection (LOD) and LOQ were established based on signal to noise ratio method. The concentration at which signal to noise ratio for piribedil and its impurities was found about 3, chosen as LOD. Similarly, the concentration at which the signal to noise ratio was observed about 10, selected as LOQ. Additionally precision and accuracy at LOQ was performed. LOQ precision was performed by spiking 2-hydroxypyrimidine, 2-chloropyrimidine, 2-methoxypyrimidine, 1-piperonylpiperzine and piperonal at LOQ level on placebo preparation. Six samples were prepared for precision at LOQ and % RSD was calculated. Similarly accuracy at LOQ was performed by spiking impurities at LOQ level on test preparation. Percent individual recovery and % mean recovery were calculated.
Robustness:
Robustness study was performed to demonstrate that slight changes in chromatographic conditions do not make any impact on the separation. Deliberate changes were made in the chromatographic parameters such as column flow, column oven temperature, pH of buffer of mobile phase and composition of mobile phase B. Column flow was changed by ±0.2 ml/min from set flow rate (1.0 ml/min), column oven temperature was varied from 40 to 50°, pH of buffer solution was changed from 4.2 to 4.4 (±0.1 unit from set value). Similarly composition of acetonitrile and methanol were also varied in mobile phase B by ±10 % from method composition. Test solution spiked with impurities, 2-hydroxypyrimidine, 2-chloropyrimidine, 2-methoxypyrimidine, 1-piperonylpiperzine and piperonal at specification level, was injected in all the deliberately altered conditions. System suitability and relative retention times (RRT) of known impurities were assessed.
Stability of test solution and mobile phase:
Test solution spiked with all the known impurities, 2-hydroxypyrimidine, 2-chloropyrimidine, 2-methoxypyrimidine, 1-piperonylpiperzine and piperonal, was prepared and stored at controlled room temperature (25±2°) and in refrigerator (5±3°). The stored solutions were injected after 24 and 48 h. Level of known and unknown impurities were compared in stored test solution against the initial test solution (0 h).
Similarly, mobile phase was prepared and kept at controlled room temperature (25±2°) for 24 and 48 h in tightly closed condition. Freshly prepared test solution spiked with 2-hydroxypyrimidine, 2-chloropyrimidine, 2-methoxypyrimidine, 1-piperonylpiperzine and piperonal, was injected using stored mobile phase. System suitability and impurity levels were compared against the test solution injected by using fresh mobile phase.
Results and Discussion
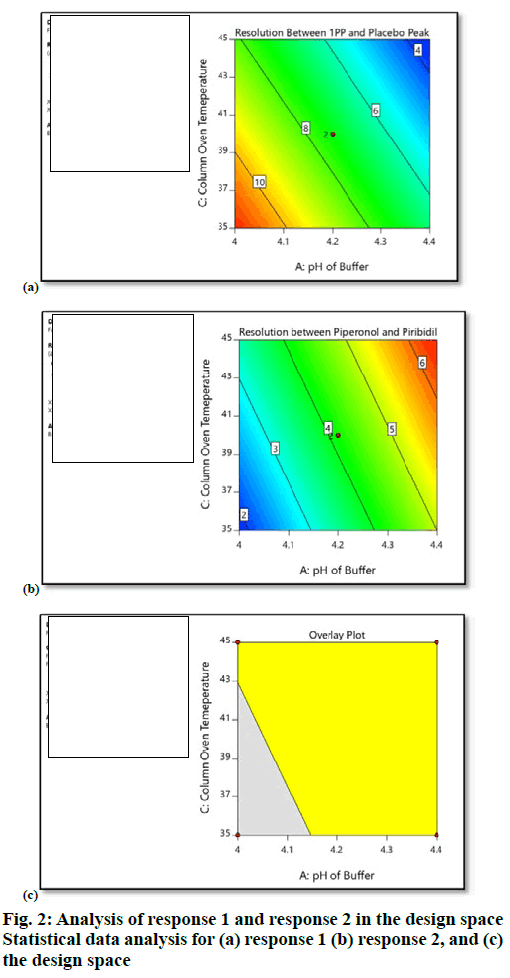
The target analytical method profile (AMP) was defined as resolution not less than 1.5, between known and unknown impurities. Extensive literature survey revealed that piribedil is a piperazine derivative and is basic in nature. It has a pKa value of 6.94, hence for initial screening, basic pH of mobile phase buffer was chosen (potassium dihydrogen phosphate, 25 mM, pH 8.0). Methanol was mixed with buffer in the ratio of 70:30 (v/v). Piribedil is sparingly soluble in water, soluble in ethanol and methanol, hence impurity solution was prepared in a mixture of water:methanol (50:50, v/v). UV spectra of piribedil aqueous solution showed an absorption maxima at 238 nm. HPLC column with C18 stationary phase was maintained at 30 ° and mobile phase was delivered at a flow rate of 1.0 ml/min in gradient elution mode with a linear gradient; T (min)/%A: 0/90, 2/90, 20/10, 21/90, 27/90. 2-hydroxypyrimidine peak was eluting in void and piperonal impurity was merging with piribedil peak. Various HPLC columns with C18 stationary phase (Xterra RP18, Inertsil ODS 3V, Phenomenex Luna C18, and Waters Symmetry Shield RP18) were screened to retain 2-hydroxypyrimidine but no improvement was observed. By changing the column to Zorbax SB Phenyl and pH of buffer to 4.2, retention of 2-hydroxypyrimidine was improved but separation between 2-chloropyrimidine and 2-methoxypyrimidine and between 1-piperonylpiperzine and placebo peak was still very poor (resolution-1: 1.0 and resolution-2: 1.4), which was marginally improved by gradient optimization. Injection volume was finalized as 10 μl. To achieve the optimum separation between impurities, critical method parameters (CMP) such as pH of buffer (A), % methanol in mobile phase B (B) and column oven temperature (C) were optimized using Design of Experiments (DoE). Traditional robustness study involved one factor at a time approach in which the information related to interaction between variables cannot be obtained. Whereas, in DoE approach, multiple variables are changed at a time, which gives information about interactions between variables. Experiments were designed using Design Expert Software (Version 10.0.3, Stat-Ease Inc., Minneapolis). Full factorial design with 2 center points was selected (Table 1), which resulted in 10 experiments. Full factorial design consists of all the possible combinations of all levels of 2 or more factors. Potassium dihydrogen phosphate buffer (25 mM) at different pH values such as pH 4.0 (minimum), pH 4.2 (centre point) and pH 4.4 (maximum) were used in the study. Column oven temperature was varied from 35 to 45° in which 35° was the minimum level, 40° was the center point and 45° was the maximum level. Similarly % methanol in mobile phase B was studied from 90 (minimum) of method composition to 110 % (maximum) of method composition (i.e. 90 , 100 and 110 %). Resolution between 1-piperonylpiperzine and placebo peak (R1) and between piperonal and piribedil (R2) were selected as the responses (Table 2). After collection of the data, analysis of data was performed based on Analysis of the variance (ANOVA) model. Based on data analysis it was observed that % methanol in mobile phase B (B) did not have any impact on the selected responses (R1 and R2). pH of buffer (A) and column oven temperature (C) exerted an impact on the responses (R1 and R2). As the column oven temperature (C) and pH of buffer (A) decreased, resolution (R1) between 1-piperonylpiperzine (1-PP) and placebo peak increased, whereas the resolution (R2) between piperonal and piribedil decreased. Based on design space obtained from the data analysis, pH of buffer was finalized as 4.30 and column oven temperature was finalized as 45° to get the optimum separation between both the critical pairs (figure. 2).
| Factor | Name | Units | Type | Minimum | Center Point | Maximum |
|---|---|---|---|---|---|---|
| A | pH of buffer | - | Numeric | 4.0 | 4.20 | 4.40 |
| B | % Methanol in mobile phase B | % | Numeric | 90.0 | 100 | 110.0 |
| C | Column oven temperature | ° | Numeric | 35.0 | 40 | 45.0 |
Table 1: Selected factors A B and C.
| Response | Name | Target | Model |
|---|---|---|---|
| z | Resolution between 1-piperonylpiperzine and placebo peak | 3.4 | Reduced main effects |
| R2 | Resolution between piperonal and piribedil peak | 1.7 | Reduced main effects |
Table 2: Selected responses R1 and R2.
During estimation of relative response factor of impurities of piribedil against piribedil, it was observed that the relative response factor of all the impurities, 2-hydroxypyrimidine, 2-chloropyrimidine, 2-methoxypyrimidine, 1-piperonylpiperzine and piperonal were less than 0.2, which can lead to error in estimation of impurities during routine analysis. It was mainly because of known impurities having absorption maxima at 210 nm whereas piribedil and major unknown degradation product showed absorption maxima at 238 nm. To avoid the differences in the peak responses, it was decided to perform the detection at 2 different wavelengths. All the known impurities shall be quantified at 210 nm whereas unknown impurities shall be quantified at 238 nm.
Piribedil prolonged release tablets were crushed to a fine powder. Composition of diluent was optimized by preparing diluent with various ratios of buffer (KH2PO4, 25 mM):methanol (20:80, 30:70, 40:60, 55:45, and 60:40, v/v )and based on that buffer:methanol (55:45, v/v) was finalized. Samples were prepared at various concentration level of piribedil and optimum method sensitivity was achieved with 500 μg/ml concentration. Sample extraction procedure was optimized using different sample extraction techniques such as shaking on a mechanical shaker, sonication in an ultrasonic bath and shaking on a mechanical shaker followed by sonication. Shaking for 15 min on a mechanical shaker followed by sonication for 30 min in ultrasonic bath was found adequate to ensure complete drug extraction from sample matrix.
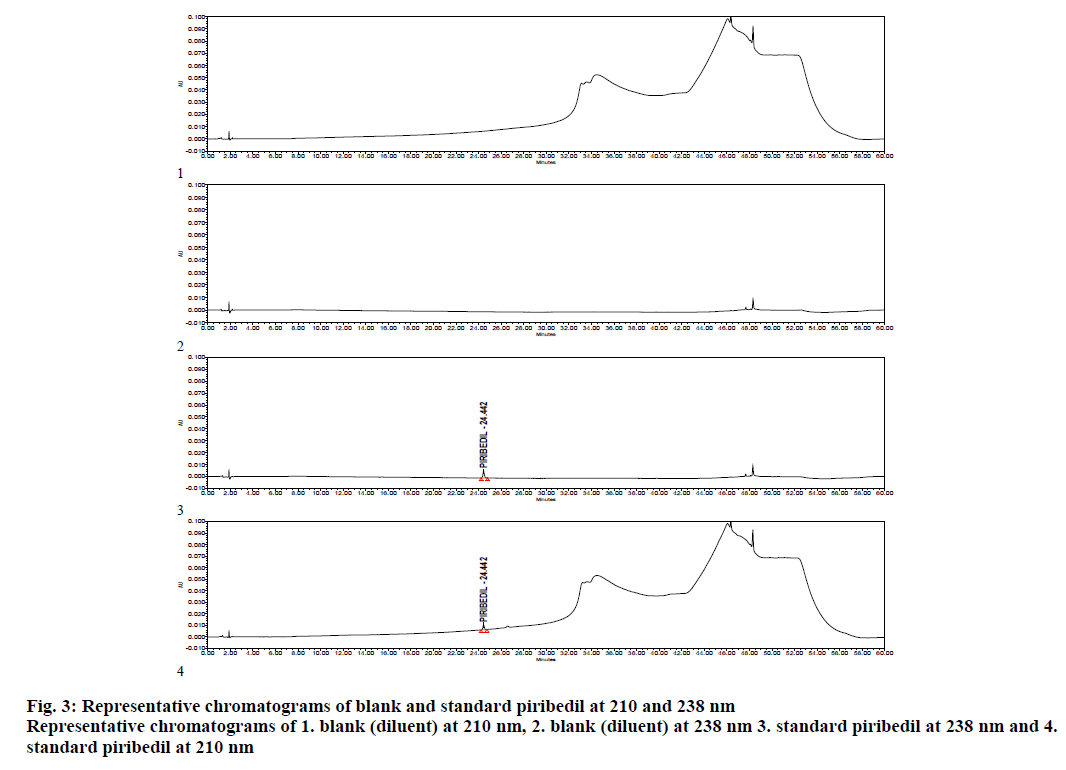
The method was validated as per ICH Guideline for validation of analytical procedures for specificity, precision, LOD/LOQ, linearity, recovery and robustness. As a part of system suitability, 3 replicate injections of piribedil standard were injected in to the HPLC and chromatograms were processed at 210 and 238 nm. Percent RSD of piribedil peak area, USP tailing and USP plate counts were calculated at 210 nm, whereas at 238 nm, signal to noise ratio was also calculated for piribedil peak. % RSD was observed as 1.5 against a limit of not more than 5.0, USP tailing was observed as 1.0 against a limit of not more than 2.0 and USP plate counts were found to be 169894 against a limit of not less than 20000. At 238 nm, s/n ratio for piribedil peak was observed as 95 against a limit of not less than 40 (Table 3). Specimen chromatogram of blank (diluent) and standard are presented in figure. 3.
| System suitability parameter | Observed value | Acceptance criteria | |
|---|---|---|---|
| 210 nm | 238 nm | ||
| Tailing factor of piribedil | 1.0 | 1.2 | Not more than 2.0 |
| s/n ratio of piribedil peak | NA | 95 | Not less than 40 |
| USP Plate counts of piribedil | 169894 | 171816 | Not less than 20000 |
| % RSD of peak area of piribedil | 1.5 | 0.3 | Not more than 5.0 |
Table 3: System suitability.
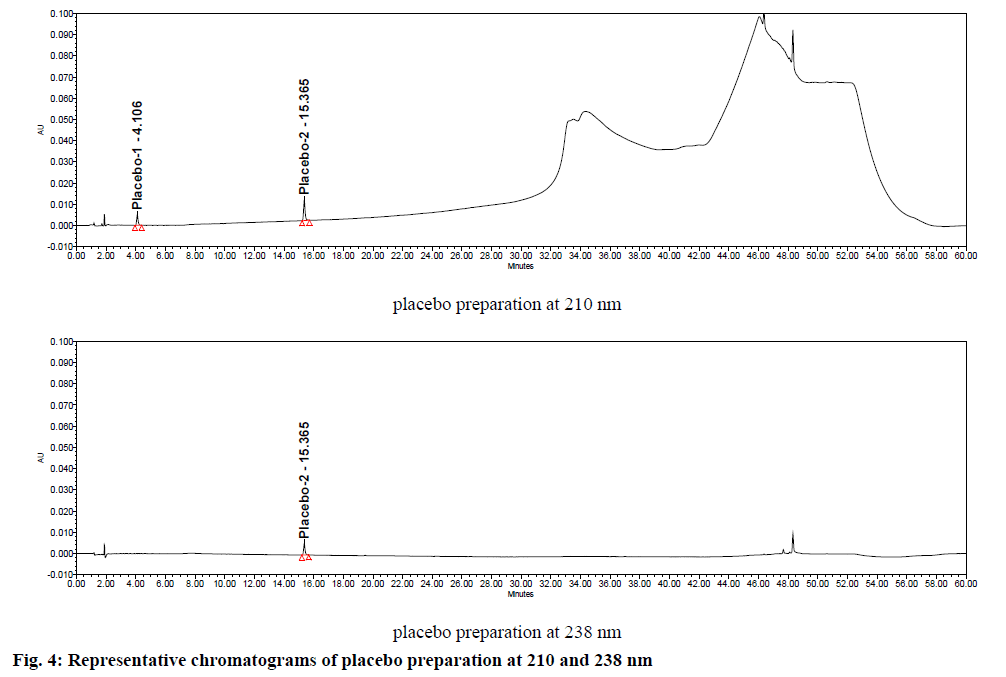
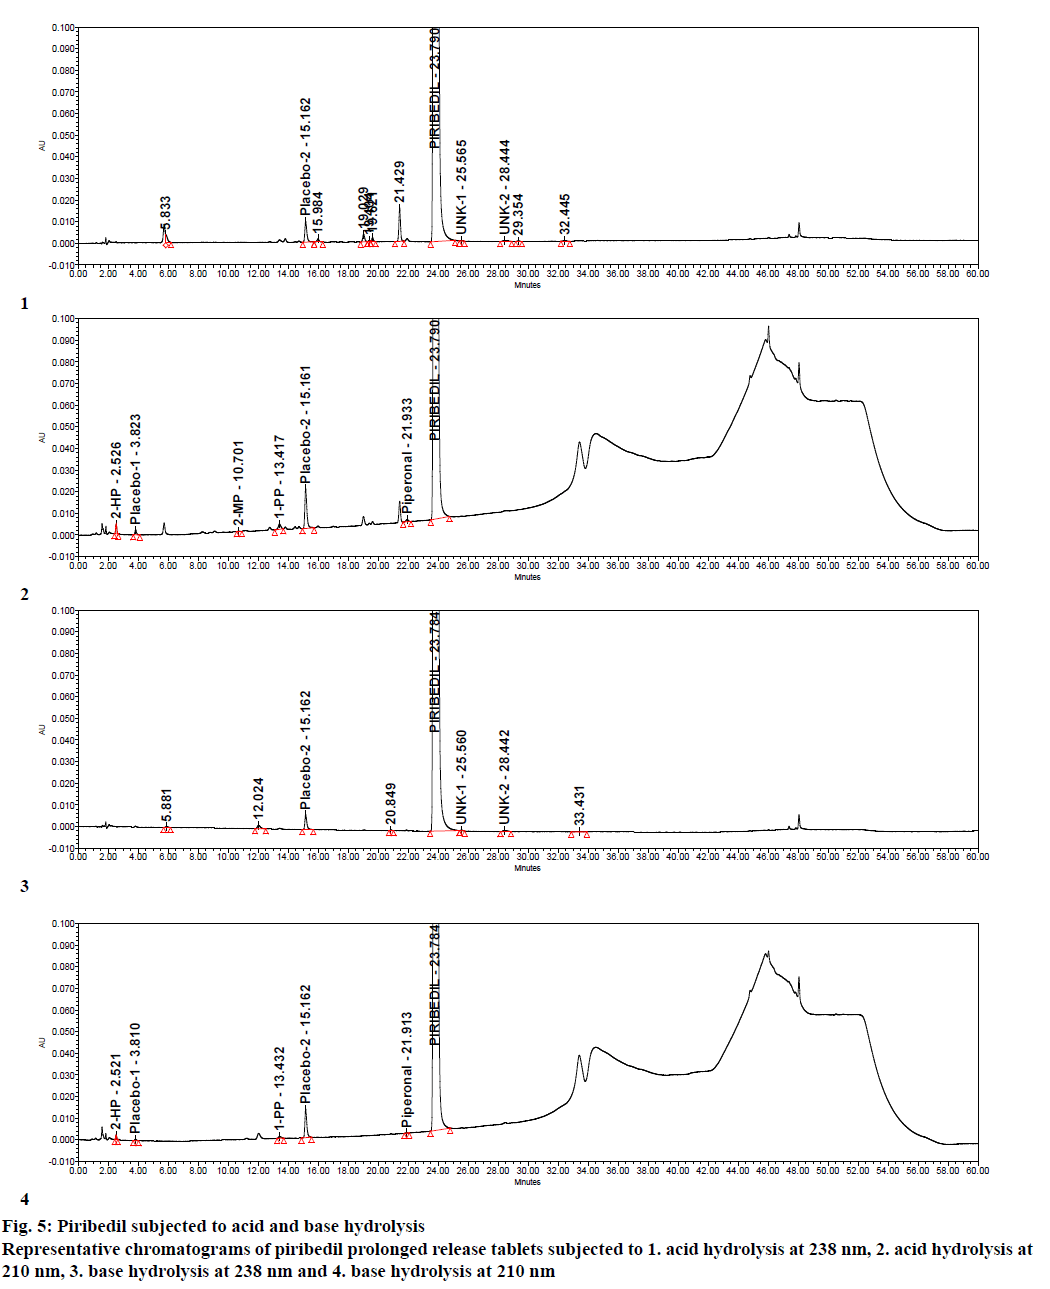
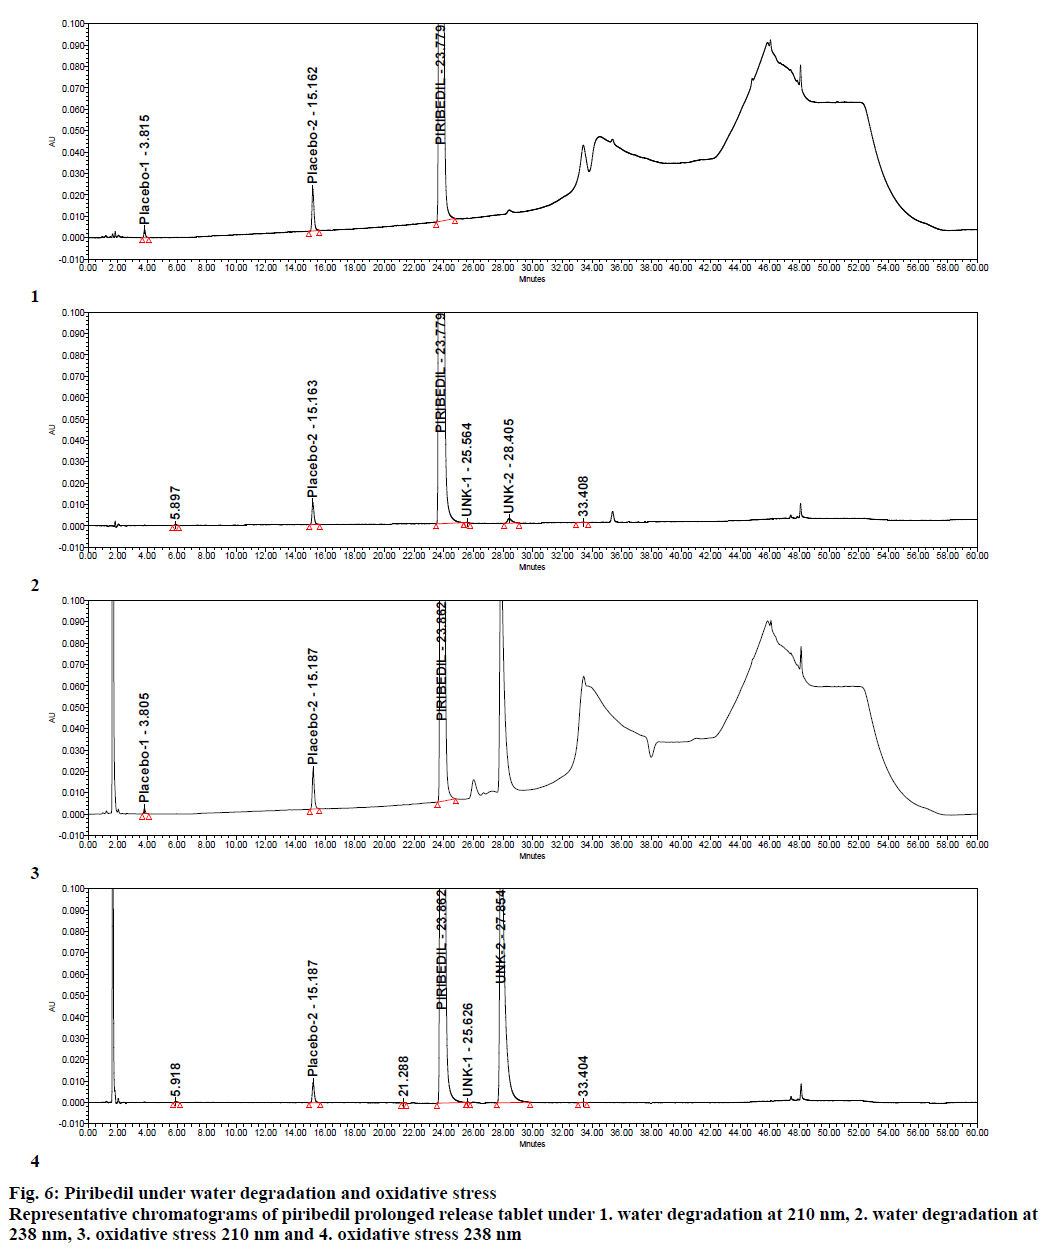
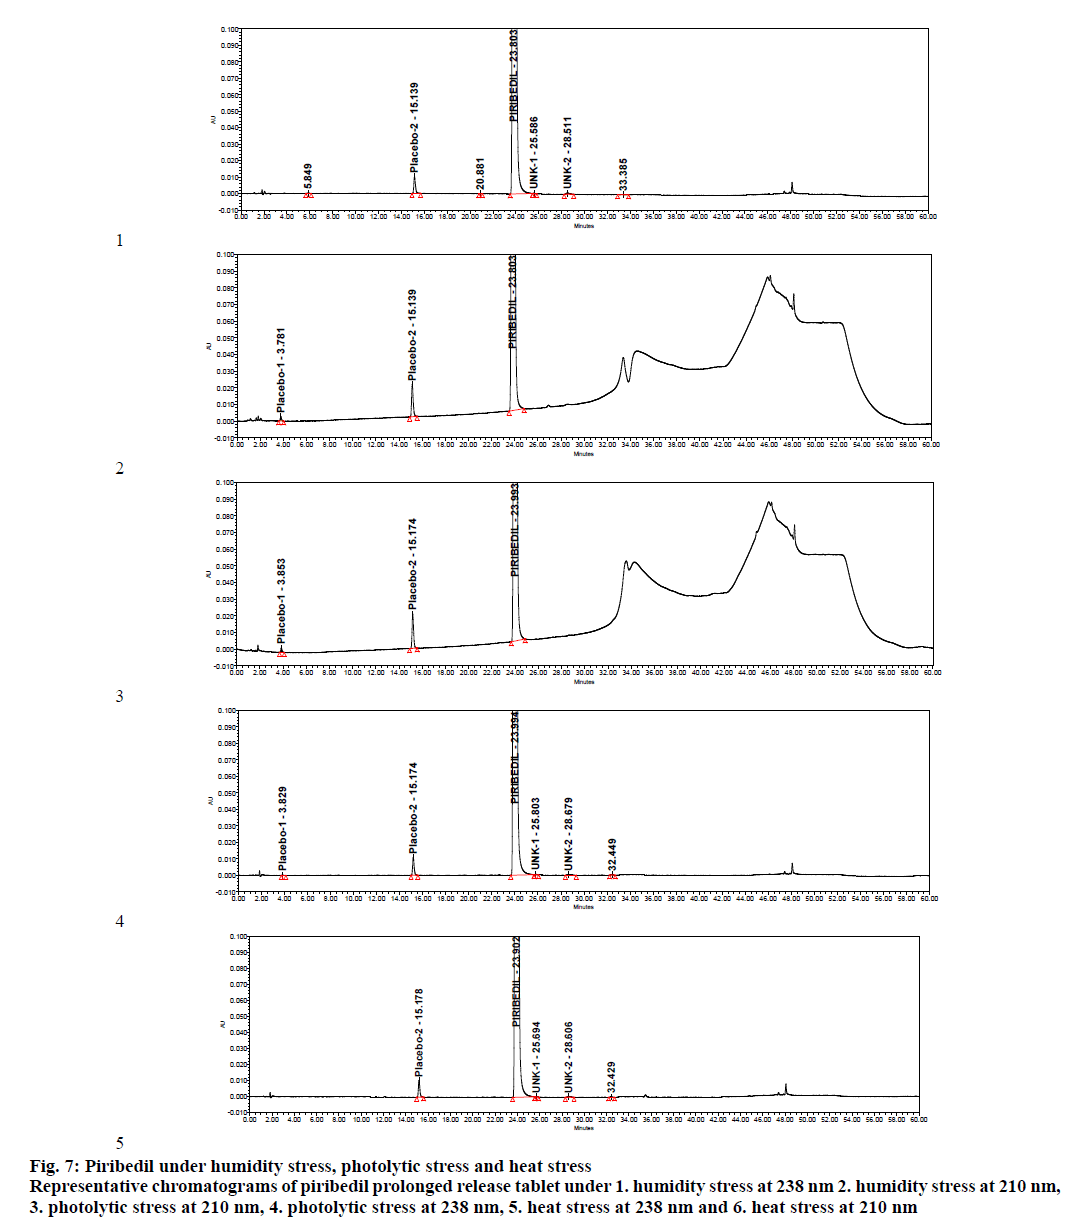
Specificity was demonstrated by doing placebo interference and forced degradation studies. Test solution prepared with placebo (figure. 4) did not show any interference at the retention times of piribedil and its impurities. Piribedil prolonged release tablets and its placebo were subjected to various stress conditions and stressed samples were injected in to HPLC with PDA detector (figures. 5-7). Chromatograms were processed at 210 nm (for known impurities) and 238 nm (for unknown impurities). During forced degradation studies, degradation was observed mainly under oxidative stress. In acid hydrolysis also minor degradation was observed. Under rest of the conditions such as base hydrolysis, water degradation, heat stress, humidity stress and photolytic stress, piribedil was found to be stable. The major degradants observed in oxidative stress was an unknown degradation product with a RRT of 1.17. During real-time stability this degradation product was not observed hence it was not further identified. As piribedil contained nitrogen, it could be the corresponding N-oxide derivative.
Figure 7: Piribedil under humidity stress, photolytic stress and heat stress Representative chromatograms of piribedil prolonged release tablet under 1. humidity stress at 238 nm 2. humidity stress at 210 nm, 3. photolytic stress at 210 nm, 4. photolytic stress at 238 nm, 5. heat stress at 238 nm and 6. heat stress at 210 nm
Stressed sample chromatograms were assessed for peak purity using Empower networking software. Purity angle for piribedil peak was found less than the purity threshold in all the stressed samples at both the wavelengths (210 and 238 nm). It proved that piribedil peak was pure and did not have any coelution. Stressed placebo test solution also did not show any peak at the retention time of piribedil and its impurities. Mass balance was calculated for all the stressed samples by summing up the assay of stressed sample and the total impurities in stressed sample. Mass balance was found > 98% in all the stressed sample (Table 4). Percent mass balance = (% assay of stressed sample+total impurities of stressed sample)/assay of unstressed sample. Based on this, it could be concluded that the proposed method is stability-indicating and was specific for estimating impurities in piribedil prolonged release tablets.
| Stress | Purity Angle | Purity threshold | Purity Flag | %Net Degradation | %Mass Balance | ||
|---|---|---|---|---|---|---|---|
| 210 nm | 238 nm | 210 nm | 238 nm | ||||
| Acid hydrolysis | 0.040 | 0.052 | 0.227 | 0.234 | No | 1.21 | 101.5 |
| Base hydrolysis | 0.086 | 0.088 | 0.224 | 0.229 | No | 0.22 | 102.5 |
| Oxidative stress | 0.086 | 0.087 | 0.223 | 0.228 | No | 12.07 | 100.6 |
| Water hydrolysis | 0.095 | 0.098 | 0.226 | 0.231 | No | 0.11 | 98.2 |
| Thermal stress | 0.095 | 0.097 | 0.228 | 0.231 | No | Nil | 101.7 |
| Humidity stress | 0.090 | 0.089 | 0.221 | 0.225 | No | Nil | 100.5 |
| Photolytic stress | 0.085 | 0.086 | 0.215 | 0.218 | No | Nil | 99.8 |
Table 4: Summary of forced degradation results.
Linearity study was performed to demonstrate that detector response is linear for piribedil and its impurities across the method range. Linearity study was performed from Limit of quantification level to 0.3 % level (150 % of the specification, 0.2 %). Peak area of piribedil and impurities such as 2-hydroxypyrimidine, 2-chloropyrimidine, 2-methoxypyrimidine, 1-piperonylpiperzine and piperonal, from various linearity solutions were plotted against the concentration. Correlation coefficient, intercept, slope and % bias at 100 % level were calculated for piribedil and its impurities. Correlation coefficient was found > 0.998 for all the impurities (Table 5).
| Impurity | Precision (% RSD, n=6) | Intermediate Precision (%RSD, n=6) | Correlation coefficient | Intercept (a) | Slope (b) | % bias at 100 % level |
|---|---|---|---|---|---|---|
| Impurity 2-HP | 0.6 | 2.1 | 0.999 | 251.76 | 50040 | 0 |
| Impurity 2-CP | 1.3 | 1.5 | 0.999 | 375.96 | 35619 | 1 |
| Impurity 2-MP | 1.4 | 3.8 | 0.999 | 582.09 | 376.41 | 2 |
| Impurity 1-PP | 1.7 | 1.2 | 0.999 | 918.55 | 32384 | 3 |
| Impurity P | 2.1 | 4.0 | 0.999 | 449.50 | 36805 | 1 |
Table 5: Precision intermediate precision and linearity.
Repeatability and Reproducibility studies were performed to show that the method is precise for estimation of impurities in piribedil prolonged release tablets. In repeatability study, 6 test solutions were prepared by spiking 2-hydroxypyrimidine, 2-chloropyrimidine, 2-methoxypyrimidine, 1-piperonylpiperzine and piperonal in piribedil prolonged release tablets to get 0.2 % of each impurity. Samples were injected in to HPLC and chromatograms were processed at 210 nm. Percent impurity, mean % impurity and % RSD were calculated for each impurity from six sample preparations. Percent RSD was found < 2.2 for all the impurities against a limit of not more than 15.0 % (Table 5).
Reproducibility was performed by preparing and injecting piribedil test solution spiked with impurities at specification level and performing analysis on different days by using different HPLC and HPLC column.
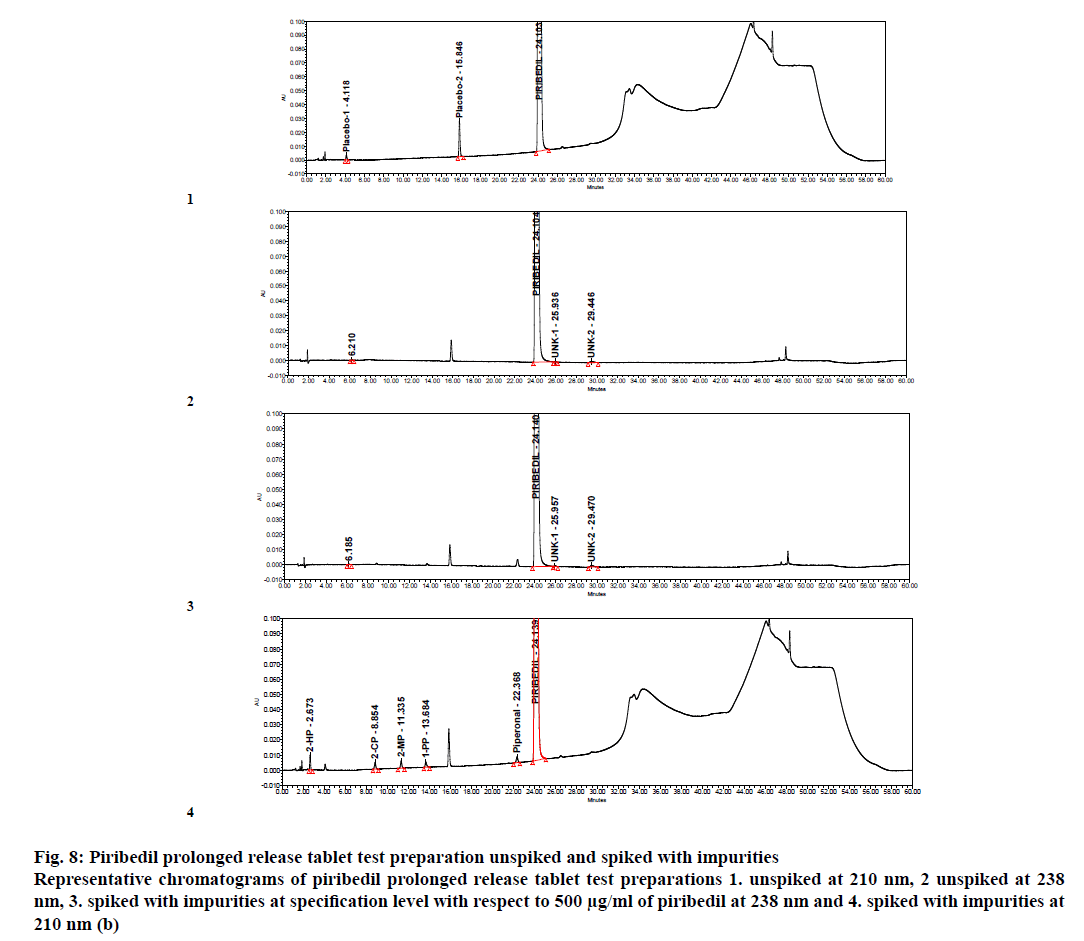
Percent impurities, mean % impurities and % RSD were calculated from six reproducibility samples. Maximum % RSD was observed <4.1 for all the impurities (Table 5). Specimen chromatogram of piribedil test solution spiked with impurities at specification level is given in figure. 8.
Figure 8: Piribedil prolonged release tablet test preparation unspiked and spiked with impurities
Representative chromatograms of piribedil prolonged release tablet test preparations 1. unspiked at 210 nm, 2 unspiked at 238 nm, 3. spiked with impurities at specification level with respect to 500 μg/ml of piribedil at 238 nm and 4. spiked with impurities at 210 nm (b)
Accuracy study was performed at 0.05, 0.2 and 0.4% levels (25 to 200 % of specification) by spiking the piribedil impurities, 2-hydroxypyrimidine, 2-chloropyrimidine, 2-methoxypyrimidine, 1-piperonylpiperzine and piperonal on piribedil prolonged release tablets. Three samples were prepared at each recovery level. Individual % recovery was found between 91.8 and 107.4 for all the impurities whereas mean % recovery was ranging from 95.2 and 104.9 (Table 6).
| Impurity | LOQ Level | 25 % level | 100 % level | 200 % level |
|---|---|---|---|---|
| Impurity 2-HP | 102.0±0.0 | 103.4±3.5 | 104.3±0.6 | 102.1±1.1 |
| Impurity 2-CP | 98.2±6.4 | 103.3±0.0 | 104.0±1.6 | 104.9±1.3 |
| Impurity 2-MP | 97.9±4.9 | 102.4±6.3 | 104.0±0.9 | 101.3±1.4 |
| Impurity 1-PP | 97.3±5.5 | 95.2±4.8 | 102.3±2.6 | 101.9±2 |
| Impurity E | 99.2±2.4 | 95.3±1.9 | 101.3±3.0 | 95.3±2.1 |
Table 6: Recovery results.
LOD and LOQ were established for piribedil and 2-hydroxypyrimidine, 2-chloropyrimidine, 2-methoxypyrimidine, 1-piperonylpiperzine and piperonal using the signal to noise ratio method. The concentration at which s/n ratio was found about 3 was decided as LOD and at which concentration the s/n ratio was observed about 10, was finalized as LOQ. LOD, LOQ and s/n ratio of piribedil impurities are given in Table 7. Precision and accuracy at LOQ were also performed and % RSD was found to be <9.0% for 2-hydroxypyrimidine, 2-chloropyrimidine, 2-methoxypyrimidine, 1-piperonylpiperzine and piperonal impurities. LOQ accuracy results are summarized in Table 6 whereas LOQ precision results are summarized in Table 7.
| Impurity | LOD (%)f | LOQ (%)f | s/n ratio | Precision at LOQ (%RSD, n=6) | |
|---|---|---|---|---|---|
| LOD | LOQ | ||||
| Impurity 2-HP | 0.004 | 0.014 | 2.9 | 10.3 | 3.6 |
| Impurity 2-CP | 0.010 | 0.026 | 3.0 | 9.8 | 6.8 |
| Impurity 2-MP | 0.009 | 0.019 | 2.2 | 10.4 | 6.4 |
| Impurity 1-PP | 0.013 | 0.025 | 2.4 | 11.1 | 8.5 |
| Impurity P | 0.009 | 0.028 | 3.1 | 9.6 | 3.9 |
Table 7: LOD/LOQ and precision at LOQ data.
Deliberate changes were made in the chromatographic parameters such as column flow, and column oven temperature and in mobile phase that included pH of buffer, mobile phase B composition. Impact of these changes was studied on chromatographic separation and system suitability parameters. System suitability was meeting the acceptance criteria in all the robustness conditions. No significant change was observed in the RRT of impurities in the deliberately changed conditions. Summary of Robustness results is given in Table 8.
| System suitability parameters observed | |||||||
|---|---|---|---|---|---|---|---|
| Condition | At 210 nm | At 238 nm | |||||
| USP tailing =2.0 | Area (RSD %, n=3, =5.0) |
USP plate counts =20000 | USP Tailing =2.0 | Area (RSD %, n=3, =5.0) |
Plate count =20000 | s/n ratio NLT 40 |
|
| Column temperature 40º | 1.0 | 2.2 | 153451 | 1.0 | 2.3 | 167326 | 95 |
| Column temperature 45º | 1.0 | 3.1 | 161245 | 1.0 | 4.1 | 169734 | 92 |
| Column temperature 50º | 1.0 | 1.5 | 160245 | 1.0 | 1.5 | 170356 | 98 |
| Column flow 0.8 ml/min | 1.0 | 1.8 | 159832 | 1.0 | 1.8 | 168378 | 83 |
| Column flow 1.0 ml/min | 1.0 | 4.1 | 162346 | 1.0 | 1.6 | 169236 | 94 |
| Column flow 1.2 ml/min | 1.0 | 2.5 | 170823 | 1.0 | 3.1 | 171252 | 99 |
| pH 4.2 | 1.0 | 1.9 | 170267 | 1.0 | 1.9 | 170732 | 89 |
| pH 4.3 | 1.0 | 0.9 | 169523 | 1.0 | 1.4 | 169892 | 91 |
| pH 4.5 | 1.0 | 1.1 | 168621 | 1.0 | 2.1 | 167390 | 85 |
| Acetonitrile 90 % | 1.0 | 3.1 | 167912 | 1.0 | 1.2 | 168029 | 87 |
| Acetonitrile 100 % | 1.0 | 2.6 | 169521 | 1.0 | 2.7 | 169189 | 92 |
| Acetonitrile 110 % | 1.0 | 1.4 | 174821 | 1.0 | 3.2 | 173043 | 98 |
Table 8: Robustness results.
To understand the impact of storage condition on the stability of test solution and mobile phase, piribedil test solution spiked with impurities such as 2-hydroxypyrimidine, 2-chloropyrimidine, 2-methoxypyrimidine, 1-piperonylpiperzine and piperonal was prepared and kept under controlled room temperature (25±2°) and in a refrigerator (5±3°). Piribedil Test solution was found stable for 48 h at 25±2°. Similarly mobile phase was also found to be stable for 48 h at 25±2°.
A simple, specific, stability indicating, dual wavelength HPLC method was developed for estimation of impurities in piribedil prolonged release tablets by adopting QbD approach. The proposed method was validated as per ICH guideline Q2 (R1); Guidelines for validation of analytical procedures. Being a HPLC method, it does not require any sophisticated instrumentation and can be used as quality control tool for analysis of piribedil prolonged release tablets.
Acknowledgements
The author would like to thank the Management of Dr. Reddy’s Laboratories for providing the facility and required materials such as piribedil prolonged telease tablets 50 mg and impurities, to perform this research work.
Conflict of Interest
Authors declare no conflicts of interest.
References
- Aravind M. Piribedil: Antiparkinsonian Properties and Potential Clinical Utility in Dopaminergic Disorders. Current Drug Therapy 2011;6:17-34.
- Toshio N. A worldwide yearly survey of new data in adverse drug reactions and interactions. Side Effects of Drugs Annual 2014;35:2-1044.
- Substance information Mol. formula: C16H18N4O2, Piribedil.
- Rohith KBV, Ramana GV, Latha NM, Supriya P, Harini U, Pawar AKM. Development and validation of stability indicating reverse phase high-performance liquid chromatographic method for the estimation of piribedil in bulk drug. Asian J Pharm Clin Res 2016;9:342-6.
- Mohan TSSJ, Varma DP, Bhavyasri K, Prasa K. Development and validation of piribedil in tablet dosage form by HPLC: A QbD and OFAT approach. Asian J Chem 2017;29(5):1113-8.
- Ibrahim H. Chemically, modified carbon paste electrode for the potentiometric flow injection analysis of piribedil in pharmaceutical preparation and urine. J Pharmaceut Biomed 38(4):624-32.
- Issa YM, Hassouna MM, Abdel-Gawad FM, Hussien EM. Poly(vinyl chloride) ion-selective electrodes for Piribedil determination. J Pharmaceut Biomed 2000;23(2-3):493-502.
- Sarati S, Guiso G, Caccia S. Determination of piribedil and its basic metabolites in plasma by high-performance liquid chromatography. J Chromatogr B Biomed Sci Appl 1991;563(2):323-32.
- Uppuluri CT, Dalvi AV, Bommireddy EP, Ravi PR. Development and validation of rapid and sensitive LC methods with PDA and fluorescence detection for determination of piribedil in rat plasma and brain tissues and their pharmacokinetic application. Biomed Chromatogr 2018;32(10):4303.
- Yardimci, Suslu I, Ozalt?n N. Determination of piribedil in pharmaceutical formulations by micellar electrokinetic capillary chromatography. Anal Bioanal Chem 2004;379(2):308-11.
- Demirel M, Buyukkoroglu G, Kalava BS, Yazan Y. Enhancement in dissolution pattern of piribedil by molecular encapsulation with β-cyclodextrin. Methods Find Exp Clin Pharmacol 2006;2 (2):83-8.
- Celik B, Ozdemir S, Demirkoz AB, Uner M. Optimization of Piribedil Mucoadhesive Tablets for Efficient Therapy of Parkinson’s Disease: Physical Characterization and Ex Vivo Drug Permeation through Buccal Mucosa. Drug Dev Ind Pharm 2017;43(11):1-29.
- Celik B, Uner M. Formulation and characterization of Piribedil buccal tablets. 9th Annual European Pharma Congress, June 26-28, 2017 Madrid, Spain.
- Demirel M, Yazan Y, Muller RH, Kilic F, Bozan B. Formulation and in vitro-in vivo evaluation of piribedil solid lipid micro- and nanoparticles. J Microencapsul Micro Nano Carrie 2008;18(3):359-71.
- United States Pharmacopeia/National Formulary, 41st ed. US Pharmacopeial Convention, Rockville MD, 2010.
- ICH, Q3B (R2), Harmonized Tripartite Guideline, Impurities in New Drug Products, Proceedings of the International Conference on Harmonization 2006, Geneva.
- ICH, Q2 (R1), Harmonized Tripartite Guideline, Validation of Analytical Procedures: Text and methodology, Proceedings of the International Conference on Harmonization 1994, Geneva.
