- *Corresponding Author:
- Nazia Khanam
Research Scholar
Faculty of Science and Technology (Pharmacy)
Dr. Babasaheb Ambedkar Marathwada University
Aurangabad, Maharashtra 431004, India
E-mail: nazia.khanam7@gmail.com
| Date of Received | 09 May 2020 |
| Date of Revision | 06 August 2021 |
| Date of Acceptance | 04 February 2022 |
| Indian J Pharm Sci 2022;84(1):150-161 |
This is an open access article distributed under the terms of the Creative Commons Attribution-NonCommercial-ShareAlike 3.0 License, which allows others to remix, tweak, and build upon the work non-commercially, as long as the author is credited and the new creations are licensed under the identical terms
Abstract
The optimized microspheres were fabricated as a controlled release system for aceclofenac incorporating polymeric cross-linking with sodium alginate as natural, hydrophilic polymer and Eudragit RS100 synthetic, hydrophobic polymer by ion-gelation technique. The method was optimized by Box Behnken design incorporating concentration of pure drug, natural and synthetic polymer along with the obtained responses that were mean particle size (Y1) and entrapment efficiency of drug (Y2). Microspheres were characterized for percentage yield, micromeritic evaluation, particle size, entrapment efficiency of drug, in vitro study, fourier transform infrared spectroscopy, scanning electron microscopy, nuclear magnetic resonance and high performance liquid chromatography quantification of optimized formulation. It was observed that application of response surface method software for Box Behnken design yielded stable and spherical microspheres with mean particle size 69.37 μm and entrapment efficiency of drug 79.86 % for the most optimized formulation F5. We can conclude that bridging of aceclofenac with natural and synthetic polymers yielded stable, cost effective microspheres bearing enhanced micromeritic properties with controlled release effect.
Keywords
Aceclofenac, Box-Behnken design, controlled release system, ion-gelation, nuclear magnetic resonance
Medicines used in treatment of acute or chronic ailments leads to fluctuating drug level in the body, this drug fluctuation should be prevented by administering the drug using Controlled Release (CR) system and maintaining optimum therapeutic drug level within the body. An ideal CR system is the one that releases the drug at a predetermined rate, locally or systemically, for specified time period with improved bioavailability. The drugs having short elimination half-life were selected as most acceptable candidates for CR formulations[1,2]. In present research work we had tried to develop and characterize a CR system with improved micromeritic properties of pure drug by formulating microspheres, that are solid, approximately spherical particles (1-1000 μm) containing uniform distribution of drug and polymers, either in matrix or encapsulated form[3].
Aceclofenac is a novel, Non-Steroidal Anti-Inflammatory Drug (NSAID) wielded in therapy and control of pain and inflammation caused due to rheumatoid arthritis, osteoarthritis and spondylitis, chemically it is a phenyl acetic acid derivative [2-(2’,6’-dichlorophenyl)amino] phenylacetoxyacetic acid with half-life value of about 0-4 h. The major disadvantage of using NSAID drug repeatedly leads to severe upper Gastrointestinal (GI) effects like GI bleeding and ulceration, so repeated use of aceclofenac can be minimized by reducing dosing frequency, achieved by incorporating aceclofenac as a CR system by microspheres formulation using a combination of various available polymers[4,5]. Microspheres preparation involves drug incorporated in single or multiple combinations of natural, semisynthetic or synthetic polymers. In this formulation development we had tried to select a combination of natural and synthetic polymer with drug to prepare the CR system with polymeric cross-linking. Among various available drug delivery system, microspheres fabrication has been selected as a method of priority due to enhanced drug absorption because of micron size particles and avoidance of dose dumping. From the vast ocean of polymers available, sodium alginate was selected as most worthy candidate as it is natural and hydrophilic polymer along with Eudragit RS100 as the synthetic polymer. Alginate is a linear polysaccharide extracted from brown sea weed with biocompatible and biodegradable properties; commercially it is available as sodium alginate, with distinctive solhydrogel transformation behavior after coming in contact with water[6]. Eudragit RS100 polymer comes under the category of enteric acrylic resins bearing negative charge, synthesized from methacrylic acid and methacrylic acid methyl ester. It is copolymer of poly(ethylacrylate, methyl-methacrylate and chlorotrimethyl-ammonioethyl methacrylate). Eudragit RS100 is water insoluble in nature with functional quaternary ammonium group[7,8]. The selected natural polymer of current research has unique property of gel formation in aqueous environment on reaction with calcium ions, due to binding of calcium ions with blocks of adjacent alginate chains forming inter-ionic bridges. So, fabrication of microspheres was done by iongelation technique using natural and synthetic polymers for poorly water-soluble drug aceclofenac, due to their non-toxicity, ease of fabrication, high drug entrapment efficiency rate and economical method[9-12]. The present research study involved fabrication and characterization of aceclofenac microspheres using natural and synthetic polymers by employing response surface methodology and implementing Box-Behnken Design (BBD), as till date there is no such method available in literature that incorporates present employed parameters together. There were numerous quality by design techniques available for experimental designs including statistical techniques to improve quality of drug products as well as enhancement of existing products quality without any further increase in production cost by analyzing different process and formulation factors influencing the formulation development process. BBD was selected from the ocean of various available experimental designs and applied to statistically optimize the formulation to enhance entrapment efficiency and CR of aceclofenac in this study. The selected variables were aceclofenac concentration (A), sodium alginate concentration (B) and Eudragit RS100 concentration (C), along with selected response variables as mean particle size (Y1) and entrapment efficiency (Y2) of drug in fabricated microspheres with predetermined level values for these variables estimated by trails according to factorial design[13]. Finally, when the design was framed, the formulation was preceded further by implementing 2n factorial design. The present BBD optimized fabricated microspheres were evaluated for micromeritic properties, surface study performed by Scanning Electron Microscopy (SEM), in vitro drug release profile, entrapment efficiency of drug, drug polymer interaction analysis by Fourier Transform Infrared Spectroscopy (FTIR), Proton (H1) Nuclear Magnetic Resonance (NMR) based quantification and content uniformity in fabricated microspheres by High Performance Liquid Chromatography (HPLC).
Materials and Methods
Chemicals and reagents:
Aceclofenac was obtained from Hetero Healthcare Ltd, India; sodium alginate was obtained from Signet chemical Co, India; Eudragit RS100 was purchased from Natco, Hyderabad, India; calcium chloride was received from Aristo, India. All chemicals were of HPLC and analytical grade.
Method of fabrication:
Ionic-gelation technique was used to fabricate optimized microspheres of aceclofenac by incorporating natural and synthetic polymers. Initially, specified quantity of natural polymer, sodium alginate was taken and dissolved in adequate quantity of distilled water to prepare homogeneous solution with the help of magnetic stirrer (REMI 5 MLH, Thane, India). Then optimum concentration of Eudragit RS100 was incorporated to homogeneous polymer solution for various formulations. Finally, specified quantity of pure drug, aceclofenac was adjoined to it and stirred continuously with assistance of magnetic stirrer to form uniform, viscous drug-polymer dispersion. Then, this obtained dispersion was added drop wise with the help of 24 gauge needle to 5 % calcium chloride solution (500 ml) with continuous stirring at 250 revolutions per minute for half an hour. The resulted mixture was then filtered through 0.45 μm filter and the resultant product was dried at 40° for 12 h and finally collected.
Experimental design:
Formulation and characterization of CR microspheres was statistically optimized by BBD for various formulation parameters like maximum drug entrapment efficiency of microspheres and mean particle size. This research was executed by optimization of aceclofenac microspheres through response surface methodology by applying BBD and using Design Expert 12.0.7.0 software (Stat-Ease Inc., United States of America), with quadratic design model that yielded 17 experimental runs for present data[14,15]. The second order polynomial equation was used in evaluation of all response variables by using following equation:

Where, B0, B1, B2 and B3 were regression coefficient, X1, X2 and X3 were the factors studied and Y was the obtained response corresponding to each factor. Finally, Analysis of Variance (ANOVA) was applied to obtain significant difference from design matrix.
Physical characterization of aceclofenac loaded microspheres comprising natural and synthetic polymers:
Percentage yield: The obtained yield of all fabricated microspheres was estimated on weight basis with respect to initial weight of material.
Micromeritic estimation: The micromeritic estimation of aceclofenac loaded microspheres with natural and synthetic polymers was performed by determining bulk density, tapped density, Carr’s index, Hausner’s ratio and angle of repose. Bulk density apparatus from Electro Lab India, was used to determine bulk density and tapped density, whereas angle of repose was calculated by fixed base cone method.
Particle size determination: Aceclofenac loaded microspheres were accurately determined by optical microscopic method using calibrated stage micrometer.
Entrapment efficiency of drug:
The quantity of pure drug aceclofenac practically loaded in fabricated microspheres was estimated using 100 mg of prepared formulation in 50 ml of phosphate buffer (pH=6.8) in volumetric flask then kept on sonicator at 125 W (Imeco sonofier, Imco ultrasonics, India) for 0-2 h to mix uniformly, finally the volume was made up to 100 ml by adding buffer, then again this flask was kept on sonicator for 1 h and kept as it is overnight for extraction of drug from microspheres. Then the solution was passed through 0.45 μm membrane filter to collect the filtrate. The respective dilutions were made from this stock solution and absorbance was measured at 273 nm employing Ultraviolet (UV)-visible spectrophotometer (UV-2450 Shimadzu, Japan) against blank. The method was repeated three times by using formula: Percentage (%) Entrapment efficiency of drug=(Calculated drug content/theoretical drug content)×100.
In vitro drug release analysis:
Estimation of release pattern from aceclofenac fabricated microspheres through natural and synthetic polymers was executed through in vitro drug release analysis by using the dissolution apparatus comprising of United States Pharmacopeia (USP) six stage apparatus I (Thermolab, India), with number of revolutions fixed at 50/min and at 25 cm depth. Initially, the analysis was carried at 0.1 N Hydrochloric Acid (HCl) with 900 ml fluid and then at pH 6.8 with phosphate buffer by maintaining the temperature at 37°±0.2° at 273 nm wavelength. The analysis was performed by weighing accurately sufficient quantity of fabricated microspheres equivalent to 100 mg of drug, with 5 ml of samples withdrawn at stipulated time interval and replaced each time with similar quantity of fresh dissolution medium. The withdrawn sample was filtered through Whatman grade 1 filter paper and diluted to estimate Aceclofenac at 273 nm through spectroscopy against blank solution. The quantity of drug was estimated through calibration curve and release studies were performed in triplicate.
FTIR analysis:
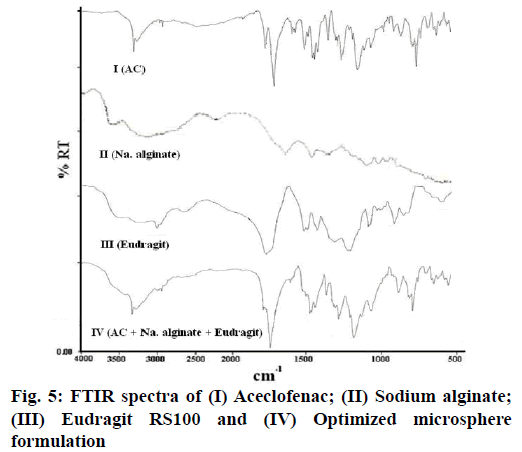
The detection of any possible interaction between pure drug, pure polymers and the prepared aceclofenac loaded microspheres were scanned through FTIR spectra by using Perkin-Elmer FTIR (spectrum RX)[16].
SEM analysis:
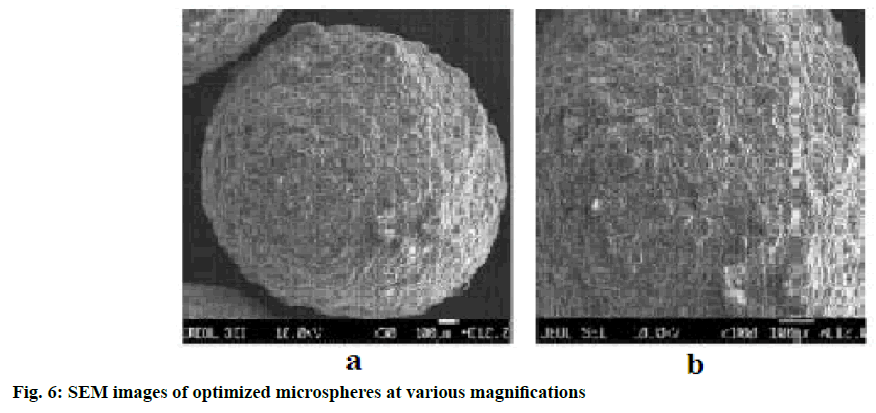
The estimation of surface morphology with respect to surface topography was performed by SEM (JSM 5610 LV SEM, JEOL, Japan). The photographs obtained after several magnifications were analyzed for surface analysis.
NMR analysis:
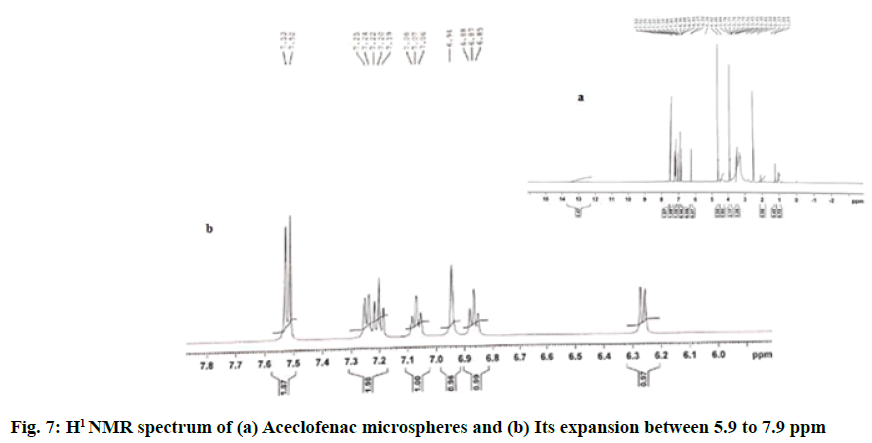
The compatibility analysis of fabricated aceclofenac microspheres with incorporated polymers was performed by using H1 NMR spectroscope (ECX 400 JOEL, Japan) working at 500 MHz and 300 K with Dimethyl Sulfoxide (DMSO-d6) as solvent and Tetramethylsilane (TMS) as internal standard were used for estimation of chemical shift in this experiment[17].
HPLC analysis:
The actual entrapment of aceclofenac drug in optimized polymeric cross-linked fabricated microspheres was analytically evaluated by HPLC method validation.
Instrumentation and chromatographic conditions: A novel, specific and stable reverse phase-HPLC method was developed and validated by Agilent 1100 series equipped with auto sampler having a variable volume (1-200 μl) injector with Empower 3 software, Cosmosil C18 (4.6×150 mm×5 μ) column with a flow rate of 1.5 ml/min, injection volume 10 μl and UV-detection at 290 nm. The mobile phase comprised of 0.5 % solution of trifluoroacetic acid as a buffer and acetonitrile in the ratio of 48:52 (v/v).
Standard preparation: The quantitative estimation of aceclofenac was performed by using a diluent, methanol for dissolving samples in entire experiment. Aceclofenac standard solution was prepared by dissolving about 20 mg of aceclofenac in 25 ml of diluent (800 μg/ml).
Sample preparation: The assay sample of aceclofenac loaded microspheres was prepared by taking about 20 mg of equivalent powdered microspheres of most optimized formulation, F5 and then transferred to 25 ml volumetric flask. To this added 10 ml of the diluent and sonicated for 20 min with intermediate shaking, the solution was then diluted to 25 ml with diluent and centrifuged at 2500 rpm for 10 min. The supernatant was collected, filtered through 0.2 μ filter and used as the sample solution to determine assay.
Linearity and range: Five standard solutions of aceclofenac standard were prepared by taking concentration levels from 60 % to 140 % of test concentration and then each injected solution was injected to confirm the linearity. Peak area was recorded and for all the peaks a calibration plot was constructed by plotting peak area against concentrations of aceclofenac which was found to be linear in the range of 200 μg/ml-1200 μg/ml and coefficient of correlation was determined.
Accuracy: It was estimated at various levels ranging from 50 %, 100 % and 150 % of test concentration by incorporating aceclofenac microspheres standard solution and then it was added to placebo. All solutions were injected in triplicate and the method accuracy was determined by spiking known quantity of aceclofenac with placebo at 50 %, 100 % and 150 % of test concentration three times the observed result was analyzed as per the proposed method.
Precision: The precision of an analytical method is usually expressed as the standard deviation or relative standard deviation.
System suitability: It was performed to confirm the performance of the system, system precision was determined on five replicate injections of standard preparation, all essential chromatographic characteristics, including the relative standard deviation, peak tailing and theoretical plate number were measured. These system suitability parameters covered the system, method and column performance[18].
Results and Discussion
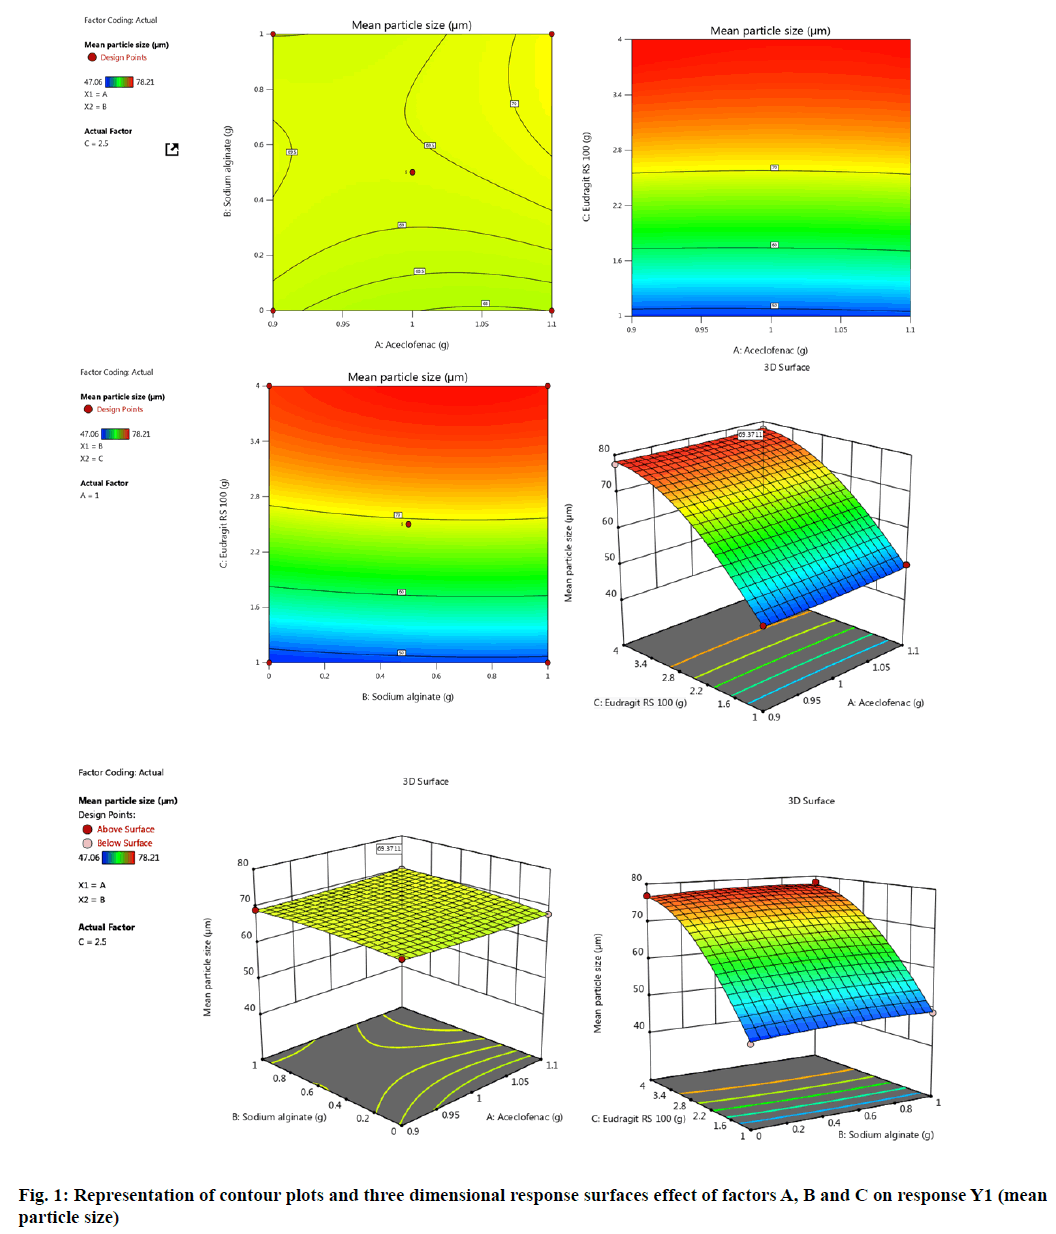
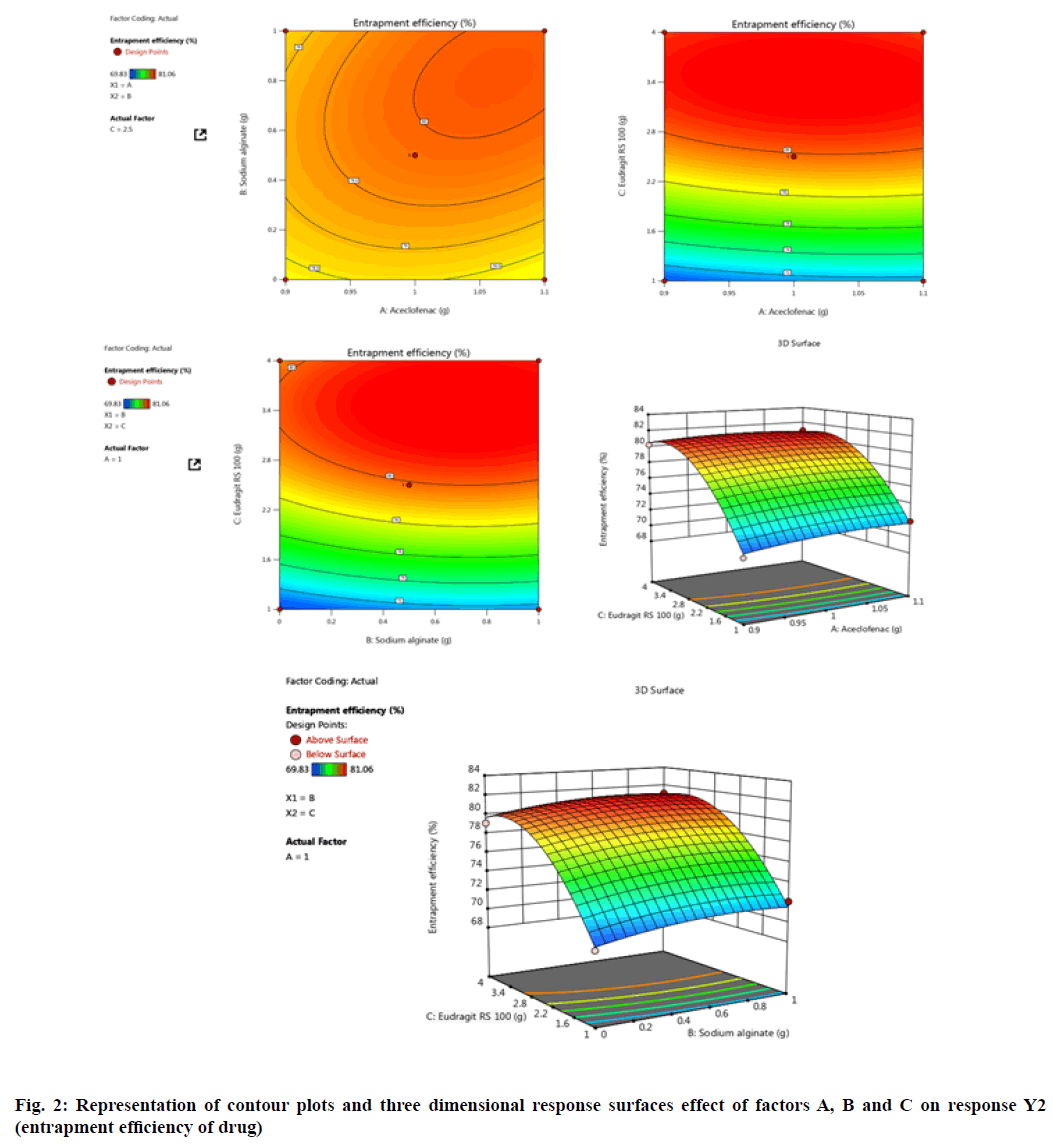
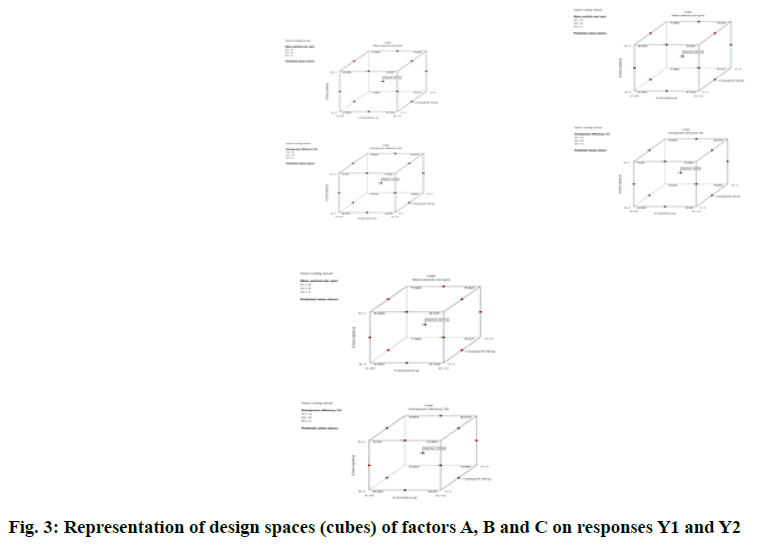
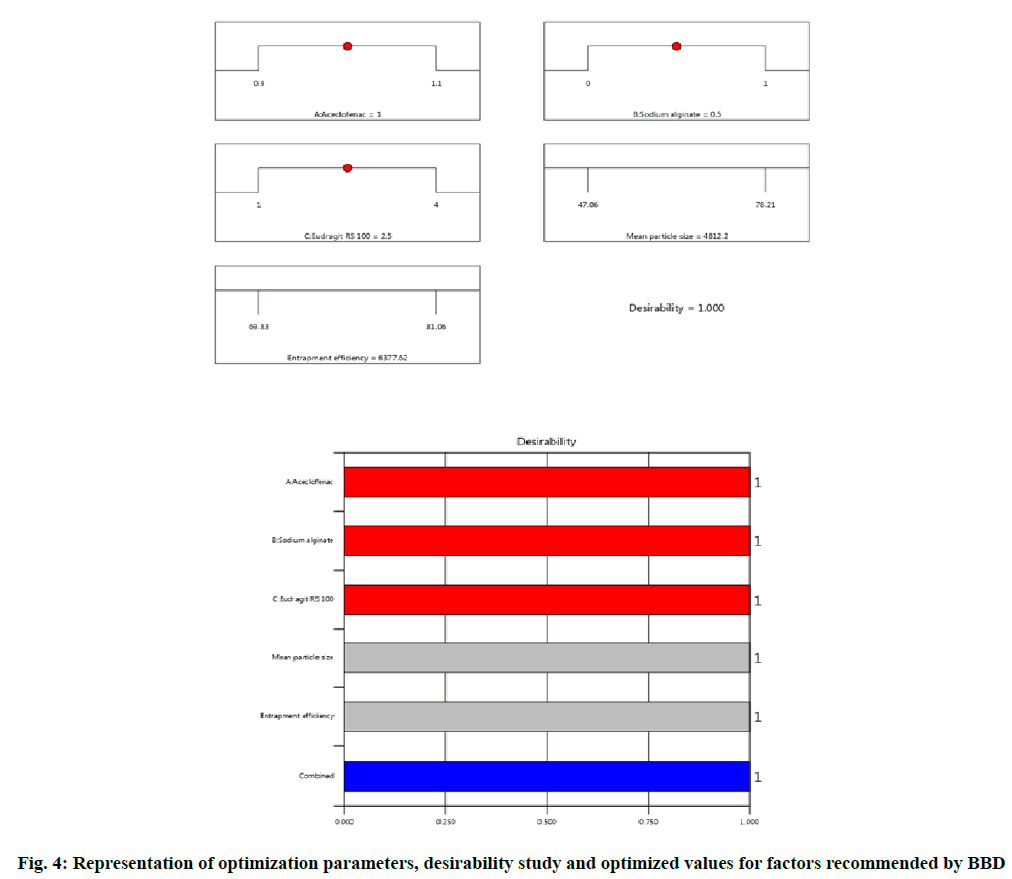
Experimentally designed and statistically optimized cross-linked aceclofenac loaded microspheres with natural and synthetic polymers were fabricated by implementation of optimized parameters as shown in Table 1 and Table 2. The values obtained from design for all three factors A, B and C with their corresponding responses Y1 and Y2 were explained by fig. 1-fig. 4. ANOVA was applied to obtain significant difference from design matrix and the observed data obtained after application of ANOVA was shown in Table 3 and Table 4 with fit statistics data represented in Table 5. The observed values for micromeritic estimation of fabricated microspheres were shown in Table 6, drug release profile from microspheres in Table 7 and HPLC data in Table 8.
| Factor | Name | Units | Minimum | Maximum | Low level | High level | Mean | Standard deviation |
|---|---|---|---|---|---|---|---|---|
| A | Concentration of aceclofenac | g | 0.9000 | 1.10 | -1↔0.90 | +1↔1.10 | 1.0000 | 0.0707 |
| B | Concentration of sodium alginate | g | 0.0000 | 1.0000 | -1↔0.00 | +1↔1.00 | 0.5000 | 0.3536 |
| C | Concentration of Eudragit RS100 | g | 1.0000 | 4.0000 | -1↔1.00 | +1↔4.00 | 2.50 | 1.06 |
Note: *Mean±standard deviation, n=3
Table 1: Data Representing Optimized Parameters and Investigated Range for Aceclofenac Loaded Microspheres Formulation
| Standard | Run | Factor 1=A | Factor 2=B | Factor 3=C | Response Y1 | Response Y2 |
|---|---|---|---|---|---|---|
| 13 | 1 | 1.0 | 0.5 | 2.5 | 69.37 | 79.86 |
| 06 | 2 | 1.1 | 0.5 | 1.0 | 49.96 | 71.84 |
| 04 | 3 | 1.1 | 1.0 | 2.5 | 70.01 | 79.23 |
| 17 | 4 | 1.0 | 0.5 | 2.5 | 69.37 | 79.86 |
| 03 | 5 | 0.9 | 1.0 | 2.5 | 69.04 | 78.59 |
| 15 | 6 | 1.0 | 0.5 | 2.5 | 69.37 | 79.86 |
| 09 | 7 | 1.0 | 00 | 1.0 | 47.06 | 69.83 |
| 02 | 8 | 1.1 | 00 | 2.5 | 67.95 | 78.11 |
| 16 | 9 | 1.0 | 0.5 | 2.5 | 69.37 | 79.86 |
| 12 | 10 | 1.0 | 1.0 | 4.0 | 78.21 | 81.06 |
| 05 | 11 | 0.9 | 0.5 | 1.0 | 49.03 | 70.09 |
| 08 | 12 | 1.1 | 0.5 | 4.0 | 77.83 | 80.91 |
| 11 | 13 | 1.0 | 00 | 4.0 | 76.89 | 79.06 |
| 07 | 14 | 0.9 | 0.5 | 4.0 | 77.51 | 80.23 |
| 01 | 15 | 0.9 | 00 | 2.5 | 69.01 | 79.05 |
| 10 | 16 | 1.0 | 1.0 | 1.0 | 49.61 | 72.07 |
| 14 | 17 | 1.0 | 0.5 | 2.5 | 69.37 | 79.86 |
Note: *Mean±standard deviation, n=3
Table 2: Data Representing BBD Layout with Selected Factors and Obtained Responses
| Source | Sum of squares | DF | Mean square | F value | p value | Probability>F |
|---|---|---|---|---|---|---|
| Model | 7.52 | 9 | 0.8360 | 751.86 | <0.0001 | Significant |
| A | 0.0008 | 1 | 0.0008 | 0.6905 | 0.4334 | |
| B | 0.0122 | 1 | 0.0122 | 11.00 | 0.0128 | |
| C | 06.73 | 1 | 06.73 | 6050.24 | <0.0001 | |
| AB | 0.0037 | 1 | 0.0037 | 03.36 | 0.1095 | |
| AC | 0.0006 | 1 | 0.0006 | 0.5168 | 0.4955 | |
| BC | 0.0003 | 1 | 0.0003 | 0.3097 | 0.5952 | |
| A2 | 0.0018 | 1 | 0.0018 | 01.58 | 0.2496 | |
| B2 | 0.0076 | 1 | 0.0076 | 06.87 | 0.0343 | |
| C2 | 0.7610 | 1 | 0.7610 | 684.48 | <0.0001 | |
| Residual | 0.0078 | 7 | 0.0011 | |||
| Lack of fit | 0.0078 | 3 | 0.0026 | |||
| Pure error | 0.0000 | 4 | 0.0000 | |||
| Cor total | 7.53 | 16 |
Note: DF means degrees of freedom
Table 3: ANOVA Data for Quadratic Model Representing Response Y1 (Mean Particle Size)
| Source | Sum of squares | DF | Mean square | F value | p value | Probability>F |
|---|---|---|---|---|---|---|
| Model | 0.8015 | 9 | 0.0891 | 69.93 | <0.0001 | Significant |
| A | 0.0019 | 1 | 0.0019 | 1.53 | 0.2523 | |
| B | 0.0099 | 1 | 0.0099 | 7.80 | 0.3859 | |
| C | 0.5796 | 1 | 0.5796 | 455.18 | 0.7750 | |
| AB | 0.0020 | 1 | 0.0020 | 1.56 | 0.2114 | |
| AC | 0.0011 | 1 | 0.0011 | 0.8550 | 0.0613 | |
| BC | 0.0001 | 1 | 0.0001 | 0.0883 | <0.0001 | |
| A2 | 0.0024 | 1 | 0.0024 | 1.89 | ||
| B2 | 0.0063 | 1 | 0.0063 | 4.96 | ||
| C2 | 0.1902 | 1 | 0.1902 | 149.37 | ||
| Residual | 0.0089 | 7 | 0.0013 | |||
| Lack of fit | 0.0089 | 3 | 0.0030 | |||
| Pure error | 0.0000 | 4 | 0.0000 | |||
| Cor total | 0.8104 | 16 |
Note: DF means degrees of freedom
Table 4: ANOVA Data for Quadratic Model Representing Response Y2 (Entrapment Efficiency)
| S. No. | Parameters | Response Y1 | Response Y2 |
|---|---|---|---|
| 1 | Standard deviation | 0.0333 | 0.0357 |
| 2 | Mean | 8.12 | 8.81 |
| 3 | R2 | 0.9990 | 0.9890 |
| 4 | Adjusted R2 | 0.9976 | 0.99749 |
| 5 | Predicted R2 | 0.9835 | 0.8240 |
| 6 | Adequate precision | 76.1538 | 22.2456 |
Table 5: Data Representing Fit Statistics
| Formulation code | %Yield | Bulk density | Tapped density | Hausner’s ratio | Carr’s compressibility index | Angle of repose |
|---|---|---|---|---|---|---|
| Pure drug | - | 0.89±0.17 | 1.47±0.08 | 1.65 | 39.45 | 42.86 |
| F1 | 91.7±0.03 | 1.34±0.52 | 1.55±0.21 | 1.15 | 13.54 | 23.73 |
| F2 | 92.3±0.01 | 0.42±0.33 | 0.51±0.05 | 1.21 | 17.64 | 21.91 |
| F3 | 92.8±0.11 | 0.45±0.01 | 0.49±0.37 | 1.08 | 08.16 | 19.51 |
| F4 | 94.1±0.04 | 0.39±0.40 | 0.43±0.02 | 1.10 | 09.30 | 18.76 |
| F5 | 95.3±0.01 | 0.44±0.21 | 0.48±0.63 | 1.09 | 08.33 | 16.89 |
| F6 | 95.9±0.05 | 0.51±0.17 | 0.57±0.41 | 1.11 | 10.52 | 17.67 |
| F7 | 96.4±0.01 | 0.59±0.08 | 0.63±0.08 | 1.06 | 06.34 | 18.72 |
| F8 | 97.9±0.08 | 0.68±0.16 | 0.75±0.66 | 1.13 | 09.33 | 18.48 |
Note: *Mean±standard deviation, n=3
Table 6: Percentage Yield and Micromeritic Parameters of Aceclofenac Loaded Microspheres by Incorporating Natural and Synthetic Polymers
| Formulation code | Correlation coefficient (r2) | Release exponent (n) | |||
|---|---|---|---|---|---|
| Zero order | First order | Higuchi model | Korsmeyer-Peppas model | ||
| F1 | 0.927 | 0.748 | 0.729 | 0.804 | 1.412 |
| F2 | 0.968 | 0.751 | 0.811 | 0.962 | 1.531 |
| F3 | 0.929 | 0.921 | 0.836 | 0.874 | 1.822 |
| F4 | 0.931 | 0.947 | 0.847 | 0.889 | 1.906 |
| F5 | 0.953 | 0.982 | 0.895 | 0.904 | 2.017 |
| F6 | 0.927 | 0.979 | 0.901 | 0.953 | 2.080 |
| F7 | 0.970 | 0.966 | 0.937 | 0.960 | 1.962 |
| F8 | 0.982 | 0.973 | 0.862 | 0.983 | 1.894 |
Table 7: Drug Release Profile for Aceclofenac Loaded Microspheres by Using Natural and Synthetic Polymers
| S. No | Statistical parameter | Aceclofenac |
|---|---|---|
| 1 2 3 4 5 6 7 8 9 10 11 |
Retention time in min Theoretical plate Tailing % Relative standard deviation Accuracy at 40 % Accuracy at 100 % Accuracy at 160 % Concentration range (µg/ml) Correlation coefficient (r2) Slope Intercept |
5.01 5235 1.02 0.12 98.14 98.34 98.03 200-1200 0.999 33008 32.12 |
Table 8: Data Representing System Suitability, Accuracy and Linearity of Aceclofenac Optimized Microspheres
The obtained percentage yield of all fabricated microsphere formulations were found to be good by ionic gelation technique and also indicated a sequential increase in yield value with increase in polymer concentration ranging from 91.7±0.03 to 97.9±0.08. The obtained data was represented in Table 6.
The flow behavior of fabricated aceclofenac microspheres incorporating natural and synthetic polymers were determined by estimating bulk density, tapped density, Carr’s index, Hausner’s ration and angle of repose.
The observed data for bulk and tapped densities indicated that an enhanced flow behavior was obtained through microspheres fabrication as compared to pure drug, as indicated from data of Table 6. The bulk density ranged from 0.39±0.40 to 1.34±0.52 and tapped density from 0.43±0.02 to1.55±0.21.
The data for all fabricated formulations for Carr’s index ranged from 06.34 to17.64, whereas the value for pure aceclofenac was 39.45, hence indicating better flow of microspheres. The values represented in Table 6.
The data for Hausner’s ratio for pure drug was determined to be 1.65, exhibiting very poor flow, whereas for all prepared formulations the values ranged from 1.06 to 1.21, as seen from data of Table 6.
Obtained value of angle of repose for pure aceclofenac drug was 42.86, indicating very poor flow, but values for fabricated aceclofenac loaded microspheres ranged from 16.89 to 23.73, indicating excellent flow on microspheres fabrication with sodium alginate and Eudragit RS100 as natural and synthetic polymers respectively, as represented in Table 6.
It was observed from the obtained data that mean particle size of aceclofenac loaded microspheres ranged between 48.71±0.34 μm to 79.06±0.06 μm for all fabricated formulations. On implementation of BBD to the parameter mean particle size yielded microspheres with spherical surface and the size increased on increasing polymer concentration for all the eight formulations. The mean particle size of 69.37 μm for F5 formulation was obtained with maximum optimization.
The experimental design implemented optimized method yielded the entrapment of drug from (68.02 %±0.05 %) to (80.37 %±0.01 %) for all the formulations. It was observed that on increase in polymer concentration, the entrapment efficiency of formulation also increased due to higher availability of calcium bridging sites available with cross-linking polymer. In present experimentally designed method by BBD, the two selected response were mean particle size and drug entrapment efficiency, so on implementation of selected model for both responses yielded maximum optimized drug entrapment efficiency as 79.86 % for F5 formulation with maximum optimization.
In vitro drug release analysis is shown below. The experimentally designed and optimized aceclofenac microspheres were prepared by ion-gelation technique, using natural and synthetic polymer. The execution of drug release behavior of polymeric interlinked aceclofenac microspheres incorporating natural and synthetic polymers revealed that all preparations were able to control the drug release from 4 to 12 h respectively. It was observed that, drug release was 96.01 % for F1 formulation after 4 h, for F2 it was 95.75 % after 5 h, for F3 it was 93.80 % after 6 h, F4 formulation showed 92.04 % release after 7 h, F5 preparation exhibited 91.84 % release profile after duration of 9 h, F6 showed release of 90.05 % after 10 h, F7 formulation showed release of 91.94 % after 12 h interval, F8 preparation exhibited release of 85.01 % after 12 h, it was observed that on increasing the concentration of synthetic polymer ES, release was decreased. From among all eight preparations, F7 was selected as most optimized preparation representing better drug release and controlling the release of higher than 90 % for 12 h duration. Identification of best fitting models was performed by using coefficient of determination (R2) by placing the data of drug release kinetics. It was observed that for the formulation from F1 to F8 reached greater values for R2 ranging from 0.927 to 0.982 for zero order and release exponent value (n) varied from 1.412 to 2.080. The observed data of Korsmeyer-Peppas model recommended non- Fickian diffusion mechanism for fabricated aceclofenac microspheres, the obtained data was represented in Table 7.
The FTIR analysis was performed by taking samples of pure drug, pure polymers and the fabricated formulation comprising of drug along with both natural and synthetic polymer. It was observed from the obtained spectra that no interaction was present between drug and polymers as no additional peaks were observed, representing stable nature of aceclofenac in formulation, as shown in fig. 5.
The observed data for fabricated microspheres for estimation of surface analysis were analyzed by scanning electron micrographs of microspheres, as shown in fig. 6a and fig. 6b, respectively. It was observed that formulated microspheres were distinct and spherical in structure with outer surface being rough.
The H1 NMR spectra observed for fabricated aceclofenac microspheres yielded prominent resonance peaks at 7.53 ppm and 7.52 ppm, representing double bond at carbon of benzene, the peak at 7.25 ppm represented chlorine group attached to carbon of benzene group, the prominent peak at 6.94 ppm represented attachment of Amino (–NH) group to carbon of benzene. The detailed NMR spectrum of fabricated formulation can be correlated to fig. 7 and it represented that all essential chemical shifts of aceclofenac were retained in the formulation, hence exhibiting no interaction between the aceclofenac and the polymers.
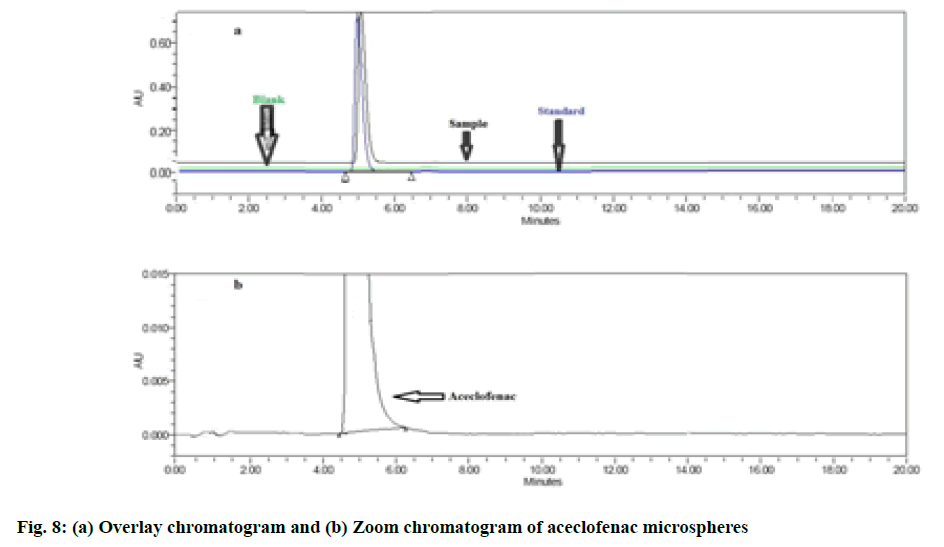
The present developed method for estimation of content uniformity confirmation yielded simple preparations with low retention time of 5.01 min for the analysis. The linearity range for aceclofenac was found to be 200 μg/ml to 1200 μg/ml, the accuracy data was determined by estimating percentage recovery and was found to be within limit. The estimated parameters involving system suitability, accuracy and linearity were found to be within specified limits for aceclofenac from optimized polymeric microspheres. The observed data for all performed validation parameters can be correlated from Table 8, fig. 8a and fig. 8b.
The BBD assisted optimized aceclofenac loaded microspheres were found to have CR behavior and were able to prolong 91.94 % drug with release rate up to 12 h with enhanced micromeritic properties and improved bioavailability as compared with pure drug. SEM data confirmed spherical shape of fabricated microspheres. The ion-gelation technique being uncomplicated, yielded stable microspheres as observed from FTIR and H1 NMR analysis. Statistically optimized microspheres possessed high drug entrapment efficiency that was confirmed through HPLC analysis.
Author’s contributions:
All the authors have contributed equally to this work.
Acknowledgements:
All the authors are thankful to Hetero Healthcare Ltd, India, for providing the gift sample of pure drug, aceclofenac. We would also like to express our gratitude and thankfulness to Department of Chemistry, Dr. Babasaheb Ambedkar Marathwada University, sub-campus Osmanabad for hassle free execution of our PhD research work.
Conflict of interests:
All the authors declare that there is no conflict of interest by all of us.
References
- Khanam N, Alam MI, Sachan AK, Gangwar SS. Fabrication and evaluation of propranolol hydrochloride loaded microspheres by ionic-gelation technique. Der Pharm Lett 2012;3(4):815-20.
- Yun YH, Lee BK, Park K. Controlled drug delivery: Historical perspective for the next generation. J Control Release 2015;219:2-7.
[Crossref] [Google Scholar] [PubMed]
- Sameena T, Siddiqua H, Pasha K, Sultana H, Unnisa K. Microencapsulation of enalapril using different polymers by ionotropic gelation techinique. Indian Res J Pharm Sci 2017;4(1):907-14.
- Deopa D, Singh SK, Pathak S, Jindal NK. In vitro evaluation of controlled release containing aceclofenac microspheres. J Pharm Res Educ 2016;1:139-48.
- Martindale: The complete drug reference. 36th ed. London, UK: The Pharmaceutical Press; 2009.
- Khanam N, Sachan A, Alam I, Gangwar S, Anand C. Design and characterization of mucoadhesive microspheres of novel NSAID drug using algino-eudragit RS100 system. Der Pharma Sinica 2011;2(5):182-91.
- Yenilmez E. Desloratadine-Eudragit® RS100 nanoparticles: Formulation and characterization. Turkish J Pharm Sci 2017;14(2):148-56.
[Crossref] [Google Scholar] [PubMed]
- Mady O. Ibuprofen encapsulation by Eudragit RS100 as microspheres: Preparation and drug release. MOJ Bioequiv Availab 2017;4:193-9.
- Jana S, Gandhi A, Sheet S, Sen KK. Metal ion-induced alginate–locust bean gum IPN microspheres for sustained oral delivery of aceclofenac. Int J Biol Macromol 2015;72:47-53.
[Crossref] [Google Scholar] [PubMed]
- Ravi Kumar K, Suresh G. Development and characterization of alginate microspheres containing olmesartan by ionotropic gelation method. Int J Pharm Sci Drug Res 2018;10:335-41.
- Deshmukh RK, Naik JB. Optimization of sustained release aceclofenac microspheres using response surface methodology. Mater Sci Eng C Mater Biol Appl 2015;48:197-204.
[Crossref] [Google Scholar] [PubMed]
- Sanka K, Pragada RR, Veerareddy PR. A pH-triggered delayed-release chronotherapeutic drug delivery system of aceclofenac for effective management of early morning symptoms of rheumatoid arthritis. J Microencapsul 2015;32(8):794-803.
[Crossref] [Google Scholar] [PubMed]
- Quazi, MA, Khanam N. Enhancement of therapeutic window of metformin hydrochloride by fabrication of microspheres comprising polymeric inculcation with semi-synthetic and synthetic polymers by implementation of box-behnken design. Int J App Pharm 2021;13(4):257-64.
[Crossref]
- Khanam N, Alam MI, Ali QI, Siddiqui AR. A review on optimization of drug delivery system with experimental designs. Int J App Pharm 2018;10(2):7-12.
- Maulvi FA, Thakkar VT, Soni GT, Gandhi RT. Optimization of aceclofenac solid dispersion using Box-Behnken design: In vitro and in vivo evaluation. Curr Drug Deliv 2014;11(3):380-91.
[Crossref] [Google Scholar] [PubMed]
- Patel KD, Patel NK. Formulation and evaluation of metformin hydrochloride microparticles by emulsion solvent evaporation technique. J Drug Deliv Ther 2013;3(2):125-30.
- Parida P, Mishra SC, Sahoo S, Behera A, Nayak BP. Development and characterization of ethylcellulose based microsphere for sustained release of nifedipine. J Pharm Anal 2016;6(5):341-4.
[Crossref] [Google Scholar] [PubMed]
- Reddy BA, Alam MI, Khanam NA, Adhakrishnanand PR. An innovative method development and forced degradation studies for simultaneous estimation of sofosbuvir and ledipasvir by RP-HPLC. Int J Pharm Pharm Sci 2019;11:34-41.
