- *Corresponding Author:
- R. Maheshwari
School of Pharmacy and Technology Management, SVKM’S NMIMS Deemed to be University, Jadcherla, Hyderabad-509301, Telangana, India
E-mail: rahulgs.maheshwari@gmail.com
| Date of Received | 10 September 2020 |
| Date of Revision | 22 November 2021 |
| Date of Acceptance | 21 July 2022 |
| Indian J Pharm Sci 2022;84(4):910-928 |
This is an open access article distributed under the terms of the Creative Commons Attribution-NonCommercial-ShareAlike 3.0 License, which allows others to remix, tweak, and build upon the work non-commercially, as long as the author is credited and the new creations are licensed under the identical terms
Abstract
Myocardial infarction, generally known as ‘heart attack’ occurs predominantly during the early morning hours and a cause of millions of death worldwide. Hydrochlorothiazide is the recommended drug for the prevention of heart disease, but the commercial market lacks its long action (>4 h) formulation. The endeavor of the present research was to develop a quality product profile of hydrochlorothiazide modified release tablets (~14 h release) by applying computational quality by design approach. Three independent factors were identified by qualitative and quantitative risk assessment. Selected dependent variables were cumulative percent of dissolved hydrochlorothiazide in 2, 5, 8 and 12 h. Graphical tools like half normal, normal and Pareto charts were used to manage model selection. The graphical relationship among the critical, independent variables was represented using contour plot and three-dimensional surface plot. Design space was identified by plotting overlay plot using three factors, two-level full factorial design. Outstanding correlation was observed between predicted and actual values. Similarity factor (F2) of reproducible trials was 78 and 79, and content uniformity was 100.9 % and 100.4 %. Average weight, hardness, thickness, diameter and friability were within acceptable limits. Quality by design approach, along with quality risk management tool furnished an efficient and effective paradigm to structure quality modified release tablets of hydrochlorothiazide.
Keywords
Computational pharmaceutics, design expert, hydrochlorothiazide, quality by design, two-level full factorial design, hypertension
Development of pharmaceutical dosage form has been progressive process and advanced from a traditional approach using One Factor at a Time (OFAT). The major flaw in OFAT approach is its inability to access factor interaction, which must anticipated in the pharmaceutical process and it covers a small fraction of total feasible factor space, leading to a copacetic formulation rather than a pre-eminent one[1]. Regulatory agencies emphasize Quality by Design (QbD) based approach for product development to entrust quality in the product[2].
Computational QbD based pharmaceutical development has two imperative steps; the first one is the identification of the Quality Target Product Profile (QTPP) and second includes the factors affecting QTPP[3]. The first step identification of the QTPP deals with quality characteristics, ensuring the target product profile. The QTPP may include dosage form, intended use in the clinical, delivery system, route of administration, the strength of dosage form, container and closure system, factors affecting pharmacokinetics (dissolution), quality criteria of drug product like stability, purity and drug release[4]. Identification of QTPP is followed by the identification of factors which may instigate the QTPP and to further analyze those which do so perilously[5]. These factors are the Critical Quality Attributes (CQAs) of product which eminently depends on the Critical Material Attributes (CMAs) of excipient used in product development along with Critical Process Parameters (CPPs) during manufacturing[6].
One of the decisive and most influential elements for computational QbD is risk assessment. Risk assessment is a precious scientific approach utilized in quality risk management that can facilitate in distinguishing amid material attributes and process parameters which can potentially affect product CQAs. After initial risk assessment design space is established by the application of Design of Experiment (DoE). Design space as a multidimensional zone which abiding with all the specifications of CQAs during product shelflife concerning CMAs and CPPs with prominent certitude[7]. DoE is organized, economical mechanism to substantiate the outcome of input variables on the product quality attributes by minimizing the number of experiments[8]. Another benefit of DoE is that it studies independent factors along with all possible factor interactions over a broad range of value without examining them directly[9].
Despite the understanding of cardiovascular system development from initiation of embryo development progressively to heart development, Cardiovascular Diseases (CVDs) are the paramount reason for mortality almost world-wide[10]. As per the report of the World Health Organization (WHO), CVDs will be the reason for more than 20.0 million deaths of individuals every year, by the 2030 y[11].
Most of the prescribed medicines for the treatment of cardiac ailment include a combination of antihypertensive formulations with a suitable diuretic and Hydrochlorothiazide (HCTZ) is the leading one[12]. The eight reports of Joint National Committee for Prevention, Detection, Evaluation and Treatment of High Blood Pressure have thickly influenced the prescription pattern of HCTZ for more than three decades. All reports recommend thiazide, thiazidelike drugs or thiazide-type diuretics as forefront or preferable therapy with usual dose ranging from 12.5 to 50 mg per day in single or divided dose as recommended[13]. Low doses of thiazide and thiazidelike diuretics have been recommended as initial therapy for hypertensive patients by more recent Joint National Committee reports[14]. HCTZ immediate release tablets alone have a market volume of approximately 31 million dollars in the United States of America (USA). In combination with other drugs, the market volume is approximately 588 million dollars in the USA only. However, HCTZ suffers from high dose requirement (12.5-50 mg/d) and also have a shorter half-life (~6 h) [15].
Moreover, the existing doses do not cover most risk zone for heart attacks, i.e. early morning hours and last phase of the sleep, which is prerequisite to avoid/reduce the heart attack chances[16]. The cardiovascular system follows a routine pattern having oscillatory nature and cardiovascular functions exhibit circadian changes.
There is a further elevation of blood pressure and heart rate due to catecholamines, which shows peak when a person wakes up in the morning[17]. A wide array of techniques were reported to enhance the bioavailability of drugs to manage cardiovascular ailments[18,19].
Furthermore, to maintain the blood concentration for longer period (to cover morning hours during sleep), higher and frequent dosing of HCTZ may result into severe side effects such as fluid-electrolyte imbalance, hyponatremia, hypokalemia, hyperuricemia and hypercalcemia[20]. This craves an urgent need to develop low dose modified release HCTZ formulation which releases the desired concentration in the systemic circulation at the most risky time period that is early morning hours and last phase of sleep, to avoid heart attack chances. The development of modified release dosage form in this context may help in reducing the side effects of higher doses along with reducing dosing frequency for better patient compliance. Modified release dosage form is a mechanism which is in contrast to immediate release. The paradigm of drug release from modified release dosage form is deliberately altered to achieve desired therapeutic goals, better patient compliance and to change the bioavailability or rate of uptake of the drug by a body[21].
Hydrophilic matrix technology is used to modify the release rate of HCTZ[22]. Researches have already tried various naturally available materials like guar gum, xanthan gum, chitosan along with synthetic polymers such as Hydroxypropyl Methylcellulose (HPMC), carboxymethylcellulose sodium and polymethylmethacrylate[ 23]. In our research, we used a combination of two matrixing agents to accomplish particular/desirable pattern of drug release and used matrix technology considering their preference in developing modified release pharmaceutical products at industrial level. In the present investigation we have applied computational QbD approach where QTPP of HCTZ Modified Release Tablets (MRT) was identified (Table 1). DoE was used technique to obtain the desired dissolution profile for HCTZ. Three factors, two-level (23), the full factorial experimental design was employed to characterize and optimize three independent factors which were identified by qualitative risk assessment by leveraging prior knowledge, literature search and experience along with quantitative risk assessment using Failure Mode, Effects and Criticality Analysis (FMECA). Three critical factors which were found affecting the release rate of HCTZ MRT are a concentration of HPMC K4M, the concentration of HPMC K100M, and kneading time. The selected dependent variables (responses) were a cumulative percentage of dissolved HCTZ in 2, 5, 8 and 12 h. Design space was identified based on results of ten trials suggested by full factorial design. The element of menace or all the potential failure modes were beneath crucial levels after the implementation of the control strategy. Prediction of levels of three critical factors required to get desired dissolution data was provided by Design-Expert® software, version 10. Two reproducible trials were taken and analyzed for in vitro dissolution, content uniformity and physical characterization like hardness, thickness, average weight and friability.
The primary objective of this research is to develop a modified release formulation of HCTZ lower strengths (12.5 and 25 mg) which can provide required in vivo dissolution during the last phase of sleep and early morning hours. Formulation is developed using a QbD approach. 23 full factorial design was applied to optimize the formulation in a systematic way. Design space was established by statistical and graphical evaluation of DoE trials which provided final formula to achieve desired in vitro dissolution profile.
Materials and Methods
HCTZ, Microcrystalline Cellulose ((MCC); Avicel pH 101), HPMC K 4M, Polyvinylpyrrolidone (PVP) K30, HPMC K 100M, aerosil-200, talc and magnesium stearate were kindly provided by Alembic Pharmaceuticals Limited (Vadodara, Gujarat, India). All the solvents used were of analytical grade and approved by the Alembic Pharmaceuticals Limited (Vadodara, Gujarat, India) for the use in pharmaceutical product development.
Risk assessment analysis:
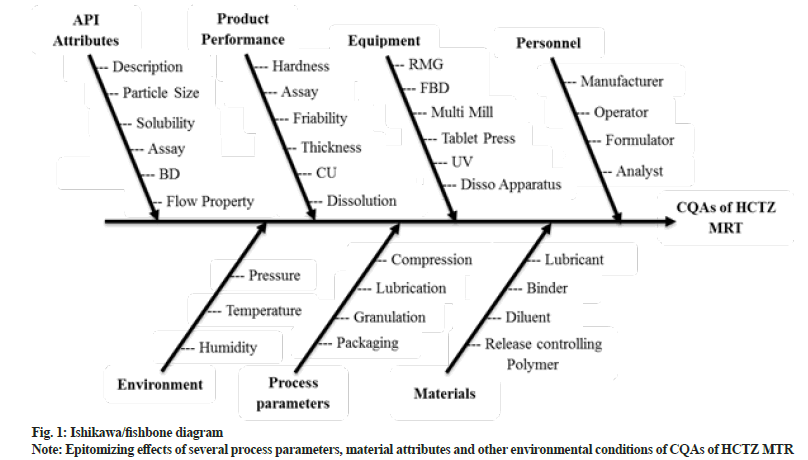
After defining the QTPP of HCTZ MRT (Table 1), risk assessment was performed to scrutinize the potential hazards and to evaluate the factors affecting CQAs. The most frequent approach for regimented risk assessment is the creation of Ishikawa fishbone diagram for identification of critical factors influencing final product attributes. Fig. 1 depicts fishbone diagram epitomizing effects of several process parameters, material attributes and other environmental conditions of CQAs of HCTZ MTR[24].
| QTPP Element | Target | Justification |
|---|---|---|
| Dosage form | Uncoated tablet | Pharmaceutical equivalence prerequisite |
| Dosage design | Modified release matrix tablet | Modified release design necessary to fulfill label claims |
| Dosage Strength | 25 mg | Modified release tablet of lower strength to be developed |
| Route of administration | Oral | Pharmaceutical equivalence prerequisite: Identical route of administration as that of immediate release |
| Container closure system | Appropriate container and closure system to accomplish the target shelf life and to assure the integrity of the tablet | Polyvinyl chloride (PVC)/Polyvinylidene dichloride (PVDC), Alu Alu Blister and High-density polyethylene (HDPE) bottles |
| Drug product quality attributes | Content uniformity | Pharmaceutical equivalence prerequisite: Complying similar or compendial or other relevant standards |
| Dissolution | ||
| Stability | Minimum 3 mo stability at room temperature 3 mo shelf-life at ACC (accelerated conditions) |
Equivalent to or better than immediate release stability and also for commercialization |
Note: QTPP is the first step of development using QbD approach. QTPP of HCTZ modified release formulation is tabulated above
Table 1: QTPP for HCTZ MRT
Screening and establishment of CMAs and CPPs:
Process-wise brainstorming and qualitative risk assessment were performed to screen and establish CMA and CPP[24]. In qualitative risk assessment, raw materials and process parameters attributes classified as low, medium and high risk based on their impact on the critical quality attribute (dissolution) using literature, prior knowledge and brainstorming. Identification of CMAs and CPPs by qualitative risk assessment is tabulated in Table 2 and Table 3, respectively.
| Raw Material | Function | Dissolution |
|---|---|---|
| MCC (Avicel pH 101) | Diluent | L |
| HPMC K4M | Release controlling polymer | H |
| HPMC K100 M | Release controlling polymer | H |
| PVP K30 | Binder | M |
| Colloidal silicon dioxide (Aerosi-200) | Glidant | L |
| Talc | Glidant | L |
| Magnesium stearate | Lubricant | M |
Note: (L): Low, broadly acceptable risk. No additional investigation is required; (M): Medium, risk is accepted. Additional investigation may be necessary to reduce the risk and (H): High, risk is unacceptable. Additional investigation is a prerequisite to reduce the risk. CMA are defined with risk involved i.e. low risk, medium risk and high risk based on literature and experience. Materials identified with high risk were further studied using quantitative risk assessment using FMECA
Table 2: CMA-Raw material, function and dissolution
| Input/process measure | Process steps | Dissolution |
|---|---|---|
| Balance calibration/weighting range | Dispensing | L |
| Screen size | Sifting | L |
| Stirring speed | Binder preparation | L |
| Dry mixing | Granulation | |
| Impeller speed in dry mixing | L | |
| Chopper speed in dry mixing | L | |
| Binder addition | ||
| Binder quantity | L | |
| Rate of binder addition | L | |
| Impeller speed during binder addition | L | |
| Chopper speed during binder addition | L | |
| Kneading | ||
| Kneading time | H | |
| Impeller speed during kneading | L | |
| Chopper speed during kneading | L | |
| Additional solvent quantity | M | |
| Size of equipment | L | |
| Equipment occupancy | L | |
| Inlet temperature | Drying | L |
| Bed temperature | L | |
| Exhaust temperature | L | |
| Flap | L | |
| Drying time | L | |
| Equipment occupancy | L | |
| Vibratory sifter sieve | Milling/sifting | L |
| Type of mill | L | |
| The screen size of mill | M | |
| Speed of mill | M | |
| Type of blender | Blending | L |
| Size of blender | L | |
| Equipment occupancy | L | |
| Speed of blender | L | |
| Blending time | L | |
| Type of blender | Lubrication | L |
| Equipment occupancy | L | |
| Speed of blender | L | |
| Lubrication time | H | |
| Type of machine | Compression | L |
| Type of tooling | L | |
| No of punch set | L | |
| Turret and feeder speed | L | |
| Pre compression | L | |
| Compression force | M |
Note: (L): Low, broadly acceptable risk. No additional investigation is required; (M): Medium, risk is accepted. Additional investigation may be necessary to reduce the risk and (H): High, risk is unacceptable. Additional investigation is a prerequisite to reduce the risk
Table 3: CPP-Input/Process measure process steps and dissolution
In qualitative risk assessment, six CPPs and four CMAs were identified having a medium and high risk for which investigation was required to reduce the risk.
Remaining factors identified with low and broadly acceptable risk for which further investigation not needed. We performed a quantitative risk assessment on these six identified CPP and four identified CMA using FMECA. Quantitative risk assessment using FMECA tabulated in Table 4.
| PP/MA | Effect/suggested contingency/Comment | P | S | D | RPN | RR |
|---|---|---|---|---|---|---|
| Kneading time | Varying chopper speed along with impeller speed effects granules size, shape, structure and flow property. Optimizing granulation parameters will avoid batch to batch variation | 4 | 4 | 2 | 32 | Medium |
| Additional solvent quantity | Solvent quantity is required in optimum amount for uniform granules. Additional solvent quantity will be optimized to avoid batch to batch variation | 4 | 2 | 2 | 16 | Low |
| Screen size of mill | Variation in screen size may result in variation in particle size of granules. This will effect granulometry and powder flow property | 4 | 2 | 2 | 16 | Low |
| Speed of mill | Variation in speed of mill may result in variation in particle size of granules. This will effect granulometry and powder flow property | 4 | 2 | 2 | 16 | Low |
| Lubrication time | An extended release formulation with matrix technology will not be impacted by lubrication time | 3 | 2 | 2 | 12 | Low |
| Compression force | Higher force may result in capping of tablets and lower compression force may result in high friability. Hence compression force will be optimized | 4 | 2 | 2 | 16 | Low |
| HPMC K4M | HPMC K4M and HPMC K100M are used as a release controlling polymer. The concentration of HPMC needs to be controlled; variation in concentration will result in varied dissolution profile | 4 | 4 | 4 | 64 | High |
| HPMC K100M | 4 | 4 | 4 | 64 | High | |
| PVP K30 | PVP K30 is used as a binder. Binder concentration may impact the dissolution profile for immediate release formulations. For modified release, it will not have an impact on dissolution as a concentration in very low 3 % as compared to release controlling polymer | 4 | 2 | 2 | 16 | Low |
| Magnesium stearate | Magnesium stearate is used as a lubricant. It is reported in literature that magnesium stearate is hydrophobic and may delay the dissolution of a drug from a solid dosage form. Since the concentration is very low 1 % it will not have any impact on dissolution profile | 2 | 2 | 2 | 8 | Low |
Note: (PP/MA): Process Parameters and Material Attributes; (P): Probability of cause impacting on the response; (S): Severity on response; (D): Detection of failure and (RR): Risk Rating
Table 4: Quantitative risk assessment using FMECA
There are five steps of performing FMECA which includes determining failure mode; assessing severity (S); assessing probability number (P), assessing detection number (D) and calculating Risk Priority Number (RPN)[25]. This quantitative risk assessment resulted in the identification of three critical factors, i.e. concentration of hydrophilic polymers and kneading time, which can impact response (dissolution rate)[26]. Other process parameters and material attributes were kept constant for all experimental runs to minimize the noise in the process.
Full factorial design:
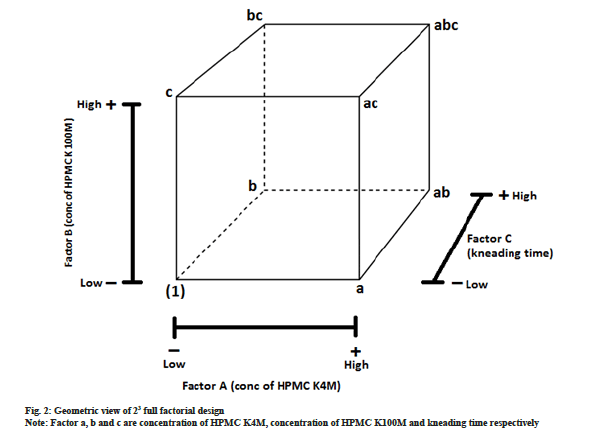
After identification of 3 critical factors with medium and high risk by quantitative risk assessment, 23 full factorial design was employed to optimize MRT of HCTZ. In this design, we considered three factors (independent variables) A, B and C each studied at two levels. This eight treatment combination can be demonstrated geometrically as a cube, as shown in fig.2. The eight treatment combination of 23 design has seven degrees of freedom, three of them are correlated with main effects, i.e. A, B and C while remaining four are correlated with interactions; two-way interactions with AB, BC, AC and three-way interactions with ABC[27].
Three factors (independent variables) which were identified critical by qualitative and quantitative risk assessment were a concentration of HPMC K100M (A), the concentration of HPMC K4M (B) and kneading time (C). These independent variables were studied at two levels, i.e. high and low. Levels for the selected independent variables were determined based on the available literature, previous formulation development experience and feasibility trials. The range of three independent variables was; HPMC K4M is ranging from 10 mg to 50 mg; HPMC K100M is ranging from 10 mg to 50 mg; kneading time ranging from 60 s to 360 s. Design expert provided 10 experimental runs (23=8 experimental runs and two center points). The chosen dependent variables (responses) were a cumulative percentage of dissolved HCTZ in 2, 5, 8 and 12 h. In vitro drug release prediction of HCTZ MRT was done using Wagner Nelson method and de-convolution approach in our previous laboratory work[28]. Required dissolution profile is tabulated in Table 5.
| Time (h) | In vivo dissolution (%) |
|---|---|
| 0 | 0 |
| 1 | 16 |
| 2 | 28 |
| 3 | 37 |
| 4 | 45 |
| 5 | 53 |
| 6 | 61 |
| 7 | 68 |
| 8 | 74 |
| 9 | 80 |
| 10 | 85 |
| 11 | 90 |
| 12 | 94 |
| 13 | 97 |
| 14 | 101 |
Note: Modified release formulation of HCTZ is not available in market. Hence required in vitro profile was calculated using Wagnor Nelson method and De-convolution approach. A separate research article is published for this calculation. Final results are taken from that article
Table 5: Required dissolution profile
Setting dissolution specification:
After calculating required in vitro drug release profile, we move ahead to set dissolution specification considering it as a critical part during the development of new pharmaceuticals. The results predicted by the design expert should comply with the specifications, to ensure that the target is achieved. We included four points in the specification of in vitro dissolution with ±10 % deviation from the mean dissolution profile. In detail, one early time point to exclude dose dumping and to characterize a loading/initial dose, typically 20 % to 30 % dissolved. At least one point to ensure compliance with the shape of the dissolution profile, around 50 % dissolved. One to ensure that the majority of the active substance has been released (Q=80 %). If the maximum amount dissolved is less than 80 %, the last time point should be the time when the plateau of the dissolution profile has been reached[29]. Based on these recommendations, a dissolution acceptance criterion is tabulated in Table 6. This required in vitro dissolution specification will become a dependent variable (response) while performing DoE.
| Response | Unit | Time (h) | Target | Acceptance criteria | Comment | |
|---|---|---|---|---|---|---|
| Dissolution | % | 2 | 30 % | Not more than 35 % | Based on the dissolution profile calculated using the deconvolution method and Wagner nelson equation to meet the in vivo profile | |
| 5 | 50 % | 40 % to 60 % | ||||
| 8 | 75 % | 65 % to 85 % | ||||
| 12 | 90 % | Not less than 85 % | ||||
Note: A dissolution acceptance criterion was determined based on European Medicines Agency (EMEA) guideline. As per guidance for industry, the basis of in vitro dissolution specifications should be the performance of the clinical/bioavailability lots. These specifications may sometimes be widened so that stability lots along with scale-up lots meet the specifications associated with the clinical/bioavailability lots. This approach is based on the use of the in vitro dissolution test as a quality control test without any in vivo significance. In our experiment, we dually followed the protocols stated for a commercial product
Table 6: Required In vitro dissolution Specifications
Analytical method development:
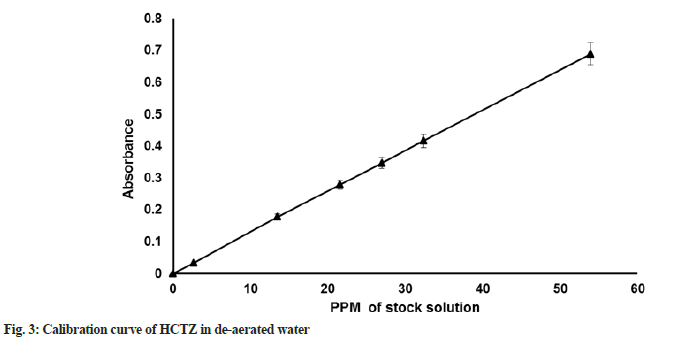
HCTZ maximum absorption (λmax) was determined in purified water as solvent using Ultraviolet ((UV) spectroscopy; Shimadzu; UV 1700). Linearity for the standard solution was checked at different concentrations including 10 %, 50 %, 80 %, 100 %, 120 % and 150 %. Calibration curve of HCTZ in de-aerated water is provided in fig. 3.
Flow properties:
Flow property of powder is one of the vital quality attributes for the development of a robust formulation. Poor flow property often results in weight variation of tablet affecting other CQAs of MRT. In the current study, compendial methods of the angle of repose, Carr’s compressibility index and Hausner’s ratio were used to characterize flow[30]. Tapped density was determined using tap density tester (Electrolab). Angle of repose was determined using LFA ART 1 tester.
Granulation and tableting:
Due to the HCTZ fluffy nature, it has a poor value of compressibility index, Hausner's ratio and angle of repose and therefore very poor flow property and compressibility. Hence, the direct compression process cannot be used for manufacturing of HCTZ tablets. Granulation process will be required to improve the flow property, compressibility and tablet ability as discussed earlier. Using weigh balance (Mettler Toledo) accurately weigh HCTZ along with MCC and HPMC K100M were sifted using 40# sieve in a vibratory sifter (Star Trace; STVS45), this is known as a dry mix. In a separate vessel, PVP K30 was added in purified water under continuous stirring (Stirrer RPM: 500; Remi Motors; RQM-122/R) until a clear solution of the binder was obtained. Dry mix was transferred to Rapid Mixer Granulator (RMG) of capacity 5 l (Saral Engineering; Good Manufacturing Practice (GMP) Laboratory Model), and granulation was performed with a binder solution. Only kneading time was varied and all other parameters such as dry mixing time, binder addition time with impeller and chopper speed were kept constant. Granules were dried in Fluidized Bed Dryer (FBD) (Chitra; CMPL/FBD 2 Kg) at 70° to get desired Loss On Drying (LOD), not more than 2.5 % using a halogen moisture analyzer (Mettler Toledo; HR73). Dried granules were sifted using 20# sieve in a vibratory sifter (Star Trace; STVS45). Granules retained at 20# sieve were milled using multi-mill (Chitra; MIWI-MM-GMP) equipped with 1.2 mm stainless steel, the screen at medium speed with knives forward. Dried granules were mixed in Conta-blender (Bectochem Loedige; GMP Laboratory Model) for 10 min at 16 rpm. Then, HPMC K4M, talc and aerosil-200 were sifted using a 40# sieve, followed by addition into the Conta blender and mixed with dried granules for 10 min at 16 rpm. Magnesium stearate was sifted separately with a 60# sieve and then added to Contablender and mixed with the pre-lubricated blend for 5 min at 16 rpm. This lubricated blend was compressed into a tablet using 8.5 mm round shape standard concave punches using double rotatory compression machine (CADMACH®; CTX–26 single rotatory tablet press) at an average weight of 230 mg. The compositions for the formulation of the factorial design batches F1 to F10 are shown in Table 7.
| Excipients | F1 (mg) |
F2 (mg) |
F3 (mg) |
F4 (mg) |
F5 (mg) |
F6 (mg) |
F7 (mg) |
F8 (mg) |
F9 (mg) |
F10 (mg) |
|---|---|---|---|---|---|---|---|---|---|---|
| HCTZ | 25 | 25 | 25 | 25 | 25 | 25 | 25 | 25 | 25 | 25 |
| MCC 101 | 132 | 172 | 132 | 132 | 132 | 172 | 92 | 132 | 92 | 132 |
| HPMC K100M | 10 | 10 | 30 | 50 | 10 | 10 | 50 | 50 | 50 | 30 |
| PVP K30 | 6 | 6 | 6 | 6 | 6 | 6 | 6 | 6 | 6 | 6 |
| Water | q.s. | q.s. | q.s. | q.s. | q.s. | q.s. | q.s. | q.s. | q.s. | q.s. |
| HPMC K4M | 50 | 10 | 30 | 10 | 50 | 10 | 50 | 10 | 50 | 30 |
| Aerosil 200 | 1 | 1 | 1 | 1 | 1 | 1 | 1 | 1 | 1 | 1 |
| Talc | 4 | 4 | 4 | 4 | 4 | 4 | 4 | 4 | 4 | 4 |
| Magnesium stearate | 2 | 2 | 2 | 2 | 2 | 2 | 2 | 2 | 2 | 2 |
| Total | 230 | 230 | 230 | 230 | 230 | 230 | 230 | 230 | 230 | 230 |
| Kneading time (s) | 60 | 360 | 210 | 60 | 360 | 60 | 360 | 360 | 60 | 210 |
Note: (q.s.): quantity sufficient
Table 7: Compositions for formulation of the factorial design batches F1 to F10
Characterization of HCTZ MRT tablets:
Tablet hardness or crushing strength: Tablet breaking or crushing strength was determined by Erweka hardness tester (TBH 125, ERWEKA GmbH Heusenstamm, Germany). A sample size of 10 tablets was used for each determination and crushing strength of the tablets was averaged from these determinations with the corresponding standard deviation.
Tablet friability: Tablet friability was determined by a United States Pharmacopoeia (USP) to conform friability tester (Erweka type TAR 220 Erweka, Heusenstamm, Germany). Tablet equivalent to 6.5 g, i.e. approximately 30 tablets were placed in the friabilator drum that was rotated 100 times at 25 rpm and the weight loss of the tablets was recorded. Percent (%) tablet friability calculated from the following equation (1):
% Friability=(Wi-Wf)/Wi×100 (1)
Where Wi is the initial weight of tablets and Wf is the weight of tablet after the test
Average weight, diameter and thickness determination: 20 tablets were weighed individually and the average weight of a tablet was determined in milligram (mg). The diameter and thickness of the tablet was determined using Vernier Calipers (Aerospace Digimatic Vernier Caliper) for 10 tablets and the average was determined.
Content uniformity: Content uniformity of tablet was determined by pulverizing individual tablets in a mortal-pestle to a fine powder. The consequent powder was dissolved in 100 ml of purified water. It was sonicated for 20 min. 1 ml of aliquot was withdrawn and further diluted with water to 10 ml. The sample was filtered using a 0.45 μm filter and analyzed for drug content at 271 nm using a UV spectrophotometer (Shimadzu; UV 1700)
In vitro drug release studies: In vitro dissolution study on all HCTZ MRT was performed using USP 28 dissolution testing apparatus 2 (paddle). The dissolution test was performed using 900 ml of deaerated water (dissolution medium), at 37°±0.5° at 75 rpm on 6 units. A sample (10 ml) of the solution was withdrawn from the dissolution apparatus at regular interval for 12 h and the samples were replaced with fresh dissolution medium to mimic the in vivo conditions. The samples were filtered through a 0.45 μ membrane filter. The absorbance of these solutions was measured at 271 nm using a UV/visible double-beam spectrophotometer (Shimadzu; UV-1601; Country: Japan).
Analysis of responses via computational design expert tool:
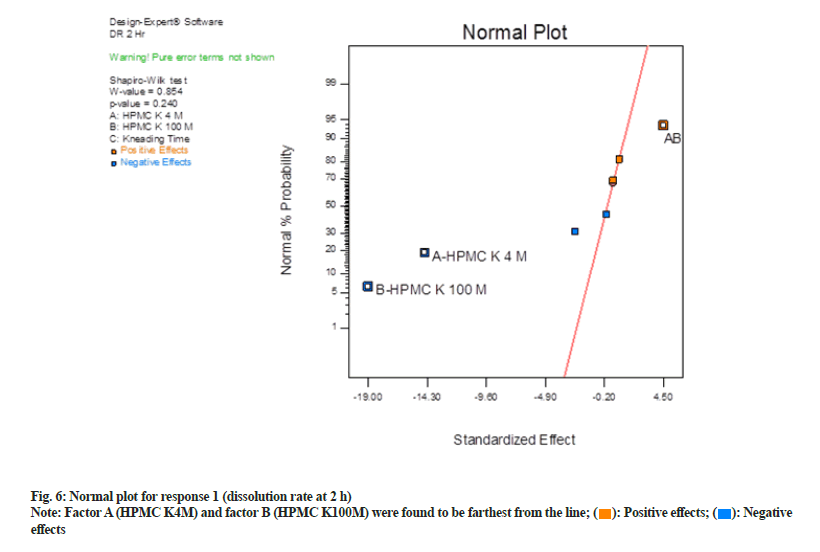
Final dissolution results of 10 QbD trials were incorporated in design expert software (version 10) and all four responses were analyzed. The analysis was performed by interpretation of graphs along with statistical interpretation. The graphical interpretation was done by plotting different graphs like half normal plot, normal plot and Pareto chart. The fit of half normal and normal plot was used to determine the significance of the effect. The significant effects deviate from the line where as non-significant effect tend to fall on the straight line. The addition or dropping of terms was done based on Shapiro-Wilk p-value of different terms (main factor, two-way interactions and threeway interaction). After the selection of critical factors, statistical evaluation was performed using Analysis of Variance (ANOVA) for the selected factorial model. A p-value of the model and selected factors should be less than 0.05 (p<0.05) and lack of fit value should be nonsignificant. Modeling statistics were also studies where the difference between adjacent R2 value and predicted R2 value should not be more than 0.2. The adequate precision, which is a measure of signal to noise ratio, should be >4. After ANOVA, diagnostic plots were studies including normal plot of residuals, residual vs. predicted, residual vs. run, predicted vs. actual, residual vs. factor. In Box-Cox plot for power transform, it was ensured that current lambda (λ) value should be near to best-suited λ value and should lie between a 95 % confidence interval.
Establishment of design space:
After completion of the analysis of all four responses, factors affecting each response were identified. Based on the analysis; evaluation was performed in design expert. To calculate the design space, the criteria of the CQAs was set to a minimum, maximum or range. The CQA dissolution at 2, 5, 8 and 12 h was set according to dissolution specification. Range of independent factors was set in the same range, which was used to predict the design space which was set during DOE. The desirability function was determined. Desirability is an objective function that ranges from zero outside of the limits to one at the goal. The value is completely dependent on how closely the lower and upper limits are set relative to the actual optimum. The goal of optimization is to find a good set of conditions that will meet all the goals, not to get to a desirability value of 1.0. Desirability is simply a mathematical method to find the optimum[31]. Here each response is associated with its own partial disability function[32]. Contour plots, Three Dimensional (3D) surface plots and overlay plots were also plotted. Contour plots are topographical maps which are drawn using 3D data. The 3D plot is a companion to counter plot which represents response in 3D. It is useful in a regression analysis where the relationship among one dependent and two independent variables is viewed[27]. Multiple regression assumes that the surface is perfectly flat. Hence the surface plot helps to determine whether multiple regression is appropriate or not visually. The 3D surface plot is a projection of the contour plot giving shape in addition to the color and contour[33]. Optimal or best conditions derived from such plots. An overlay plot is a combined contour plot. The contour plots or response surface plots are superimposed over each other to get the best compromise visually.
Reproducible trials and in vitro drug release:
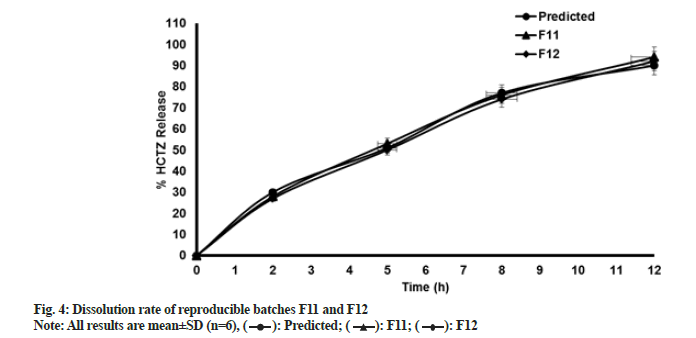
Two reproducible trials taken with these predicted values of selected solution (HPMC K4M 22 mg, HPMC K100M 21 mg and kneading time 120 s). All other factors kept constant and similar manufacturing process was used to prepare reproducible batches. In vitro dissolution study was performed.
Results and Discussion
One of the decisive and most influential elements for QbD is risk assessment. Fishbone diagram (fig. 1) illustrates different critical factors which can likely affect the CQAs of HCTZ MRT. Howbeit, it is impractical to analyze and control the impact of all these factors on the quality attributes of HCTZ MRT. Thus it is mandatory to choose only those factors which are recognized to have a substantial impact on quality attributes of products to illustrate and recognize extensive proportion of experimental variations.
Process-wise brain storming of material attributes and process parameters suggested that concentration of release controlling polymers HPMC K4M and HPMC K100M have a very high impact on dissolution, hence are classified into high risk which is unacceptable and additional scrutiny must need to reduce the risk.
Whereas concentration of binder PVP K30 and lubricant magnesium stearate was classified into medium risk, which is tolerable but additional inspection may be needed to reduce the risk. Concentrations of remaining excipients were classified into low risk, which is broadly acceptable and no further investigation is required.
Qualitative risk assessment was performed using FMECA on 10 critical factors identified during qualitative risk assessment, which may impact the CQA’s. RPN was calculated based on the possibility of cause and its severity on response and control on the cause for all 10 CMA’s and CPPs. RPN of concentration of two release controlling hydrophilic polymers was found to be high (64) hence and kneading time was found to be medium (32). For remaining CMAs and CPPs, the RPN number was low (≤16) for which no further action was required.
λmax of HCTZ in purified water was found to be 271 nm. The nanogram per ml concentration (ppm) values for respective concentration of 10 %, 50 %, 80 %, 100 %, 120 % and 150 % was found to be 2.696, 13.480, 21.568, 26.960, 32.352 and 53.920. Bulk density of HCTZ was found to be 0.34 g/ml. Tapped density of Active Pharmaceutical Ingredient (API) was found to be 0.65 g/ml. The compressibility index of HCTZ was 47 %, Hausner ratio was 1.88, angle of repose value was 67.4° suggest that API is having a very, very poor flow property and compressibility.
Tablet hardness for all 12 batches was found to 20±3 kp. Tablet friability for all 12 batches was found to be nil. The average weight of tablet of all 12 trials was found in the range of 227 mg to 234 mg. The average diameter of the tablet of all 12 trials was found in the range of 8.35 mm to 8.55 mm. The average thickness of tablet of all 12 trials was found in the range of 3.73 mm to 3.83 mm. Content uniformity was found within limit of 97 % to 103 % for all 12 batches maximum with acceptance value of 5.0. The individual value of two reproducible batches (F11 and F12) is tabulated below in Table 8.
| Tablet No | Batch No: F11 | Batch No: F12 |
|---|---|---|
| 1 | 100.30 % | 99.90 % |
| 2 | 101.10 % | 101.50 % |
| 3 | 100.60 % | 99.60 % |
| 4 | 99.90 % | 99.70 % |
| 5 | 101.20 % | 100.70 % |
| 6 | 98.30 % | 100.60 % |
| 7 | 102.40 % | 101.40 % |
| 8 | 101.20 % | 99.30 % |
| 9 | 102.00 % | 100.80 % |
| 10 | 102.20 % | 100.10 % |
| Average | 100.90 % | 100.40 % |
| Minimum | 98.30 % | 99.30 % |
| Maximum | 102.40 % | 101.50 % |
| Relative Standard Deviation (RSD) | 1.21 | 0.77 |
| Acceptance Value | 2.9 | 1.8 |
Table 8: Content uniformity results
Tablets prepared were analyzed for in vitro dissolution study. Results of dissolution data for batches F1 to F10 are presented in Table 9. Results of reproducible trials F11 and F12, compared with predicted values, are tabulated in Table 10. These results are graphically represented in fig. 4. MRT formulation has been subjected to extensive research. Numerous combinations of independent variables generated responses originated which were analyzed using design expert software. As discussed earlier interpretation of model in this research was done graphically and statistically as well and different graphs were obtained for all responses. Interpretation for response 1 (dissolution at 2 h) is described below. Interpretation for the remaining 3 responses, i.e. dissolution at 5 h, 8 h and 12 h was performed in a similar fashion.
| Time (h) | F1 (%) |
F2 (%) |
F3 (%) |
F4 (%) |
F5 (%) |
F6 (%) |
F7 (%) |
F8 (%) |
F9 (%) |
F10 (%) |
|---|---|---|---|---|---|---|---|---|---|---|
| 2 | 18 | 38 | 27 | 22 | 15 | 42 | 6 | 20 | 7 | 26 |
| 5 | 38 | 62 | 45 | 45 | 30 | 65 | 10 | 42 | 11 | 47 |
| 8 | 60 | 90 | 69 | 66 | 55 | 95 | 32 | 63 | 34 | 71 |
| 12 | 75 | 98 | 90 | 83 | 70 | 101 | 44 | 81 | 46 | 92 |
Table 9: Results of dissolution data for batches F1 TO F10
| Time (h) |
Predicted (%) |
F11 (%) |
F12 (%) |
|---|---|---|---|
| 0 | 0 | 0 | 0 |
| 2 | 30 | 28 | 27 |
| 5 | 51 | 53 | 50 |
| 8 | 77 | 76 | 74 |
| 12 | 90 | 94 | 92 |
| F2 (similarity factor) | - | 78 | 79 |
Note: After application of DOE (23 full factorial design), design space was determined using statistical and graphical evaluation of results. Software predicted 77 solutions which can help to achieve desired dissolution profile. One of the solutions with maximum desirability was selected and two reproducible batches were manufactured. Similarity factor (F2 value) of these two reproducible trials was compared with predicted response of selected solution. F2 values found satisfactory and required in vitro dissolution profile was obtained
Table 10: Results of dissolution data for batches F11 and F12
In half normal (fig. 5) plot large effects (absolute values) like factor A (HPMC K4M) and factor B (HPMC K100M) appeared in the upper right section of the plot. These factors are found to be farther from 0. Hence these factors have the largest magnitude. While other factor C (kneading time) and interaction effects two way interaction and three-way interaction were near to 0, hence do not exert any significance on responses. Shapiro-Wilk p-value was >0.10 and maximum when factor A and factor B were selected. Shapiro-Wilk p-value was decreased when any third factor or interaction effect was selected. Hence only factor A and B found to be most significant in this case.
In normal plot (fig. 6) factor A (HPMC K4M) and factor B (HPMC K100M) were found to be farthest from the line and hence were statistically significant. These factors exert a negative impact as they are on the left side of the line. Negative effects mean as was a decrease in response when their concentration was increased. Shapiro-Wilk p-value was >0.10 and maximum when factor A and factor B were selected. Shapiro-Wilk p-value decreased when the third factor, i.e. factor C (kneading time) or interaction effect of AB and BC, were selected. Hence only factor A and B were selected and seemed to be most significant.
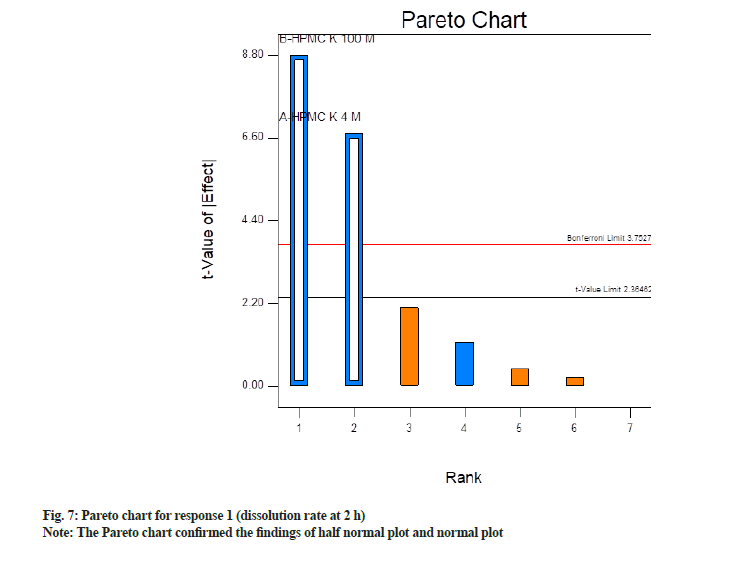
Ahead, the Pareto chart confirmed the findings of half normal plot and normal plot. It is a bar chart where bars are organized from the highest frequency of occurrence to the lowest frequency of occurrence. In this case, it depicts the factors having a significant impact on CQAs in descending order. Factors which are exceeding the Bonferroni limit are almost certainly significant, while factors beyond the T-value limit are possibly significant. Whereas factors below the T-value limit are non-significant. Fig. 7 depicts Pareto chart where significant factors, i.e. concentration of HPMC K4M and HPMC K100M were found above the Bonferroni limit whereas non-significant factors were below it. Among significant factors concentration of HPMC K100M has a more significant impact as compared to HPM K4M as t value is more.
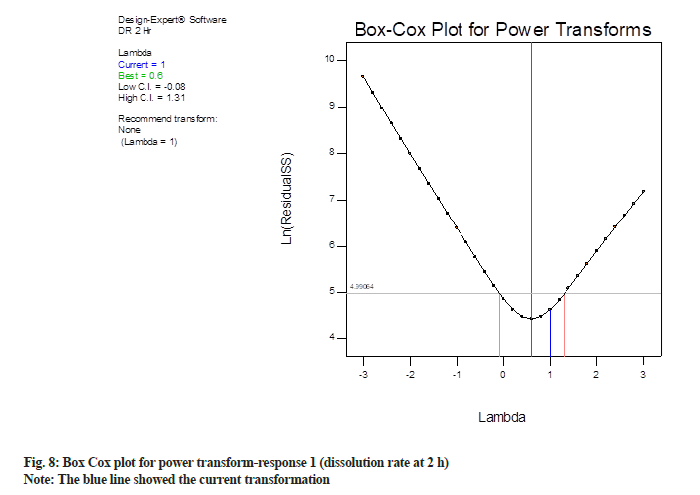
Box-Cox plot for response 2 is shown in fig. 8, the blue line showed the current transformation. In this case, it points to a value of 1 for “λ” which illustrate the power applied to the response values. A λ of 1 demonstrates no transformation. The green line demonstrates the best λ value, while the red lines demonstrate the 95 % confidence interval surrounding it. In this case, current λ value is 1, which is within 95 % confidence interval (blue line is in between two red lines). The best-suited λ value is 0.6 (green line). Since best-suited λ value and current λ value were very near to each other, the software recommends no transformation.
Range of dissolution results for all four time points was 7 % to 42 % for response 1 (dissolution rate at 2 h); 10 % to 65 % for response 2 (dissolution rate at 5 h); 32 % to 95 % for response 3 (dissolution rate at 8 h) and 44 % to 101 % for response 4 (dissolution rate at 12 h). The following linear equation is multiple linear regression analysis by the best fit method to describe the dissolution profile of HCTZ MRT.
Dissolution rate at 2 h=+47.22500–0.36250 A–0.47500 B (2)
Dissolution rate at 5 h=+79.25000–0.54375 A–0.78125 B (3)
Dissolution rate at 8 h=+110.75000–0.65625 A–0.83125 B–0.012500 C (4)
Dissolution rate at 12 h=+118.87500–0.56250 A–0.80000 B (5)
Two out three selected independent variables i.e. concentration of HPMC K4M and HPMC K100M, were found to have statistically significant effect (p<0.05) on dissolution rate at 2 h, 5 h and 12 h. The model F value for response 1 was 38.30; response 2 was 65.36 and response 4 was 21.62. Lack of fit F value for response 1, 2 and 4 was found to be 34.63, 12.77 and 41.12, respectively. For dissolution rate at 8 h third factor, i.e. kneading time was also found significant in half normal plot, normal plot, Pareto chart and in linear equation (4). But p value of this factor C was 0.275 greater than acceptable limit of 0.05 which also impacted the overall F-value of the model which was found to be 61.77. Lack of fit value was 11.51 and difference between “Predicted R2” and “Adjacent R2” was 0.0113. Thus ANOVA was re-calculated by dropping kneading time from the calculation. The reduced model results were improved significantly.
Overall F value of the model increased to 86.49. Slight improvement observed in lack of fit value which was found to be 11.94. No major variation observed in the difference between “Predicted R2” and “Adjacent R2”. New linear equation for response 3 was calculated.
Dissolution rate at 8 h=+108.12500–0.65625 A–0.83125 B (6)
Thus for all 4 responses, only two independent factors were found a critical, i.e. concentration of HPMC K4M and HPMC K100M. Based on these data desirability graph, contour plot, 3D surface plot and overlay plot were designed.
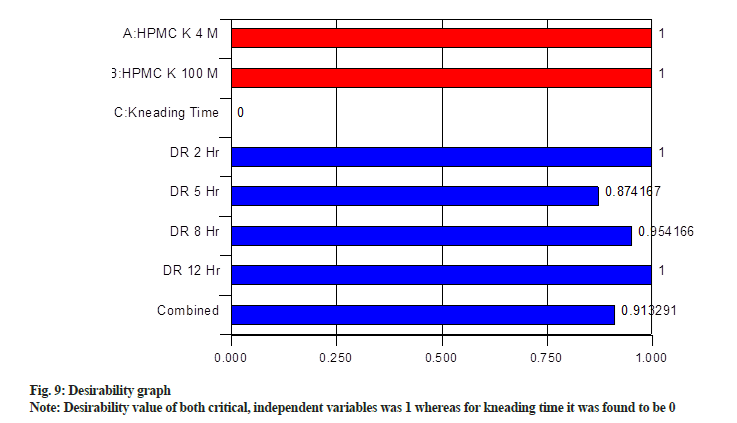
Desirability graph was obtained, which is shown in fig. 9. Desirability value of both critical, independent variables was 1 whereas for kneading time it was found to be 0. For individual responses, it was >0.85. Further composite desirability of 0.91 was obtained by combining individual desirability. Desirability ranges from zero outside of the limits (not desired) to one at the goal (maximum desirability)[34]. The values of responses obtained from the optimized formulation are in close agreement with the predicted values by the desirability function, indicating that the statistical model passes the validity test.
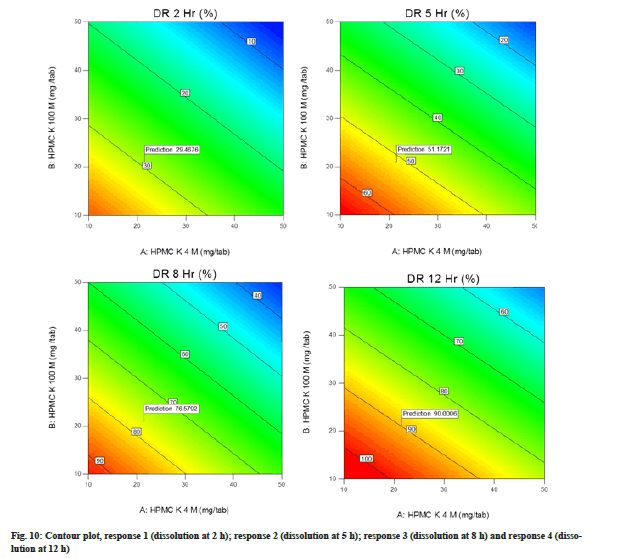
Contour plot illustrated the graphical relationship among three numerical variables (HPMC K4M, HPMC K100M and kneading time) in two dimensions where one variable is on the vertical axis (HPMC K4M) and other on the horizontal axis (HPMC K100M). The colour gradient and isolines (lines of constant value) represent the third variable (kneading time). Warmer colours like orange in the contour plots correspond to the high value, whereas the cooler colours like blue corresponds the lower values. The contour lines are the border between different colours. Contour plot for response 1, 2, 3 and 4 is represented in fig. 10.
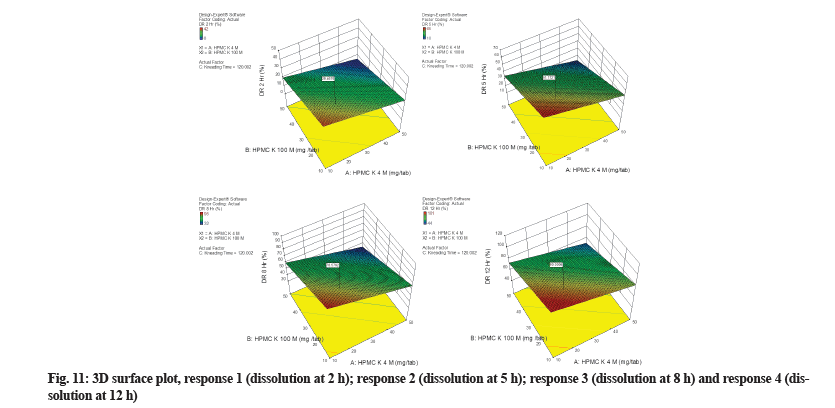
3D surface plot illustrated the relationships among two critical, independent variables (HPMC K4M and HPMC K100M) in three dimensions (fig. 11). Based on regression analysis and 3D surface plot it was identified that increasing the concentration of polymers from 10 gm to 50 mg had little impact on response 1 and major impact on response 2, 3 and 4. The 3D surface plot for all responses is not curved. This predicts that the model is not quadratic or cubic for any response. The red zone in the 3D surface plot represents the maximum value of dissolution obtained during 10 development trials, while the blue zone represents the lowest value obtained. Most of the area of the plot is green, which depicts results in acceptable limits.
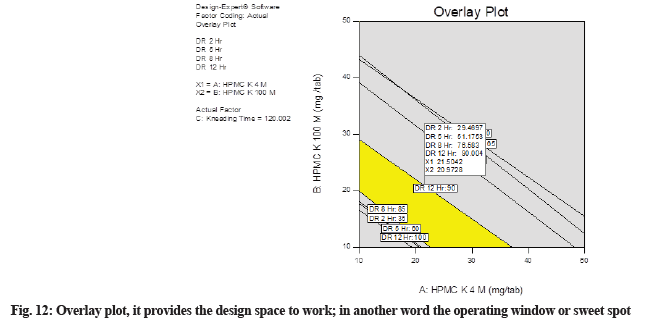
The overlay plot provides the design space to work, in another word the operating window or sweet spot. In this plot (fig. 12), the yellow area indicates the area in which the optimized formulation can be formulated. This is the design space created for HCTZ MRT. Batches manufactured by varying the concentration of critical, independent variables in this yellow portion will provide the required dissolution results. Notice that regions not meeting our specifications are shaded out. The plot establishing ideal operating conditions reaching maximum from the best-fitted model with a map of contour lines follows a direction of movement along the path of maximum response from a reference point. Maximum and minimum boundaries are set for desirable values and the zone is emphasized where all responses are acceptable.
Acknowledgement
This work is supported by the Department of Science and Technology, India via Institutional Grant (F. No. 22–3/2OL6-TS.II/TC) and SR/URIE-II I/01/2015(G) to Banasthali university, India.
Conflict of interests:
The authors declared no conflict of interests.
References
- Csóka I, Pallagi E, Paál TL. Extension of quality-by-design concept to the early development phase of pharmaceutical R&D processes. Drug Discov Today 2018;23(7):1340-3.
[Crossref] [Google Scholar] [Pub Med]
- Mishra SM, Rohera BD. An integrated, quality by design (QbD) approach for design, development and optimization of orally disintegrating tablet formulation of carbamazepine. Pharm Dev Technol 2017;22(7):889-903.
[Crossref] [Google Scholar] [Pub Med]
- Singhai VD, Maheshwari R, Sharma S, Paliwal S. Employment of quality by design approach via response surface methodology to optimize and develop modified-release formulation of hydrochlorothiazide. Curr Comput Aided Drug Des 2021;17(2):266-80.
[Crossref] [Google Scholar] [Pub Med]
- Mishra V, Thakur S, Patil A, Shukla A. Quality by design (QbD) approaches in current pharmaceutical set-up. Expert Opin Drug Deliv 2018;15(8):737-58.
[Crossref] [GoogleScholar] [Pub Med]
- Su Q, Bommireddy Y, Shah Y, Ganesh S, Moreno M, Liu J, et al. Data reconciliation in the Quality-by-Design (QbD) implementation of pharmaceutical continuous tablet manufacturing. Int J Pharm 2019;563:259-72.
[Crossref] [Google Scholar] [Pub Med]
- Li X, Liu X, Wang R, An F, Nie J, Zhang Y, et al. Quality by design-driven process development of cell culture in bioreactor for the production of foot-and-mouth veterinary vaccine. J Pharm Sci 2019;108(7):2288-95.
[Crossref] [Google Scholar] [Pub Med]
- Beg S, Hasnain MS, Rahman M, Swain S. Introduction to quality by design (QbD): Fundamentals, principles and applications. In: Beg S, Hasnain MS, editors. Pharmaceutical quality by design. 1st ed. Elsevier; 2019. p. 1-17.
- Yu X, Lawrence XY, Teng Y, Gaglani DK, Rege BD, Rosencrance S. Implementation of pharmaceutical quality by design in wet granulation. In: Narang AS, Badawy SIF, editors. Hand book of pharmaceutical wet granulation. Elsevier; 2019. p. 703-33.
- Beg S, Swain S, Rahman M, Hasnain MS, Imam SS. Application of design of experiments (DoE) in pharmaceutical product and process optimization. In: Beg S, Hasnain MS, editors. Pharmaceutical quality by design. Elsevier; 2019. p. 43-64.
- Broberg K. New light on exposure to chemicals and cardiovascular diseases. Heart 2019;105(6):426.
[Crossref] [Google Scholar] [Pub Med]
- Mendis S, Davis S, Norrving B. Organizational update: The world health organization global status report on noncommunicable diseases 2014; one more landmark step in the combat against stroke and vascular disease. Stroke 2015;46(5):e121-2.
[Crossref] [Google Scholar] [Pub Med]
- Waeber B, Dusing R, Glazer R, Paldanius P, Stricker K. P1873 Incidence rates of oedema with triple therapy amlodipine/valsartan/HCTZ as compared to valsartan/amlodipine and valsartan/HCTZ dual combination therapy. Eur Heart J 2018;39(1):ehy565-P1873.
- Margolis KL, Fortmann SP, Bergdall AR, Smith DH, Pawloski PA, Vollmer WM. Design and methods for a pilot study and multicenter pragmatic trial comparing HCTZ and chlorthalidone for cardiovascular outcomes. J Am Soc Hypertens 2016;4(10):e49.
- Carey RM, Whelton PK. Prevention, detection, evaluation and management of high blood pressure in adults: Synopsis of the 2017 American college of cardiology/American heart association hypertension guideline. Ann Intern Med 2018;168(5):351-8.
[Crossref] [Google Scholar] [Pub Med]
- CB EM. Combination candesartan-HCTZ did not reduce major CV events in patients at intermediate CV risk. Ann Intern Med 2016;165(2):JC7.
- Ades PA, Keteyian SJ, Wright JS, Hamm LF, Lui K, Newlin K, et al. Increasing cardiac rehabilitation participation from 20 % to 70 %: A road map from the million hearts cardiac rehabilitation collaborative. Mayo Clin Proc 2017;92(2):234-42.
[Crossref] [Google Scholar] [Pub Med]
- Sanidas E, Grassos C, Papadopoulos DP, Velliou M, Tsioufis K, Mantzourani M, et al. Labile hypertension: A new disease or a variability phenomenon? J Hum Hypertens 2019;33(6):436-43.
[Crossref] [Google Scholar] [Pub Med]
- A Sharma P, Maheshwari R, Tekade M, Kumar Tekade R. Nanomaterial based approaches for the diagnosis and therapy of cardiovascular diseases. Curr Pharm Des 2015;21(30):4465-78.
[Crossref] [Google Scholar] [Pub Med]
- Maheshwari R, Tekade M, A Sharma P, Kumar Tekade R. Nanocarriers assisted siRNA gene therapy for the management of cardiovascular disorders. Curr Pharm Des 2015;21(30):4427-40.
[Crossref] [Google Scholar] [Pub Med]
- Ziegler MG, Milic M, Lu X, Gharaibeh M, Elayan H. Effect of obstructive sleep apnea on the response to hypertension therapy. Clin Exp Hypertens 2017;39(5):409-15.
[Crossref] [Google Scholar] [Pub Med]
- Isidori AM, Venneri MA, Graziadio C, Simeoli C, Fiore D, Hasenmajer V, et al. Effect of once-daily, modified-release hydrocortisone vs. standard glucocorticoid therapy on metabolism and innate immunity in patients with adrenal insufficiency (DREAM): A single-blind, randomised controlled trial. Lancet Diabetes Endocrinol 2018;6(3):173-85.
[Crossref] [Google Scholar] [Pub Med]
- Pygall S, Kujawinski S, Timmins P, Melia C. Extended release of flurbiprofen from tromethamine-buffered HPMC hydrophilic matrix tablets. Pharm Dev Technol 2018;23(9):874-81.
[Crossref] [Google Scholar] [Pub Med]
- Yun YN, Sohail M, Moon JH, Kim TW, Park KM, Chun DH, et al. Defect?free mixed?matrix membranes with hydrophilic metal?organic polyhedra for efficient carbon dioxide separation. Chem Asian J 2018;13(6):631-5.
[Crossref] [Google Scholar] [Pub Med]
- Yu LX, Amidon G, Khan MA, Hoag SW, Polli J, Raju GK, et al. Understanding pharmaceutical quality by design. AAPS J 2014;16(4):771-83.
[Crossref] [Google Scholar] [Pub Med]
- Stamatis DH. Failure mode and effect analysis: FMEA from theory to execution. 2nd ed. Quality Press; 2003.
- Fahmy R, Kona R, Dandu R, Xie W, Claycamp G, Hoag SW. Quality by design I: Application of failure mode effect analysis (FMEA) and Plackett–Burman design of experiments in the identification of “main factors” in the formulation and process design space for roller-compacted ciprofloxacin hydrochloride immediate-release tablets. AAPS PharmSciTech 2012;13(4):1243-54.
[Crossref] [Google Scholar] [Pub Med]
- Montgomery DC. Design and analysis of experiments. 8th ed. John wiley and sons; 2017.
- Swapnil Sharma SP, Vikas D Singhai. In vitro drug release prediction of hydrochlorothiazide modified release tablet using Wagner Nelson method and deconvolution approach. Int J Pharm Tech Res 2019;12:49-56.
- Anand OM, Yu LX, Conner DP, Davit BM. Dissolution testing for generic drugs: An FDA perspective. AAPS J 2011;13(3):328-35.
[Crossref] [Google Scholar] [Pub Med]
- Sun CC. Microstructure of tablet-pharmaceutical significance, assessment and engineering. Pharm Res 2017;34(5):918-28.
[Crossref] [Google Scholar] [Pub Med]
- Politis S, Colombo P, Colombo G, M Rekkas D. Design of experiments (DoE) in pharmaceutical development. Drug Dev Ind Pharm 2017;43(6):889-901.
[Crossref] [Google Scholar] [Pub Med]
- Gohel MC, Parikh RK, Aghara PY, Nagori SA, Delvadia RR, Dabhi MR. Application of simplex lattice design and desirability function for the formulation development of mouth dissolving film of salbutamol sulphate. Curr Drug Deliv 2009;6(5):486-94.
[Crossref] [Google Scholar] [Pub Med]
- Dejaegher B, Vander Heyden Y. Experimental designs and their recent advances in set-up, data interpretation and analytical applications. J Pharm Biomed Anal 2011;56(2):141-58.
[Crossref] [Google Scholar] [Pub Med]
- Ragonese R, Macka M, Hughes J, Petocz P. The use of the Box–Behnken experimental design in the optimisation and robustness testing of a capillary electrophoresis method for the analysis of ethambutol hydrochloride in a pharmaceutical formulation. J Pharm Biomed Anal 2002;27(6):995-1007.
[Crossref] [Google Scholar] [Pub Med]
 Predicted;
  F11;
F11;  F12
F12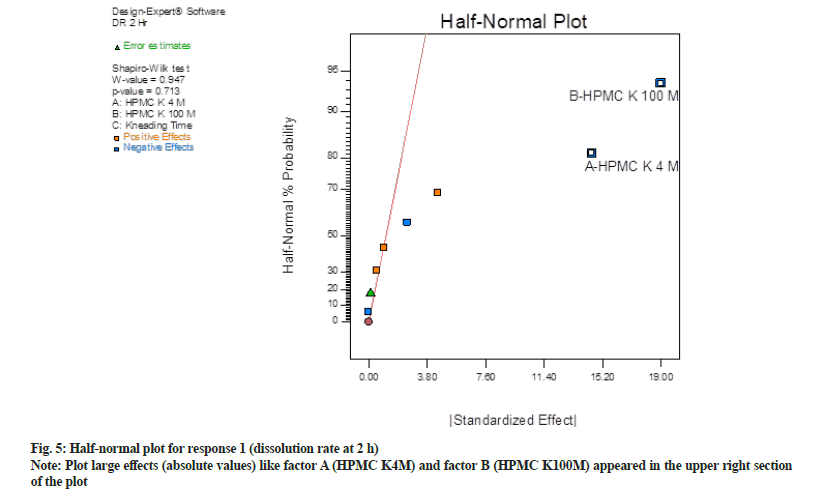
 : Positive effects;
  Negative effects