| Date of Submission | May 25, 2010 |
| Date of Revision | April 27, 2012 |
| Date of Acceptance | May 5, 2012 |
| Indian J Pharm Sci, 2012, 74 (3): 254-258 |
Abstract
The solubility of satranidazole in several water-N,N-dimethylformamide mixtures was analysed in terms of solute-solvent interactions and data were treated on the basis of extended Hildebrand solubility approach. The solubility profile of satranidazole in water-N,N-dimethylformamide mixtures shows a curve with a solubility maxima well above the ideal solubility of drug. This is attributed to solvation of the drug with the water-N,N-dimethylformamide mixture, and indicates that the solute-solvent interaction energy (W) is larger than the geometric mean (δ1δ2 ) of regular solution theory. The new approach provides an accurate prediction of solubility once the interaction energy (W ) is obtained. In this case, the energy term is regressed against a polynomial in δ1 of the binary solvent mixture. A quartic expression of W in terms of solvent solubility parameter was found for predicting the mole fraction solubility of satranidazole in the studied mixtures. The method has potential usefulness in preformulation and formulation studies during which solubility prediction is important for drug design.
Keywords
Extended Hildebrand solubility approach, N, N‑dimethylformamide, satranidazole, solubility
Extended Hildebrand solubility approach is applied to predict the solubility of satranidazole in mixtures of water and N,N‑dimethylformamide (DMF). DMF is a very interesting cosolvent to study the interrelation between drug solubility and medium polarity because it is aprotic and completely miscible with water [1]. Water‑DMF mixtures are strongly non ideal and can act in the solute‑solvation process via hydrophobic interactions and preferential solvation [2,3]. In terms of polarity, water–DMF mixtures cover a wide range of Hildebrand solubility parameters from 12.1 (pure DMF) to 23.4 (pure water)[4,5].
The extended Hildebrand solubility approach enables us to predict the solubility of semipolar crystalline drugs in irregular solutions involving self‑association and hydrogen bonding in pure solvents or in solvent blends. The key relationship may be written as[6,7]
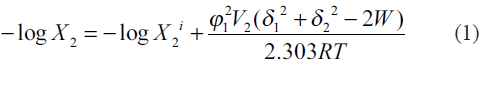
where W is an interaction term for estimating energy between solute and solvent for an irregular solution. This interaction parameter W accurately quantifies the cohesive energy density between solute and solvent. When W = δ1δ2, the solution is said to be regular. W>δ1δ2 appears when the blended solvents are able to hydrogen bond with each other but not with their own kind. The case of W<δ1δ2 occurs when like molecules associate and unlike molecules do not, such as for nonpolar media in water. Although W cannot be theoretically evaluated, it is assumed that when a range of similar solvents are used for dissolving a fixed solute, W = K δ1δ2, where K is a proportionality constant [8].
Interaction energy (W) values were evaluated as a power series in δ1 utilizing mixed solvents by polynomial regression[9‑11]. By using these polynomial fits, the mole fraction solubility of solutes may be predicted that is in good agreement with the experimental values. This procedure may be applied for calculating solubilities of missing data by interpolation. When the solvent studied is a mixed one, there are a series of parameters to be calculated such as: the solubility parameter, the volume fraction and the mean molar volume of mixed solvents.
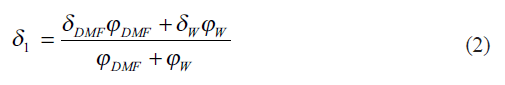
The solubility parameter (δ1) for the mixture of two solvents DMF and water, W, is averaged in terms of volume fractions using the expression[12],
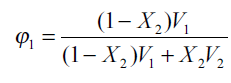
where Ф1=ФDMF+ФW is the total volume fraction of two solvents which can be calculated from[13],
 (3)
(3)
where X2 is the mole fraction solubility of the solute in the mixed solvent and V1 is the molar volume of the binary solvent. For each mixed solvent composed of water and DMF in various proportions[14]:
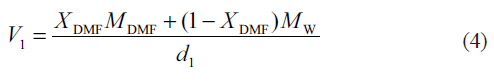
Here, Xi and Mi are the mole fraction and the molecular weight of the particular solvent in the mixture, respectively and d1 is the density of the solvent mixture at the experimental temperature.
Satranidazole, 1–methylsulphonyl-3-(1-methyl-5-nitro- 2-imidazolyl)-2-imidazolidinone, is one of the large series of nitroimidazoles with a potent antiprotozoal activity against E. hystolytica, T. vaginalis and Giardia. Satranidazole is not official in IP, USP and BP till date. Though the molecule is found to be effective against these microorganisms, its therapeutic efficacy is hindered due to its poor aqueous solubility (0.01 mg/ml). The poor aqueous solubility and wettability of satranidazole give rise to difficulties in pharmaceutical formulations meant for oral or parenteral use, which may lead to variation in bioavailability[15-18].
As such, no solubility reports are found for its estimation and prediction by any of the method till date. Hence, the aim of this communication is to report the solubility behaviour of satranidazole in individual solvents (water and DMF) and different concentrations of water‑DMF mixtures, predict it theoretically by applying the Extended Hildebrand Solubility Approach.
Satranidazole, obtained as gift sample from Erika Pharmaceuticals, Mumbai, India, was purified by recrystallization process. The solvent used for recrystallization of satranidazole was acetone. DMF and acetone both were obtained as gift samples from Qualigens Fine Chemicals, Mumbai, India.
Throughout the study, double distilled water was used for experimental purpose. All chemicals and reagents used in the study were of analytical grade and used as such. Double beam UV/Vis spectrophotometer, Shimadzu model 1601 with spectral bandwidth of 2 nm, wavelength accuracy ±0.5 nm and a pair of 10 mm matched quartz cells were used to measure absorbance of the resulting solutions. Citizen balance, CX‑100, was used for weighing of satranidazole. Differential scanning calorimeter, Shimadzu TA‑60 WS, was used for the determination of melting point and heat of fusion of satranidazole.
Solubilities of satranidazole (δ2=11.34) were determined in mixed solvent consisting of DMF (δDMF=12.1) and water (δW=23.4). Solvent blends were made covering 0-100% DMF (v/v). About 25 ml of DMF, water, or mixed solvents were placed into screw‑capped vials (Thermostated at 25° and under continuous magnetic stirring) containing an excess amount of satranidazole and agitation was maintained at 150 rpm for 24 h in a constant‑temperature bath. Preliminary studies showed that this time period was sufficient to ensure saturation at 25°[19].
After equilibration, the solution was microfiltered (0.45 μm) and the filtrate was then diluted with double distilled water to carry out the spectrophotometric determination at the maximum wavelength of absorption of satranidazole (λmax‑319.80 nm). Calibration graphs of satranidazole in each solvent blend were previously established with correlation coefficients greater than 0.9978. The working concentration range was from 10 to 50 μg/ ml satranidazole. The densities of the blends as well as the filtrates of saturated solutions were detefrmined by using 25‑ml specific gravity bottle at 25°. Once the densities of solutions are known, the solubilities can be expressed in mole fraction scale.
The molar volume (V2) and the solubility parameter of satranidazole were previously estimated by using the Fedor’s group contribution method [20,21] giving 235.6 cm3/mol and 11.3928 (cal/cm3)0.5. The ideal solubility of satranidazole was calculated by using the equation [22],
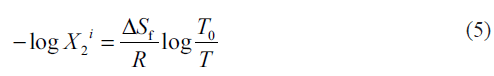
where, ΔSf is the entropy of fusion of the crystalline drug molecule at its melting point T0 and T is the
temperature in Kelvin at which the solubility was
determined. The value of ΔSf was evaluated by [23], (ΔHf=7763.838 cal/mol, T0=461.83°K) giving
16.811 cal/mol/°K. Thus, the ideal mole fraction
solubility of satranidazole (X2
i) is 0.024561.
(ΔHf=7763.838 cal/mol, T0=461.83°K) giving
16.811 cal/mol/°K. Thus, the ideal mole fraction
solubility of satranidazole (X2
i) is 0.024561.
The mole fraction solubility of satranidazole in water‑DMF mixtures and other parameters of interest (δ1, Φ1, V1) are collected in Table 1. The plot of these experimental solubilities versus the solubility parameter of mixtures, Δ1 is shown in fig. 1. The solubility of satranidazole was far from its ideal value in both pure solvents (DMF, water) as well as in the mixtures. The maximum solubility, although higher than ideal occurred at a δ1=12.10, very close to the calculated δ2 for satranidazole.
| ΦDMF | X2(obs) | δ1 | F1 | V1 | δ1δ2 | W(obs) |
|---|---|---|---|---|---|---|
| 0 | 3.8119E‑05 | 23.40 | 0.99950 | 18.00 | 265.36 | 330.51 |
| 0.1 | 7.5836E‑05 | 22.27 | 0.99925 | 23.90 | 252.54 | 305.57 |
| 0.2 | 1.3239E‑04 | 21.14 | 0.99895 | 29.80 | 239.73 | 281.74 |
| 0.3 | 2.1919E‑04 | 20.01 | 0.99856 | 35.70 | 226.91 | 259.12 |
| 0.4 | 4.2637E‑04 | 18.88 | 0.99759 | 41.60 | 214.10 | 237.97 |
| 0.5 | 5.9677E‑04 | 17.75 | 0.99705 | 47.50 | 201.29 | 217.70 |
| 0.6 | 1.4499E‑03 | 16.62 | 0.99363 | 53.40 | 188.47 | 199.38 |
| 0.7 | 3.7972E‑03 | 15.49 | 0.98508 | 59.30 | 175.66 | 182.42 |
| 0.8 | 1.4453E‑02 | 14.36 | 0.94967 | 65.20 | 162.84 | 167.23 |
| 0.9 | 2.3516E‑02 | 13.23 | 0.92610 | 71.10 | 150.03 | 152.32 |
| 1.0 | 4.3502E‑02 | 12.10 | 0.87784 | 77.00 | 137.22 | 139.00 |
δ1=Solubility parameter of solvent blend, δ2=Solubility parameter of drug, V1=Molar volume of solvent blend, and Φ1=Total volume fraction of solvent blend. The values for δ1, Φ1 and V1 are calculated from Eqs. 2‑4, respectively and W is calculated from Eq. 1
Table 1: Mole fraction solubility of Satranidazole

Figure 1: Solubility parameter versus mole fraction solubility profile. represents experimental solubilities, and highest mole fraction
solubility obtained is X2 = 4.3502 * 10–2 when δ1 = 12.10 (cal/cm3)0.5 in
water DMF mixtures.
represents experimental solubilities, and highest mole fraction
solubility obtained is X2 = 4.3502 * 10–2 when δ1 = 12.10 (cal/cm3)0.5 in
water DMF mixtures.
Observed solubility data were then subjected to the evaluation of interaction energy. The interaction term W can be calculated from Eq.1 at each experimental point (X2, δ1). The results are also presented in Table 1. Experimental values of interaction energy (Wobs) were regressed against solubility parameter to obtain Wcal (fig. 2), which was then used to back‑calculate the mole fraction solubility (X2cal). A mathematical model is proposed for individual system as fourth power polynomial. The W values may also be expanded in a power series of δ1 from fourth degree polynomial regression.

Figure 2: Solubility parameter versus interaction energy profile. W(cal) obtained from quartic regression Eq. 7, for satranidazole in water‑DMF mixtures at 25° and correlation coefficient, r2, is 0.99999 for n = 11.
In our case, the following fit was obtained:
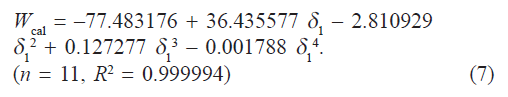
If we insert this equality in Eqn. 1, we can predict the solubility of satranidazole. The back‑calculated logarithmic solubilities, log X2cal are recorded in Table 2, together with the experimental values of log X2 and their differences. The plot of log X2cal against log X2obs gives a straight line passing through the origin with very high degree of correlation coefficient (R2) 0.9912 and negligible intercept (0.00009) equal to zero as shown in fig. 3.
| -log X(2 obs) | -log X(2 cal) | Residual (∆) | Percent difference | |||
|---|---|---|---|---|---|---|
| 4.418857 | 4.434688 | +0.035796 | 3.58E+00 | |||
| 4.120125 | 4.091550 | ‑0.068009 | ‑6.80E+00 | |||
| 3.878144 | 3.865188 | ‑0.030281 | ‑3.03E+00 | |||
| 3.659178 | 3.671673 | +0.028360 | 2.84E+00 | |||
| 3.370217 | 3.449925 | +0.167680 | 1.68E+01 | |||
| 3.224190 | 3.168771 | ‑0.136110 | ‑1.36E+01 | |||
| 2.838657 | 2.808556 | ‑0.071768 | ‑7.18E+00 | |||
| 2.420537 | 2.385907 | ‑0.083003 | ‑8.30E+00 | |||
| 1.840041 | 1.936473 | +0.199120 | 1.99E+01 | |||
| 1.628638 | 1.577837 | ‑0.124090 | ‑1.24E+01 | |||
| 1.361490 | 1.368473 | +0.015951 | 1.60E+00 | |||
Residuals obtained from quartic regression Eq. 7, for satranidazole in water‑DMF mixtures at 25°. Residuals can also be obtained from (X2 obs‑X2 cal)/X2 obs
Table 2: Experimental and calculated mole Fraction solubilities

Figure 3: Comparison of observed and calculated mole fraction solubility. Comparison of 11 observed satranidazole solubilities in water‑DMF mixtures at 25° with solubilities predicted by the extended Hildebrand approach. The intercept of the line is 0.00009, and the slope is 0.9912. The correlation coefficient, r2, is 0.9912 for n = 11.
A careful scrutiny of the behaviour of the solutions of satranidazole in water‑DMF mixtures may be performed, comparing the value of the interaction term W at each experimental point with the regular value W=δ1δ2. This comparison is presented also in Table 1. As can be observed, for volume fractions of DMF from 0 to 1, W>δ1 δ2. But, for volume fractions of DMF from 0 to 0.5, W is far greater than δ1δ2 and for volume fractions of DMF from 0.6 to 0.9, W is nearby closer to δ1δ2. It may be assumed that satranidazole solutions can behave as regular solutions at some point (W=δ1δ2) with 1.0 DMF volume fraction.
Thus, in water‑rich mixtures (0-0.5) there seems to be some kind of association between satranidazole and the solvent mixture according to W>δ1δ2. This finding could be explained considering the hydrophobic hydration (HH). HH is featured by an enhanced hydrogen bonding between water molecules in the neighbourhood of nonpolar groups in water. When adding DMF, HH breaks down. The endothermic shift of the enthalpies of solution upon small additions of aprotic cosolvent to water is known to appear for hydrophobic solutes like satranidazole.
Conversely, in water poor mixtures (0.6-1.0) self‑association of solvent, solute or both is not obtained because W is still far greater than δ1δ2. This behaviour may remain as such in rich DMF blends, and therefore, the corresponding satranidazole solubilities are still higher than regular one.
The extended Hildebrand approach applied to the solubility data of satranidazole in water‑DMF mixtures leads to an expansion of the W interaction term as a fourth degree power series in δ1 which reproduces the satranidazole solubility within the accuracy ordinarily achieved in such measurements. The procedure can be used to predict the solubility of satranidazole in pure water or DMF and in any water‑DMF mixtures.
Acknowledgements
The authors wish to express their gratitude to M/S Erika Pharmaceuticals, Mumbai, India for providing the gift sample of satranidazole. The authors are also thankful to Qualigens Fine Chemicals, Mumbai, India for providing the gift sample of DMF and Acetone.
References
- Spiegel AJ, Noseworthy MM. Use of nonaqueous solvents in parenteralproducts. J Pharm Sci 1963;52:917‑27.
- Asuero AG, Herrador MA, Gonzalez AG. Estimation of pH andautoprotolysis constants in mixtures of aliphatic amides withwater: Medium effect on the 4‑aminoazobenzene system. Talanta1993;40:479‑84.
- Sindreu RJ, Moya ML, Sanchez BF, Gonzalez AG. Solvent effectson the dissociation of aliphatic carboxylic acids in water‑N,N‑dimethylformamide mixtures: Correlation between acidity constantsandsolvatochromic parameters. J Solution Chem 1994;23:1101‑9.
- Patrick JS. Martin’s Physical Pharmacy and Pharmaceutical Sciences.5th ed. Philadelphia: Lippincott Williams and Wilkins; 2006. p. 245‑6.
- Martin A, Wu PL, Velasquez T. Extended Hildebrand solubilityapproach: Sulfonamides in binary and ternary solvents. J Pharm Sci1985;74:277‑82.
- James KC. Regular solutions/nearly regular solutions. In: Solubility andRelated properties. New York: Marcel Dekker; 1986. p. 149‑212 andp. 213‑33.
- Wu PL, Martin A. Extended Hildebrand solubility approach:p‑hydroxybenzoic acid in mixtures of dioxane and water. J Pharm Sci1983;72:587‑92.
- Martin A, Carstensen J. Extended solubility approach: Solubilityparameters for crystalline solid compounds. J Pharm Sci 1981;70:170‑2.
- Martin A, Newburger J, Adjei A. Extended Hildebrand solubilityapproach: Solubility of theophylline in polar binary solvents. J Pharm Sci 1980;69:487‑91.
- Martin A, Wu PL, Adjei A, Lindstrom RE, Elworthy PH. Extended Hildebrand solubility approach and the log linear solubility equation. J Pharm Sci 1982;71:849‑56.
- Martin A, Wu PL, Adjei A, Mehdizadeh M, James KC, Metzler C. Extended Hildebrand solubility approach: Testosterone and testosterone propionate in binary solvents. J Pharm Sci 1982;71:1334‑40.
- Herrador MA, Gonzalez AG. Solubility prediction of caffeine in aqueous N,N‑dimethyl formamide mixtures using the extended Hildebrand solubility approach. Int J Pharm 1997;156:239‑44.
- Beerbower A, Wu PL, Martin A. Expanded solubility parameter approach. I: Naphthalene and benzoic acid in individual solvents. J Pharm Sci 1984;73:179‑88.
- Thimmasetty J, Subramanyam CV, Vishwanath BA, SateshSabu PR. Solubility parameter estimation of celecoxib by current methods. Asian J Res Chem 2009;2:188‑95.
- Derle D, Magar M. Studies on the preparation, characterization and solubility of β‑cyclodextrin‑satranidazole inclusion complexes. Indian J Pharm Edu Res 2006;40:232‑6.
- Mruthyunjayaswamy BH, Mali Patil SM, Raju AS. Spectrophotometric methods for the estimation of satranidazole in pharmaceutical formulations. Indian J Pharm Sci 2001;63:433‑6.
- Shinde SR, Bhoir SI, Pawar NS, Yadav SB, Bhagwat AM. Simultaneous estimation of satranidazole and ofloxacin in tablet dosage form by high performance liquid chromatography. E‑J Chem 2010;7:198‑202.
- Wankhede SB, Nanda RK, Prakash A, Chitlange SS. Simultaneous spectrophotometric estimation of ofloxacin and satranidazole in tablet dosage form. J Pharm Sci 2008;7:92‑4.
- Martin A, Miralles MJ. Extended Hildebrand solubility approach: Solubility of tolbutamide, acetohexamide, and sulfisomidine in binary solvent mixtures. J Pharm Sci 1982;71:439‑42.
- Barton AF. CRC Handbook of Solubility Parameters and Other Cohesion Parameters. 2nd ed. New York: CRC Press; 1983. p. 7‑59 and p. 157‑85.
- Greenhalgh DJ, Williams AC, Timmins P, York P. Solubility parameters as predictors of miscibility in solid dispersions. J Pharm Sci 1999;88:1182‑90.
- Adjei A, Newburger J, Martin A. Extended Hildebrand approach: Solubility of caffeine in dioxane‑water mixtures. J Pharm Sci 1980;69:659‑61.
- Martin A, Paruta AN, Adjei A. Extended Hildebrand Solubility approach: Methylxanthines in mixed solvents. J Pharm Sci 1981;70:1115‑20.