- *Corresponding Author:
- B. K. Jayanna
Department of Chemistry, B. N. M. Institute of Technology, Bengaluru-560 070, India
E-mail: jay_bidarur@yahoo.co.in
| Date of Submission | 21 December 2015 |
| Date of Revision | 10 October 2016 |
| Date of Acceptance | 16 October 2016 |
| Indian J Pharm Sci 2016; 78(5): 657-662 |
This is an open access article distributed under terms of the Creative Commons Attribution-NonCommercial-ShareAlike 3.0 License, which allows others to remix, tweak, and build upon the work non-commercially, as long as the author is credited and the new creations are licensed under the identical terms.
Abstract
Simple and accurate spectrophotometric methods have been developed for the determination of lamotrigine in tablet formulation. The method A was based on the diazotization of lamotrigine followed by coupling with 4-(dimethylamino)benzaldehyde in acid medium to give greenish yellow product with a λmax of 410 nm. The method B also was based on the diazotization of drug and conversion of phenol into nitrosophenol with excess nitrous acid in acid medium to give brown color with a λmax of 448 nm. Thus, methods A and B were used to determine lamotrigine in the range of 1-10 μg/ml and 2.5-12 μg/ml, respectively in the final measured solution. There was no interference from the ingredients commonly found in lamotrigine tablets with these methods. The results compared favorably with those of reported methods and related analytical parameters were calculated.
Keywords
Spectrophotometry, lamotrigine, diazotization, 4-(dimethylamino)benzaldehyde, phenol
Lamotrigine (LMT) is a 6-(2,3-dichlorophenyl)- 1,2,4-triazine-3,5-diamine used for the treatment of acute epilepsy and bipolar disorder. It is also used to treat neurological lesions and as a tranquilizer [1]. The commonly used analytical techniques for the determination of LMT drug in pharmaceuticals are high performance liquid chromatography (HPLC)-diode array detection [2], thin-layer chromatography (TLC) and HPLC [3-7], HPLC-EMS [8], gas chromatography–mass spectrometry (GC-MS) [9], capillary electrophoresis [10], adsorptive stripping voltammetry [11,12], polymer-carbon paste electrode [13], micellar electro kinetic capillary chromatography [14], LC-tandem mass spectrometry [15] and UV-spectrophotometric method [16-21]. HPLC methods [3-8] are very sensitive but need sophisticated instrumentation and skilled hands. In differential pulse voltammetric methods [11,12], the adsorption of the drug on the electrode surface has not been sufficiently strong. Several reported spectrophotometric methods suffer because they are less sensitive and involves tedious extraction procedure.
The aim of the present work is to develop a simple and accurate method for the determination of LMT in pharmaceutical formulations. The diazotization of drug is a significant and thorough reaction in analytical chemistry. The preeminent general reagent for diazotization is nitrous reagent, originated from sodium nitrite and mineral acid in water. We report an effective diazotization of LMT, which occurred exclusively at -4° to -5°. The low temperature can be attained by using ice and salt and thereby minimizing interfering side reactions. In method A, LMT was diazotized with nitrite in acidic medium followed by coupling with 4-(dimethylamino)benzaldehyde to give greenish yellow product having an absorption maximum at 410 nm. An indirect method was used for the determination of LMT in method B. After diazotization of LMT, excess nitrite converts the phenol into nitrosophenol. The formation of nitrosophenol decreases with the proportional increase in concentration of LMT. The proposed method stands as preeminent over the reported method with respect to simplicity, cost effectiveness and the methods require neither extraction nor prior separation of the drug.
Materials and Methods
Ultraviolet (UV)/Vis spectrophotometer of Systronics model 117 with 10 mm matched quartz cells was used for measuring the absorbance. LMT (99.40% purity) was received from Max India’s Pharmaceutical Division, Nanjanagud, Mysore. The tablets Lamosyn-100 (lamotrigine; 100 mg/tablet), Lamosyn-25 (lamotrigine; 25 mg/tablet) of Sun Pharmaceuticals Industries Ltd., Mumbai, India, Lamez OD (lamotrigine; 50 mg/tablet) of Intas Pharmaceutical Pvt. Ltd. Ahmedabad, India and Lametec-50 DT (lamotrigine; 50 mg/tablet) of Cipla Limited, Mumbai, India were procured from local market. Phenol and 4-(dimethylamino)benzaldehyde (Merck India Ltd.), sodium nitrite (BDH) and sulphuric acid (S.D. Fine Chem, Mumbai, India, Sp. gr. 1.84) were used for the experiment. All other chemicals and solvents were of analytical grade.
Standard solutions preparation:
Standard stock solution of LMT (100 μg/ml) was prepared by dissolving 10 mg of LMT in 0.1 mol sulphuric acid and diluting to 100 ml with distilled water. 4-(dimethylamino)benzaldehyde (0.00067 mol) was prepared by dissolving 10 mg of 4-(dimethylamino) benzaldehyde in acetone and then diluted to 100 ml. Phenol (0.05 mol) and sodium nitrite (0.07 mol) were prepared by dissolving each 500 mg in distilled water and diluted to 100 ml. Sulfuric acid (0.72 mol) was prepared by dissolving 2 ml of sulfuric acid of 1.84 sp. gr. in distilled water and diluted to 100 ml.
General procedure:
For method A, different aliquots of the standard LMT (1-10 μg/ml) were transferred into a course of 10 ml volumetric flasks. Sodium nitrite (0.5 ml, 0.07 mol) was added to each flask, cooled in an ice bath by adding salt at a temperature of -4° to -5° and then 1 ml of sulfuric acid (0.72 mol) was added. The resulting diazotized product was coupled with 4-(dimethylamino) benzaldehyde by the addition of 1 ml of this reagent (0.00067 mol) followed by heating on a water bath for 5 min. The emerged greenish yellow colored azo dye was diluted to the mark with distilled water and the absorbance was measured at 410 nm against distilled water.
For method B, different concentrations containing 2.5- 12 μg/ml of LMT were transferred into a sequence of 10 ml volumetric flasks. To each one of these flasks 0.5 ml of sodium nitrite (0.07 mol) was added, cooled in an ice bath to -4° to -5° by adding salt and then 1 ml of sulfuric acid (0.72 mol) was added. Phenol (0.25 ml, 0.05 mol) was added to the diazotization solutions of the drug. The solutions were heated on a water bath for 10 min. After cooling, solutions were diluted to the mark with distilled water and mixed thoroughly. Absorbance was measured at 448 nm against distilled water.
Procedure for the determination of LMT in commercial samples:
Ten tablets of LMT were powdered and mixed thoroughly. The powder equivalent to 10 mg of LMT was weighed precisely and dissolved in 0.1 mol sulfuric acid. The residue was filtered into 100 ml volumetric flask. The residue was washed repeatedly with distilled water and rinses were added to the filtrate. Final volume of filtrate was made up to the mark with distilled water.
Results and Discussion
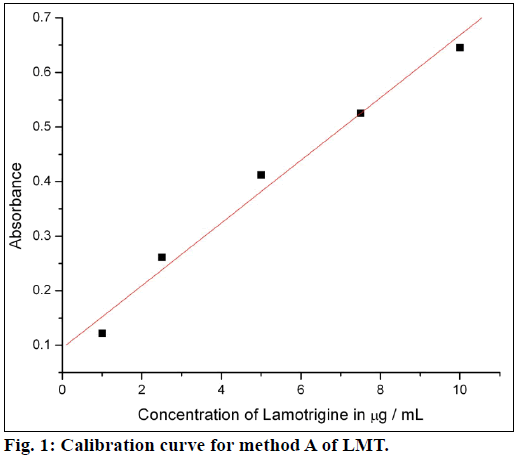
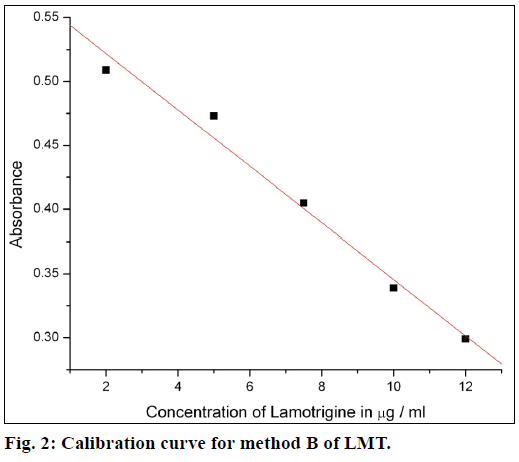
The calibration curves were plotted by proposed procedures shown in Figures. 1 and 2. Absorbance and concentrations were concurrence over range of 1-10 μg/ml for method A and 2.5-12 μg/ml for method B. Other parameters are given in Table 1.
| Parameters | Method A | Method B |
|---|---|---|
| Color | Greenish Yellow | Brown |
| λmax, nm | 410 | |
| Color stability | 4 h | 4481 h |
| Beer’s limit (μg/ml) | 1-10 | 2.5-12 |
| Molar absorptivity (l/mol/cm) |
2.3012×10⁴ | 2.4642×10⁴ |
| Sandel sensitivity (μgcm-2/0.001A) |
0.0112 | 0.01039 |
| Correlation coefficient (R2) | 0.99169 | -0.99141 |
| Regression equation Slope(b) |
0.09993 | 0.56588 |
| Intercept(a) | 0.05636 | -0.02204 |
| Standard deviation | 0.03081 | 0.01331 |
Table 1: Optical Characteristics of the Proposed Procedure
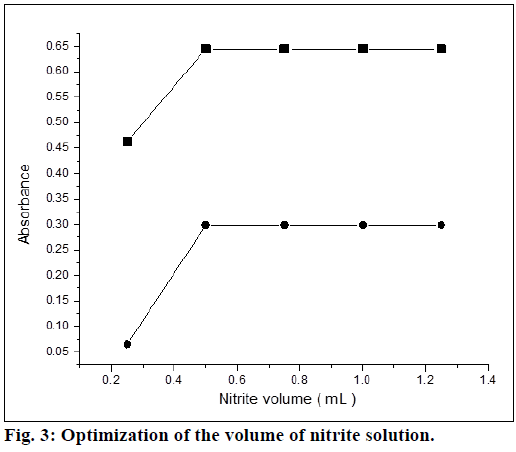
Optimum conditions for rapid and quantitative formation of color products with maximum sensitivity were established. The experimental conditions were performed independently by measuring absorbance by varying one and fixing the LMT concentration in the final measured solutions. Assorted concentrations of sulfuric acid were added to maintain acidic condition for diazotization of drug and measurements were carried out as recommended. Maximum absorbance was observed with volume of 1 ml of sulfuric acid (0.72 mol) in the final measured solution. It was found that, 0.5 ml solution of sodium nitrite (0.07 mol) was sufficient for diazotization (Figure. 3) in both the methods. There was no change in the absorbance at higher concentrations for method A, but change in absorbance was observed for the method B. Thereby, it was recommended to employ same concentration for method B.
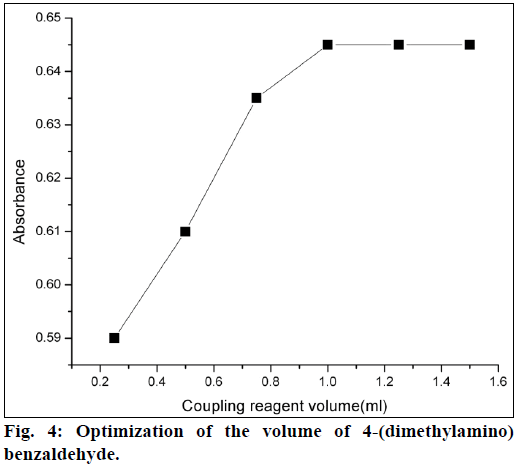
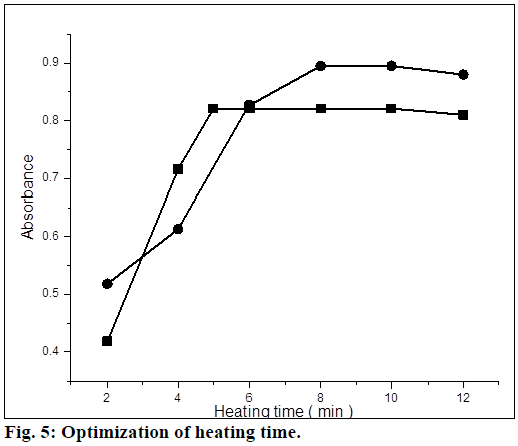
For method A, 4-(dimethylamino)benzaldehyde was used as a coupling reagent. It was found that 1 ml of 4-(dimethylamino)benzaldehyde (0.00067 mol) was sufficient for maximum color development. Further higher concentrations of coupling reagent had no effect on absorbance (Figure 4). The coupling reaction between the 4-(dimethylamino)benzaldehyde and diazotized product was slow at room temperature. So, to increase the reaction rate, the mixed reagent solution was heated on a water bath, and heating time was optimized. The azo dye formation was completed in 5 min and was stable up to 10 min heating. For method B, phenol was used as a reagent. It was observed that 0.25 ml of phenol (0.05 mol) solution was sufficient for maximum color development. Formation of nitrosophenol was slow at room temperature, so the mixed reagent was heated on a water bath for 10 min. It was observed that color intensity of nitrosophenol increased with increasing in heating on a water bath and heating time was optimized (Figure 5).
The dilution of colored solution with different solvents and acids has been verified for both the methods. For method A, 1:1 hydrochloric acid gives the maximum intensity and good stability but absorbance has to be measured after 45 min. Results validated that water gives utmost intensity and stability of the color for 4 h and 1 h for method A and B, respectively.
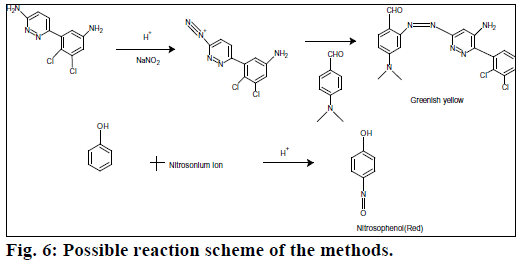
Beer’s law was obeyed over the LMT concentration range of 1.0-10 μg/ml for method A and 2.5-12 μg/ml for method B. The optical characteristics and precise data are given in Table 1. In method A, nitrite reacts with LMT to form diazonium salt, which is then coupled with 4-(dimethylamino)benzaldehyde to give greenish yellow product. In method B, after diazotization of drug, excess nitrite converts phenol into nitrosophenol which imparts red color in acid medium. The reaction progressions for the formation of products are given in Figure 6.
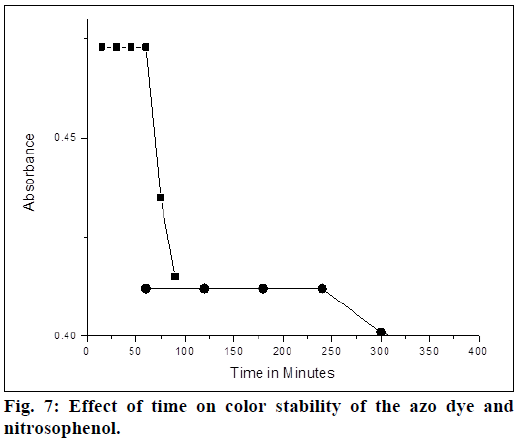
The method A, gives greenish yellow product of azo dye and method B forms nitrosophenol, which imparts red color and changes to brown color on dilution. The absorbance of the colored solution of 5 μg/ml of LMT (in both methods) was measured at various intervals of time. In method A absorbance decreases after 4 h, where as it takes 1 h in method B (Figure 7). Therefore, it is recommended to measure the absorbance with in the first 4 h for method A and 1 h for method B. Precision of the proposed methods were examined by means of percentage of relative standard deviation (% relative standard deviation (%RSD)) and relative error percentage (%RE). Solutions containing three different concentrations 2, 4 and 6 μg of LMT were prepared and evaluated within the same day (intraday) for repeatability and for two consecutive days (interday) for intermediate precision and the analytical results were compiled in Table 2. The relative error percentage and relative standard deviation percentage values were very low and indicating the high precision and the good accuracy of the proposed methods.
| Method | LMTtaken (µg/ml) | Intra-day (n=5)a | Inter-day (n=5)a | ||||
|---|---|---|---|---|---|---|---|
| LMTfound (µg/ml) | (%RSD) | (%RE) | LMTfound (µg/ml) | (%RSD) | (%RE) | ||
| Method A | 2 | 2.02 | 0.95 | 0.01 | 2.2 | 0.95 | 0.1 |
| 4 | 4.01 | 0.85 | 0.0025 | 4.1 | 0.75 | 0.025 | |
| 6 | 5.98 | 0.65 | 0.0033 | 6.2 | 0.85 | 0.033 | |
| Method B | 2 | 2.01 | 0.75 | 0.005 | 2.2 | 1.25 | 0.1 |
| 4 | 4.01 | 0.35 | 0.0025 | 3.9 | 1.15 | 0.025 | |
| 6 | 6.05 | 1.15 | 0.0083 | 6.3 | 1.35 | 0.05 | |
Table 2: Evaluation of Intraday and Interday Accuracy and Precision
To study interference of excipients commonly present in tablets on absorbance, a recovery study was done. Under the experimental condition employed to a known amount of LMT (5 μg/ml), different excipients such as starch, glucose, cellulose, lactose, talc, dextrose, sodium chloride and magnesium stearate were added. Magnesium stearate and cellulose up to a concentration of 30 mg/ml, talc, sodium chloride up to a concentration of 40 mg/ml and starch, glucose, cellulose, lactose, dextrose up to a concentration of 50 mg/ml, didn’t interfere in the study. Recovery for all excipients was close to 100%. However, under the diazotization reaction conditions primary amines and secondary amines interfered for both methods. Nevertheless, the problem of interference does not arise in the analysis of tablets formulations.
The robustness of the methods was studied by comprise of small incremental changes in volume of 4-(dimethylamino)benzaldehyde for method A, phenol for method B and effect of variations was studied on the absorbance of the colored systems. Variations had no significance on results. Further robustness of the method is that it does not involve extraction. For the both methods, ruggedness was depicted for the same concentrations 5 μg under different instruments I and II and by two analysts in the similar laboratory. Intermediate precision valves in both occasions were in the range 0.35 to 0.95% signifying ruggedness of the methods. The results are presented in Table 3.
| Method | LMT Taken (µg/ml) | Amount found in mga | |||
|---|---|---|---|---|---|
| Analyst I±(%RSD) | Analyst II±(%RSD) | Instrument I (UV Spectrophotometer Model-1800, Hitachi)±(%RSD) |
Instrument II (UV Spectrophotometer Model-117, Systronics)±(%RSD) |
||
| Method A | 05 | 4.99±0.35 | 4.90±0.95 | 5.02±0.64 | 4.99±0.95 |
| Method B | 05 | 5.01±0.44 | 4.95±0.85 | 5.01±0.54 | 5.01±0.44 |
Table 3: Ruggedness Studies
The proposed methods were applied for the determination of LMT in different brands of LMT available in the local market. From the results summarized in Table 4, it may be seen that the amount of active ingredient found in pharmaceutical preparation agrees closely with the amount of LMT on the label. Statistical analysis of the results using Student’s t-test for accuracy and F-test for precision revealed no significant difference between the proposed methods and the reference method at the 95% confidence level with respect to accuracy and precision. The calculated t and F-values did not exceed the tabulated values (t=2.77 and F=6.39).
| Pharmaceutical formulation | Label claim(mg)a | Proposed method A | Proposed method B | Reference method |
|---|---|---|---|---|
| Lamosyn-100 | 100 | 99.90±0.15 | 99.70±0.35 | 99.12±0.86[16] |
| t=1.25, F=1.97 | t=2.53, F=4.31 | |||
| Lamosyn-25 | 25 | 99.50±0.45 | 100.10±0.50 | 100.8±0.92[16] |
| t=0.75, F=3.86 | t=2.43, F=1.56 | |||
| Lametec-50 DT | 50 | 99.6±0.25 | 99.70±0.32 | 102.7±1.04[16] |
| t=1.85, F=2.06 | t=0.71, F=1.31 | |||
| Lamez OD | 50 | 100.40±0.70 t=2.74, F=1.47 |
99.10±0.95 t=2.46, F=2.06 |
Table 4: Analysis of Pharmaceutical Formulations
The developed methods were found to be simple and accurate. Statistical comparison of the results for the LMT in tablet formulations by these methods indicated that there are no significant differences. The excipients present in the tablet dosage form do not interfere with the determination of LMT. The methods require neither expensive instruments nor pH maintenance. The proposed method does not require extraction, solvents like dichloromethane, but requires only distilled water and stands atop over the reported methods [16]. Hence, the proposed methods can use readily for the determination of LMT in tablet formulations.
Acknowledgements
The author is thankful to VTU, Belgaum, for providing the fund to carry out the research work.
Financial support and sponsorship
Nil.
Conflicts of interest
The author declares no competing interests.
References
- Sweetman SC. Martindale: The Complete Drug Reference. 34th ed. London: Pharmaceutical Press; 2005.
- Sandra V, Marcio R, Sarah P, Amilcar F, Gilberto A. Determination of lamotrigine in human plasma and saliva using micro extraction by packed sorbent and high performance liquid chromatography-diode array detection: An innovative bioanalytical tool for therapeutic drug monitoring. Microchem J 2017;130:221-8.
- Patil KM,Bodhankar SL. High performance thin layer chromatographic determination of lamotrigine in serum.J Chromatogr B 2005;823:152-7.
- Vidal E, Pascual C, Pou L. Determination of lamotrigine in human serum by liquid chromatography. J Chromatogr B 1999;736:295-8.
- Patil KM, Bodhankar SL. Simultaneous determination of lamotrigine, phenobarbitone, carbamazepine and phenytoin in human serum by high performance liquid chromatography. J Pharm Biomed Anal 2005;39:181-6.
- Castel BMM, Almeida AM, Falcao AC, Macedo TA, Caramona MM, Lopez FG. Lamotrigine analysis in blood and brain by high-performance liquid chromatography. J Chromatogr B 2001;755:119-27.
- Emami J, Ghassami N, Ahmadi F. Development and validation of a new HPLC method for determination of lamotrigine and related compounds in tablet formulations. J Pharm Biomed Anal 2006;40:999-1005.
- Guitton S, Cohen B, Tranchand B, Vignal JP, Droz M, Guillaumont M,et al. Determination of lamotrigine and its metabolites in human plasma by liquid chromatography-mass spectrometry. Rapid Commun Mass Spectrom 2006;831:603-7.
- Panagiota N, Ioannis P, Artemisia D, Chara S, Sotiris A. Development and validation of a GC/MS method for the simultaneous determination of levetiracetam and lamotrigine in whole blood. J Pharm Biomed Anal 2015;102:25-32.
- Lucie B, Hana B, Frantiaek K, Milan G. Determination of lamotrigine by isotachophoresis-Capillary zone electrophoresis. ChemListy 2009:103:166-71.
- Olga DR, Calvo ME, Acros Martinez MJ. Determination of lamotrigine in pharmaceutical preparations by adsorptive stripping voltammetry using screen printed electrodes. Sensors 2008;8:4201-12.
- Calvo MEB, Renedo OD, Martínez MJA. Determination of lamotrigine by adsorptive stripping voltammetry using silver nanoparticle-modified carbon screen-printed electrodes.Talanta 2007;74:59-64.
- Gholivand MB, Malekzadeh G, Torkashv M. Determination of lamotrigine by using molecularly imprinted polymer-carbon paste electrode. J ElectroanalChem 2013;692:9-16.
- Fernando ML, Marlene AS. Simultaneous plasma lamotrigine analysis with carbamazepine, carbamazepine 10,11-epoxide, primidone, phenytoin, phenobarbital, and PEMA by micellarelectrokinetic capillary chromatography. J Anal Toxicol 2003;27:604-13.
- Ghatol S, Vithlani V, Gurule S, Khuroo A, Monif T, Partani P. Liquid chromatography tandem mass spectrometry method for the estimation of lamotrigine in human plasma: Application to a pharmacokinetic study.J Pharm Anal 2013;3:75-83.
- Vinay KB, Siddappa HD, Prasad NR. Development and validation of spectrophotometric methods for the sensitive and selective determination of lamotrigine in pharmaceuticals using bromocresol purple. J Food Drug Anal2009;17:424-33.
- Talekar RS, Dhake AS, Sonaje DB, Mourya VK. Spectrophotometric determination of lamotrigine. Indian J Pharm Sci 2000;62:51-2.
- Rajendraprasad N, Basavaiah K, Vinay KB. Sensitive spectrophotometric determination of lamotrigine in bulk drug and pharmaceutical formulations using bromocresol green. Ecletica Quim 2010;35:55-67.
- Alizadeh N, Khakinahad R, Jabbari A. Spectrophotometric determination of lamotrigine in pharmaceutical preparations and urine by charge-transfer complexation. Pharmazie 2008;63:791-5.
- Rajendraprasad N, Basavaiah K, Vinay KB, Ramesh PJ. Simple and sensitive spectrophotometric determination of lamotrigine in pure form and in dosage forms. Pharm Anal Acta 2012;3:188-92.
- Youssef NF, Taha EA. Development and validation of spectrophotometric, TLC and HPLC methods for the determination of lamotrigine in presence of its impurity. Chem Pharm Bull 2007;55:541-5.
