- *Corresponding Author:
- V. S. Tambe
P. E. S. Modern College of Pharmacy (For Ladies), Moshi, Borhadewadi, Pune-421105
E-mail: vrushali.tambe@rediffmail.com
| Date of Submission | 19 August 2015 |
| Date of Revision | 13 October 2016 |
| Date of Acceptance | 17 October 2016 |
| Indian J Pharm Sci 2016; 78(5): 663-672 |
This is an open access article distributed under terms of the Creative Commons Attribution-NonCommercial-ShareAlike 3.0 License, which allows others to remix, tweak, and build upon the work non-commercially, as long as the author is credited and the new creations are licensed under the identical terms.
Abstract
The present work was focused on development of rapid, specific and novel stability-indicating ultra-performance liquid chromatographic method for simultaneous determination of sildenafil citrate and dapoxetine hydrochloride in bulk and formulation. The drugs were subjected to hydrolysis (acidic, alkaline and neutral), photolytic and thermal stress, as per International Conference on Harmonisation guidelines Q1A (R2). The identification of major stressed degradation products was performed using qudrupole electrospray ionization mass spectroscopy. Separation of drugs from their degradation products was achieved on acquity ultra-performance liquid chromatographic I class equipped with photodiode array detector. Acquity BEH Shield RP18 column was used with the gradient elution and detection wavelength of 294 nm. The method was found to be linear in the concentration range of 2.5-100 µg/ml for both sildenafil and dapoxetine hydrochloride. Limit of detection and quantitation was found to be 0.15-0.45 μg/ml and 0.1-0.3 μg/ml for sildenafil and dapoxetine, respectively. Moreover, the fragmentation pattern of both drugs was studied using ultra-high pressure liquid chromatography-tandem mass spectrometry. Sildenafil was found to be unstable under acidic condition while dapoxetine was found to be unstable under alkaline conditions.
Keywords
Sildenafil, dapoxetine, LC-MS, stability, fragmentation, UPLC
Ultra performance liquid chromatography (UPLC) has emerged from high-performance liquid chromatography (HPLC) with evolution in packing material which improved resolution, speed and sensitivity of analysis. As the particle size decreases to less than 2.5 μm, speed and peak capacity (number of peaks resolved per unit time in gradient separations) can be extended to new limits.
Literature indicates that UPLC is a recent technique in liquid chromatography, which enables significant reductions in separation time and solvent consumption. Additionally, sensitivity of UPLC was much higher than that of conventional HPLC [1]. The sensitivity increase for UPLC detection generally is 2-3 times higher than HPLC separations, depending on the detection technique. Also, mass spectroscopy (MS) detection is significantly enhanced by UPLC due to increased peak concentration with reduced chromatographic dispersion at lower flow rates. It promotes increased source ionization efficiencies. Separation of the components of a sample requires a bonded phase that provides both retention and selectivity [2]. Acquity UPLC BEH Shield RP18 (embedded polar group column) as a stationary phase provides selectivity which complements the acquity UPLC BEH C16 and C8 phases.
Recently, our interest is focused on UPLC method for determination of sildenafil citrate, (5-[2-ethoxy- 5-(4-methylpiperazin-1-yl)sulfonylphenyl]-1- methyl-3-propyl-4H-pyrazolo[4,3-d]pyrimidin-7- one; 2-hydroxypropane-1,2,3-tricarboxylic acid (SIL) and dapoxetine hydrochloride, ((+)-(S)-N,Ndimethyl- 3-(1-naphthyloxy)-1-phenyl-1-propanamine hydrochloride (DAP). SIL is used to treat male erectile dysfunction. It acts by inhibiting an enzyme, cyclic guanosine monophosphate (cGMP)-specific phosphodiesterase type 5 that regulates blood flow
in the penis. It is the most popular and well known medication used for the prime treatment for erectile dysfunction [3]. DAP is a short-acting medication for the treatment of premature ejaculation in men. It increases the time for ejaculation and improves control over ejaculation [4]. The combination of effects of SIL and DAP greatly improve male sexual health. Combination formulation containing 50 mg of SIL and 30 mg of DAP are available in the market.
HPLC is widely used for determination of SIL either from biological fluids or from formulation [5-8]. Dinesh et al. have assessed stability of SIL in formulation at room temperature for one month, but stress testing was not carried out as per International Conference on Harmonisation (ICH) guidelines [9]. Various papers describes identification, quantification of SIL and similar analogues as an adulterant in herbal supplements using HPLC-MS [10-13].
DAP has been analysed either alone or in presence of related substances by HPLC [14-16]. A stability-indicating HPLC method has been developed for DAP. Here authors reported susceptibility of DAP to oxidation. They have also reported that it degrades slightly under acid and alkali conditions but was stable under UV light and heat [17]. But no attempt has been carried out for identification of degradation products. DAP is also quantified along with tadalafil using HPLC [18].
An UV spectroscopic method was reported for simultaneous estimation of SIL and DAP [19]. Similarly, a HPLC [20] and high performance thin layer chromatography (HPTLC) [21] method was reported for quantification of SIL and DAP. There were no reports on stability-indicating LC method for this combination. Most of the drugs undergo physicochemical degradation upon storage and it is essential to characterize the degradation products (DPs) in development process. ICH of technical requirements for registration of pharmaceuticals for human use and other international agencies insist on development of methods that can quantify drugs in presence of degradation products.
Hence, this work was undertaken to develop stabilityindicating UPLC-MS/UV method. Fragmentation pattern for both the drugs was studied. In addition, structures of major degradation products of both drugs under various stress conditions were reported.
Materials and Methods
SIL and DAP were provided as gratis samples by Emcure Pharmaceuticals, Pune. HPLC grade methanol, acetonitrile and ammonium acetate (A.R) were purchased from Merck. HPLC grade water was obtained from Merck and was filtered through 0.2 μm filter before use.
Equipment and chromatographic conditions:
Separation of drugs from their degradation products was achieved on acquity UPLC I class equipped with PDA detector. The detection wavelength was 294 nm. The samples were introduced on acquity BEH Shield RP18 column (100×2.1 mm, 1.7 μm, Waters laboratories Pvt. Ltd) using autosampler (SM-FTN). The data was processed using empower software. Solvent A was a mixture of buffer (50 mM ammonium acetate) and acetonitrile in the ratio of 95:05 (v/v); solvent B consisted of acetonitrile (100%). The flow rate was 0.5 ml/min with a gradient program of (T/%A) 0.01/90; 0.5/90; 3/50; 7.5/20; 8/90 and 10/90. The diluent used was ammonium acetate buffer: acetonitrile (70:30). The column temperature was maintained at 45°. The injection volume was 5 μl with the total run time of 10 min. Other equipments used were hot air oven (Metlab), photostability chamber (Metlab) and analytical balance (Sartoriuos).
UPLC-MS/MS conditions:
It was used to study fragmentation pattern of SIL and DAP. LC-MS/MS system of Waters Xevo TQD was used for acquiring fragmentation pattern of drugs. LCMS was used for identification of degradants formed during forced degradation studies. The column and mobile phase as described above were used. The flow rate of mobile phase was 0.5 ml/min and the injection volume was 5 μl. The analysis was carried out by using electrospray ionization mode (+ve as well as -ve). The source temperature was 650° with capillary voltage and cone voltage as 3.5 kV and 35 V, respectively. Mass range was 50-600 amu. Sheath gas/nebulising gas was nitrogen. Desolvation temperature was 550° with desolvation gas flow rate of 1000 l/h. Masslynx software was used for data processing. Collision activated dissociations (CAD) analyses were carried out with the energy of 3 eV and all the fragmentations were observed in the source.
Standard solutions:
About 50 mg of SIL and 50 mg of DAP was weighed and dissolved in 50 ml of diluent in a 100 ml volumetric flask and volume was made up to 100 ml with the same diluent. The solutions were further diluted to obtain concentrations in the range of 2.5-250 μg/ml.
Optimization of chromatographic conditions:
Detection wavelength was selected based on overlay of UV spectra of both compounds to achieve maximum sensitivity. Various mobile phases were tried to achieve well resolved peaks of the drugs from their degradation products. Acetonitrile and water in various ratios with tri-fluroacetic acid (0.1%), formic acid (pH adjusted to 8 with ammonia solution) as additives were tried as mobile phases.
Sample preparation:
Tablets containing 50 mg of SIL and 30 mg of DAP (Emcure) were analysed. Twenty tablets were accurately weighed and crushed to fine powder. An accurately weighed powdered blend equivalent to 25 mg of SIL and 15 mg of DAP was transferred to a 100 ml volumetric flask containing 25 ml of methanol. The solution was ultrasonicated for 10 min to assure complete extraction of drugs from powdered blend and the volume was made up to 100 ml with methanol. The filtered solution was further diluted with mobile phase to obtain concentrations of 25 and 15 μg/ml of SIL and DAP, respectively.
The method was validated for specificity, accuracy and precision to check its suitability for intended use.
Specificity:
Specificity was demonstrated using degradation studies. Forced degradation was carried out by subjecting the drugs to acid, base and neutral stress. The drugs were also subjected to dry heat, photolysis in dry and solution state. Acid stress was carried out by subjecting 10 mg of drug sample to 1 N HCl and heated at 90° for 6 h. For basic stress, drugs were also mixed with 1 N NaOH and heated at 90° for 6 h. For neutral stress, drugs were mixed with water and kept at room temperature for 24 h. Drugs were also subjected to dry heat in oven at 90° for 6 h. Photostability study was carried out as per ICH guidelines. The drugs in dry state were subjected to UV light at an intensity of 1.2 MLux·h. Initially, degradation was carried out for single drug and its chromatogram was acquired. The stressed testing of formulation was then carried out and the solutions were further diluted with diluents and analysed for degradation products.
Linearity, limit of detection (LOD) and limit of quantification:
The detector response was plotted with different concentrations of SIL and DAP to establish the type of relationship between drug concentration and peak area. Standard stock solutions were prepared by dissolving SIL and DAP in methanol. The standard solution was then diluted to obtain drug concentrations in the range of 2.5-250 μg/ml. The solutions were prepared in triplicate by individual weighing of drugs and then analysed by proposed method. Regression data analysis was performed using least squares linear regression statistical analysis. LOD and LOQ were calculated from the equations of LOD=3.3×s/m and LOQ=10×s/m, using the standard deviation of residuals (s) and the slope of the calibration curve (m).
Precision:
Repeatability was determined by taking six measurements of standard and test solutions at concentration of 25 μg/ml for SIL and 15 μg/ml for DAP from the same stock solution. Intermediate precision was determined by analysing independently prepared test and standard solutions by different analysts on different days.
Accuracy:
The recovery of standards added in the first step before extraction was determined. Briefly, quantities of 20, 25 and 30 mg of SIL were spiked separately in the blend corresponding to 80, 100 and 120% of the concentration of the test solution. These solutions were also spiked with 12, 15 and 18 mg of DAP. Further, extraction procedure as elaborated in assay section was exercised. The experiment was performed in triplicate. Percent recovery and RSD (%) were calculated.
Results and Discussion
The method was aimed to separate degradation products formed under various stress conditions from SIL and DAP as there is no report till date for this combination. Accordingly, pH, the composition of the mobile phase, organic modifiers, flow rate, temperature of the column and wavelength were optimized. Gradient programme was chosen to shorten run time.
Various mobile phases were tried to achieve well resolved peaks of the drugs from their DPs. Initially, methanol and water in various ratios were tried as mobile phase. Multiple peaks and baseline drift were observed for DAP with increase in column back pressure. Retention time was found to increase with increase in proportion of water. This may be due to presence of nonpolar naphthalene and benzene ring in the structure which increases its affinity for the nonpolar stationary phase. DAP was found to elute later due to its higher log P value. SIL showed peak tailing. Addition of acids resulted in broad peak for DAP, but did not significantly improve the peak shape. As the combination of ammonium acetate or formate with acetonitrile gave sharp peaks, it was decided to use this combination further. Acetonitrile and ammonium formate were tried on UPLC system in various ratios with addition of trifluoroacetic acid (TFA). This has resulted in improved shape but similar retention times for both drugs. Finally, gradient system as described prior has given well resolved peaks from their DPs.
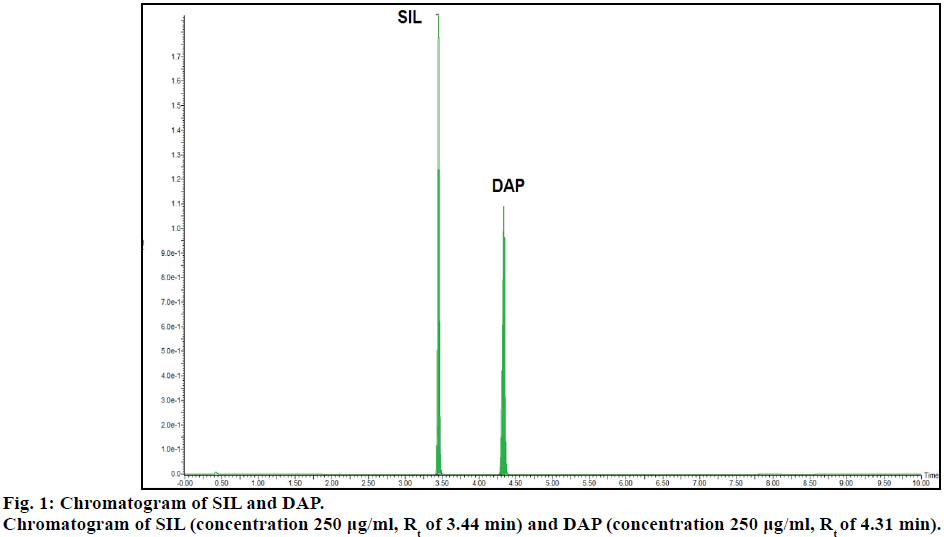
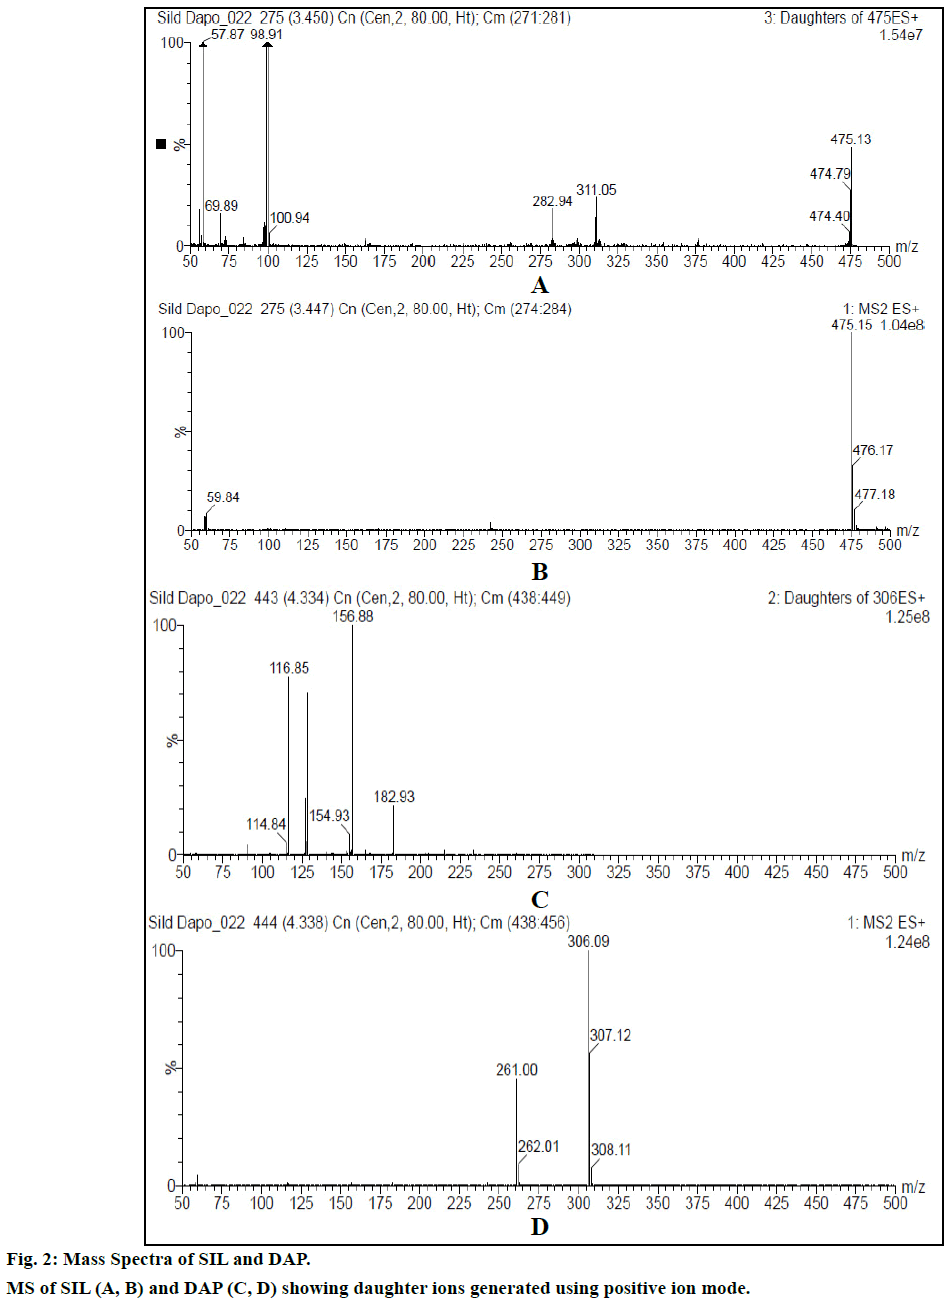
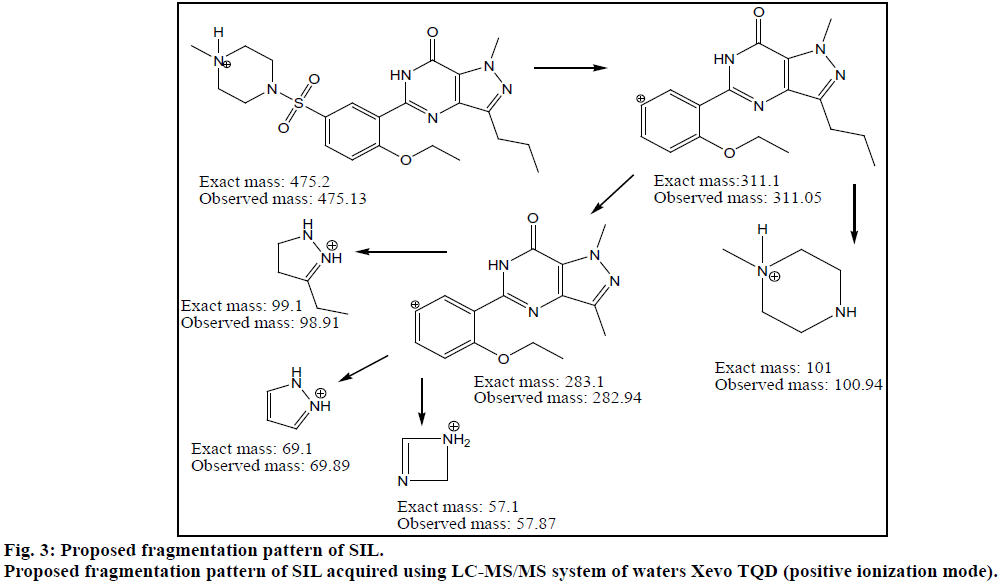
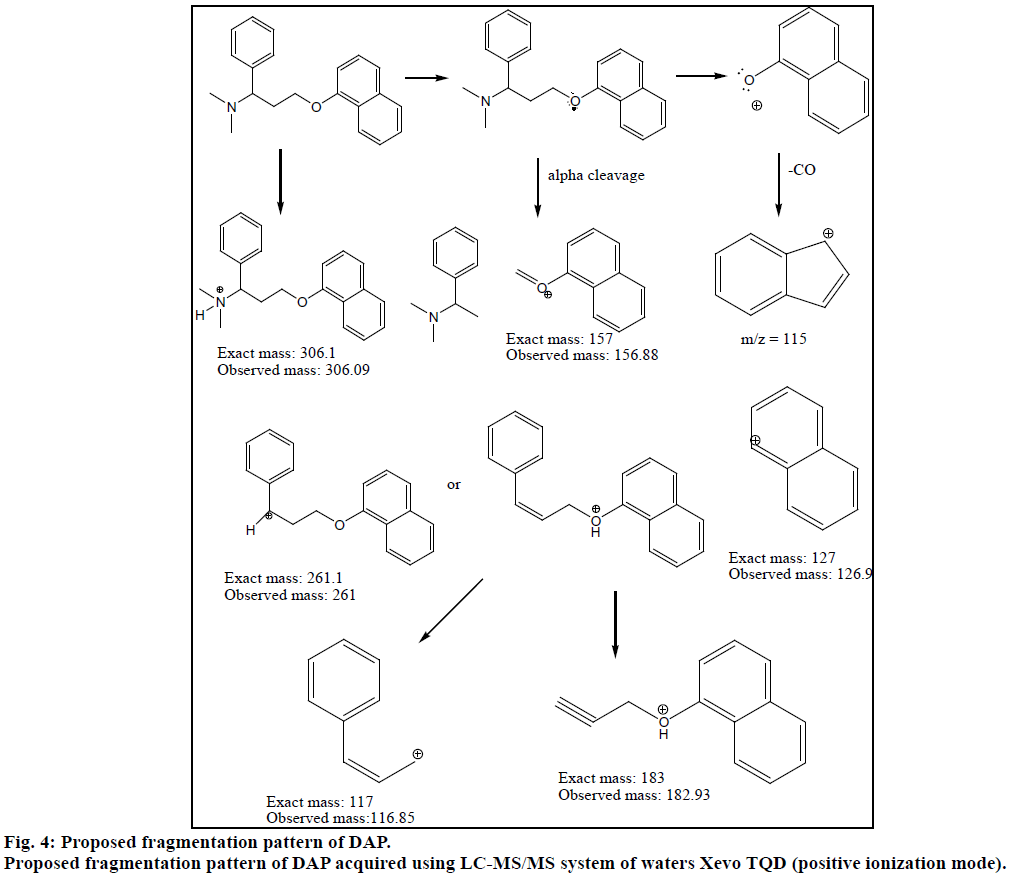
Chromatogram (Figure 1) shows well resolved sharp peaks for both drugs. The retention time of SIL was 3.44 min and that of DAP was 4.31 min. This paper also reflects fragmentation pattern of SIL and DAP. The fragmentation pattern of both the drugs was established using positive electrospray ionization. The mass spectrum acquired for SIL and DAP are shown in Figure 2. Both drugs were also found to be ionized under negative ionization mode. Still, the intensity of peaks was significantly higher in positive ionization mode as compared to negative ionization mode. The mass fragments produced for SIL using positive ionization mode are shown in Figure 3. It showed fragments at m/z values of 311.05, 282.94, 98.91, 100.94, 69.89 and 57.87. The molecular ion peak was observed at m/z of 475.13. Various fragments produced for DAP using positive electrospray ionization are shown in Figure 4. DAP showed fragment at m/z of 261, 182.93, 156.88 and 116.85. Its molecular ion peak was observed at 306.09.
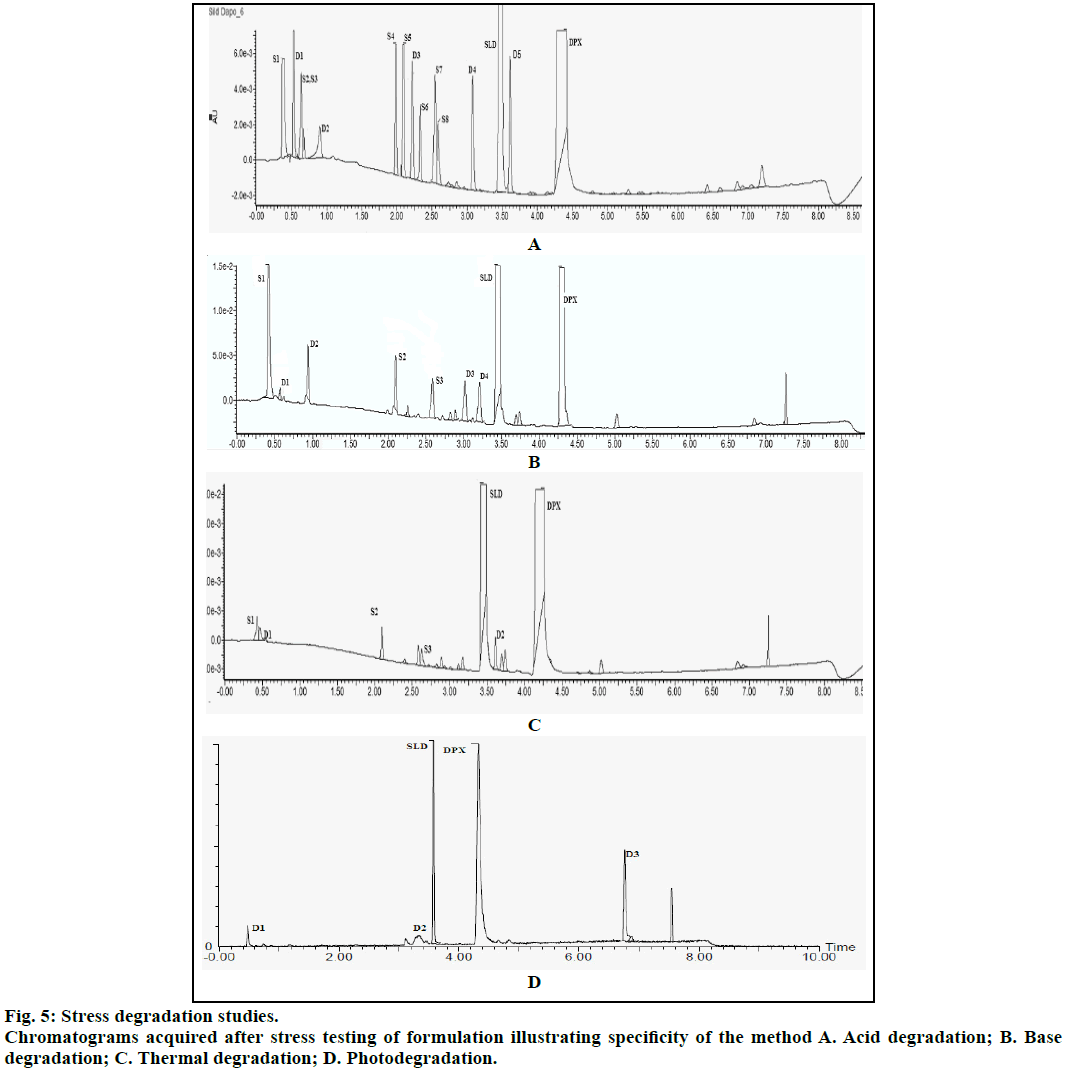
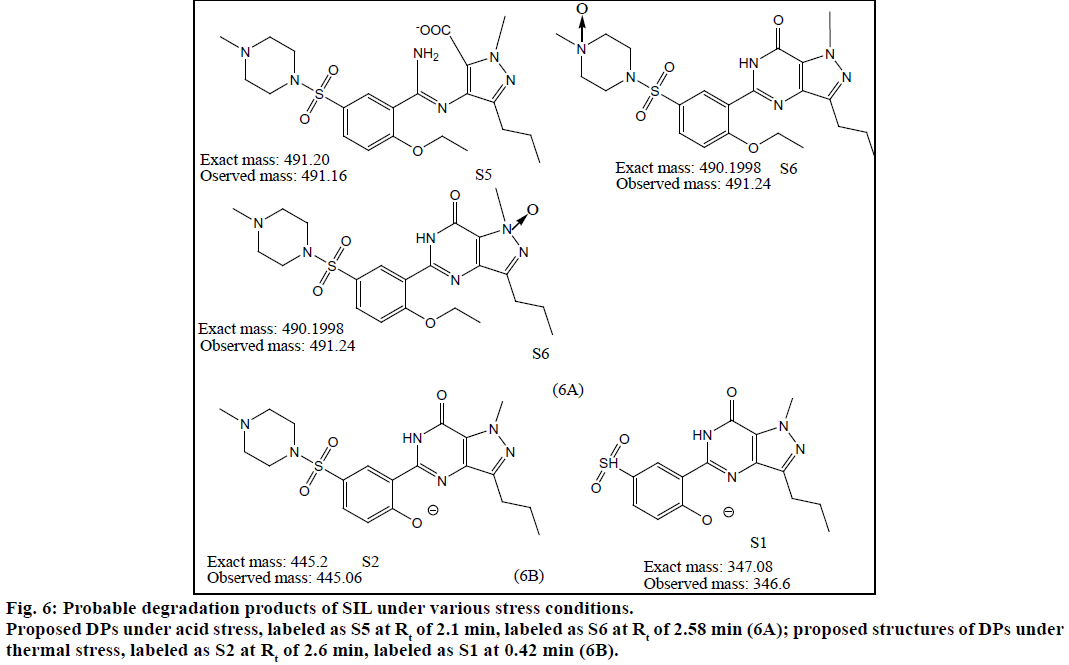
The method was validated for specificity, linearity, LOD, LOQ and precision as per ICH guidelines. Chromatograms obtained under various degradation conditions are shown in Figure 5. The peaks originating from degradation products were well resolved from drug peaks proving the specificity of the method. Peak purities of the stressed samples were checked by using PDA detector and the purity angle was found to be within the purity threshold limit in all stressed samples which demonstrates the homogeneity of analyte peak. Absorptivity of DAP was found to be greater than SIL. SIL was found to degrade more under acidic conditions as compared to basic, thermal and UV irradiation. Its TIC revealed presence of m/z peaks at 445.79 (-ve mode), 447.09 and 461.02 under acidic stress. It was found to degrade by hydrolysis of amide group resulting in generation of amine and acidic functional groups. This product was seen at the m/z value 491.16 in -ve ESI mode. Also, SIL probably was oxidized in acidic medium resulting in the formation of various oxidation products. Peaks were also observed at m/z values of 360.16 (-ve mode), 444.98, 442.96 and 460.62 under basic stress. Thermally stressed samples showed major degradation products at m/z of 346.6 and 445.06. The possible structures of major degradation products of SIL are proposed in Figure 6.
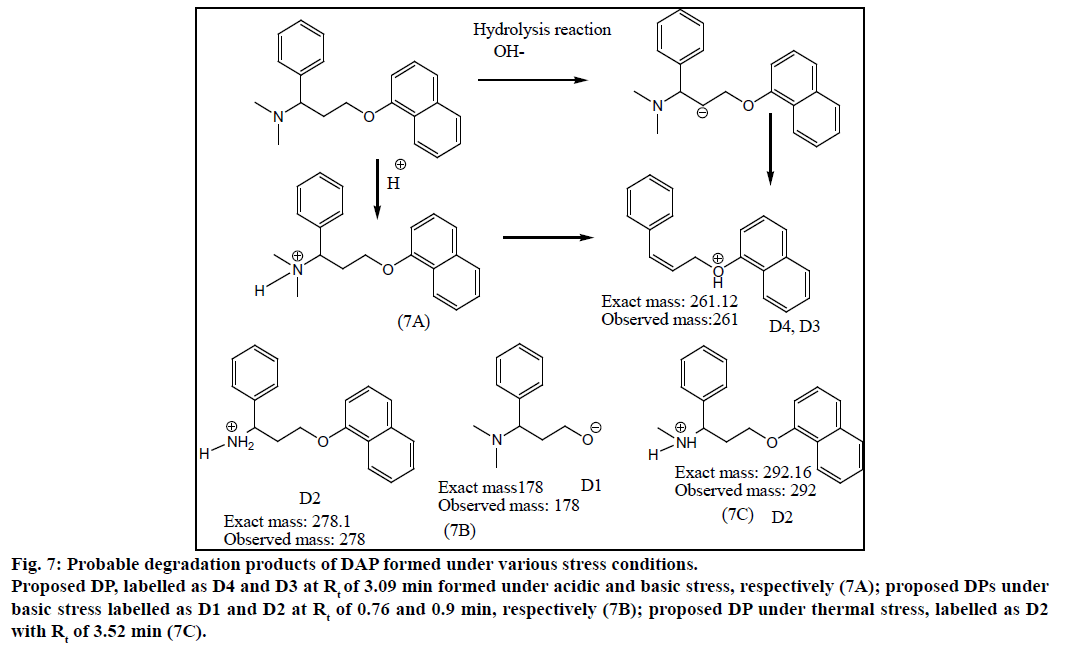
DAP was found to be more susceptible to degradation under basic conditions as compared to thermal, acidic and UV light. It was found to evolve ammonia under basic stress. It showed m/z values of degradation products at 255.01 (-ve mode), 243.34 under acidic stress. While for basic stress they were observed at m/z of 278, 261.08 and 178. Thermal stress revealed products at m/z of 292, 242.13. The degradation products of SIL did not appear at the retention time of DAP and vice versa proving specificity of the method. The probable degradation products of DAP are shown in Figure 7.
Figure 7: Probable degradation products of DAP formed under various stress conditions.
Proposed DP, labelled as D4 and D3 at Rt of 3.09 min formed under acidic and basic stress, respectively (7A); proposed DPs under basic stress labelled as D1 and D2 at Rt of 0.76 and 0.9 min, respectively (7B); proposed DP under thermal stress, labelled as D2 with Rt of 3.52 min (7C).
The calibration curve was linear in the range of 0.5- 250 μg/ml for both SIL and DAP. LOD and LOQ values were calculated as 0.15-0.45 μg/ml; and 0.1- 0.3 μg/ml for SIL and DAP, respectively. This reflects capability of the method to analyse dilute solutions. The correlation coefficient was found to be 0.999 and 0.998, respectively for SIL and DAP. The values of y-intercept were found to be minimal. In addition, the residuals were randomly distributed around mean and do not show any tendency. The value of F calculated experimentally was compared against the critical value of F found in statistical tables at the 95% confidence level. The value of Ftabulated was greater than Fexperimental proving the linearity of the method. The method was found to be accurate and capable of extracting and quantitation of the analytes. Percentage recovery was found to be in the range of 99.8-100.2% for both drugs. The parameter of precision considered was repeatability and intermediate precision. There was no significant difference between the assay of SIL and DAP. Also, the %RSD of the peak area was found to be less than 2. The accuracy of the proposed method was proved by recovery studies as indicated in Table 1. The method was successfully applied for quantitation of both drugs from marketed tablet formulation without interference from excipients. The % assay of both drugs was found to be 99.9% w/w. SIL was found to be susceptible to degradation under acidic conditions while DAP was degraded extensively under basic conditions with the evolution of ammonia. The result of % degradation of each drug in formulation is shown in Table 2. This paper has also focused on fragmentation pattern of SIL and DAP. It can be concluded that a selective, sensitive, precise, accurate UPLC method for the simultaneous determination of SIL and DAP has been developed, optimized and validated. The proposed method is stability-indicating as it can resolve the peaks of SIL and DAP from the numerous degradation products formed under variety of stress conditions within a short run time of 10 min.
| Parameters (units) | SIL | DAP | |
|---|---|---|---|
| Linearity (µg/ml) | 2.5-100 | 2.5-100 | |
| Correlation coefficient | 0.999 | 0.998 | |
| Slope (mAUμg−1/ml) | 28525 | 30947 | |
| Intercept | -26144 | -4684 | |
| σ2 e | 114582133.5 | 290948855 | |
| σ2lof | 331374222.8 | 384835484 | |
| F calculated (12 and 4 degrees of freedom) | 2.89 | 1.32 | |
| F tabulated (12 and 4 degrees of freedom) | 3.26 | 3.26 | |
| % assay (S.D.) | 99.9 (1.3) | 99.9 (1.2) | |
| Recovery (% RSD) n=3 |
At 80% | 100.1 (0.3) | 100.2 (0.2) |
| At 100% | 100.1 (0.1) | 99.9 (0.3) | |
| At 120% | 99.8 (0.3) | 100.1 (0.3) | |
| LOD(μg/ml) | 0.15 | 0.1 | |
| LOQ(μg/ml) | 0.45 | 0.3 | |
| Precision (n=6) |
Repeatability, mean % assay (RSD) | 100.1 (0.12) | 99.9 (0.32) |
| Intermediate precision mean % assay (RSD) |
100.2 (0.43) | 100.3 (0.41) | |
Table 1: Summary of Method Validation Parameters
| Type of stress | % DegradationSIL | % DegradationDAP |
|---|---|---|
| Acid stress | 26.06 | 19.70 |
| Base stress | 20.80 | 24.87 |
| Dry heat | 8.7 | 9.1 |
| Photostability (solution) | Stable | Stable |
| Photostability (dry) | 12.54 | Stable |
Table 2: Percentage Degradation of Drugs in Formulation Under Various Stress Conditions
Financial support and sponsorship:
Nil.
Conflicts of interest:
The authors declare no competing interests.
References
- Kurbanoglu S, Miguel PRS, Uslu B, Ozkan SA. Stability-indicating UPLC method for the determination of bisoprololfumarate and hydrochlorothiazide: Application to dosage forms and biological sample. Chromatographia 2014;7:365-71.
- Otasevic B, Milovanovic S, ZecevicM, Golubovic J, Protic A. UPLC method for determination of moxonidine and its degradation products in active pharmaceutical ingredient and pharmaceutical dosage form. Chromatographia 2014;77:1090-18.
- Langtry HD, Markham A. Sildenafil: A review of its use in erectile dysfunction. Drugs 1999;57:967-89.
- Clement P, Bernabe J, Gengo P. Supraspinal site of action for the inhibition of ejaculatory reflex by dapoxetine. EurUrol 2007;51:825.
- Miyoung L, David M. Determination of sildenafil citrate in plasma by high-performance liquid chromatography and a case for the potential interaction of grapefruit juice with sildenafil citrate. Ther Drug Monit2001;23:21-6.
- Daraghmeh N, Al-Omari M, Badwan AA, Jaber AMY. Determination of sildenafil citrate and related substances in the commercial products and tablet dosage form using HPLC. J Pharm Biomed Anal 2001;25:483-92.
- Sheu M, Wu A, Yeh G, Hsia A, Ho H. Development of a liquid chromatographic method for bioanalytical applications with sildenafil. J Chromatogr B 2003;791:255-62.
- Tracqui A, Ludes B. HPLC-MS for the determination of sildenafil citrate (Viagra) in biological fluids. Application to the salivary excretion of sildenafil after oral intake. J Anal Toxicol2003;27:88-94.
- Dinesh ND, Vishukumar BK, Nagaraja P, Made GNM, Rangappa KS. Stability-indicating RP-LC determination of sildenafil citrate (Viagra) in pure form and in pharmaceutical samples. J Pharm Biomed Anal 2002;29:743-8.
- Zhu X, Xiao S, Chen B, Zhanga F, Yao S, Wan Z, et al. Simultaneous determination of sildenafil, vardenafil and tadalafil as forbidden components in natural dietary supplements for male sexual potency by high performance liquid chromatography electrospray ionization mass spectrometry. J Chromatogr A 2005;1066:89-95.
- Singh S, Prasad B, Savaliya AA, Shah RP. Strategies for characterizing sildenafil, vardenafil, tadalafil and their analogues in herbal dietary supplements and detecting counterfeit products containing these drugs. Trends Anal Chem2009;28:13-28.
- Goker H, Coşkun M, Ayhan-Kilcigil G. Chromatographic separation and identification of sildenafil and yohimbineanalogues illegally added in herbal supplements. In: Dhanarasu S, editor, Chromatography and its applications. Rijeka,Croatia: InTech; 2012, p. 51-68.
- Tseng M, Lin J. Determination of sildenafil citrate adulterated in a dietary supplement capsule by LC/MS/MS. J Food Drug Anal 2002;2:112-9.
- Mehta P, Sahoo U, Seth AK. Development and validation of a RP-HPLC method for the determination of dapoxetine hydrochloride in pharmaceutical formulation using an experimental design. Int J Pharm Sci Rev Res 2011;2:76-82.
- Rohith T, Ananda S. Development and validation of HPLC method for the determination of process related impurities in dapoxetine hydrochloride.Int J Res Meth PhysChem 2013;1:74-82.
- Rohith T, Ananda S. A validated chiral liquid chromatographic method for the enantiomeric separation of dapoxetine hydrochloride. Int J Adv Res Pharm Biosci 2012;3:311-9.
- Liew K, Peh KK. Stability-indicating HPLC-UV Method for determination of dapoxetineHCl in Pharmaceutical Product.Acta Pol Pharm2014;3:393.
- Giri AD, Bhusari VK, Dhaneshwar SR. Validated HPLC method for simultaneous quantitation of tadalafil and dapoxetine hydrochloride in bulk drug and formulation.Int J Pharm PharmSci 2012;2:654-8.
- Prajapati CA, Patel BS. Development and validation of spectrophotometric method for simultaneous determination of sildenafil citrate and dapoxetine hydrochloride in their combined dosage formulation. Pharma Tutor 2014;11:84-8.
- Dhaduk DM, Jadeja BG, Patel HA, Rathod BG, Patel PB. Estimation of sildenafil citrate and dapoxetine hydrochloride in their combined dosage form by validated HPLC method.Inventi Rapid: Pharm Anal Quality Assurance 2012.
