- *Corresponding Author:
- Z. Liu
Department of Clinical Laboratory, Jiangxi Provincial Children’s Hospital, Nanchang 33000, China
E-mail: tliuzh@jnu.edu.cn
| Date of Received | 15 October 2019 |
| Date of Revision | 22 December 2019 |
| Date of Acceptance | 21 January 2020 |
| Indian J Pharm Sci 2020;82(2):270-281 |
This is an open access article distributed under the terms of the Creative Commons Attribution-NonCommercial-ShareAlike 3.0 License, which allows others to remix, tweak, and build upon the work non-commercially, as long as the author is credited and the new creations are licensed under the identical terms
Abstract
To explore the structural requirements and inhibitory mechanism of Src inhibitors, the comparative molecular field analysis, comparative molecular similarity indices analysis and three-dimensional quantitative structure-activity relationship and molecular docking of 45 substituted thienopyridine carbonitriles as tyrosine kinase pp60src inhibitors was conducted. Three three-dimensional quantitative structure-activity relationship models showed high predictabilities with cross-validated correlation coefficient and predictive correlation coefficient values of 0.793 and 0.887 for comparative molecular field analysis and 0.624 and 0.793 for comparative molecular similarity indices analysis, respectively. Docking results indicated that 4 compounds with high inhibitory activity penetrated into the active pocket of tyrosine kinase pp60src and formed stable hydrogen bonds with the binding pocket of tyrosine kinase pp60src. Leu273, Lys295, Thr338, Asp348, and Ser345 of tyrosine kinase pp60src are important residues. The results could be of great value in designing novel substituted thienopyridine carbonitriles with more potent Src kinase inhibitory activity.
Keywords
Non-receptor tyrosine kinase, comparative molecular field analysis, comparative molecular similarity indices analysis, three-dimensional quantitative structure-activity relationship, molecular docking
Protein tyrosine kinases (PTKs) can catalyze the phosphorylation of a tyrosine residue on substrate proteins and are classified into two types, receptor protein tyrosine kinase and non-receptor protein tyrosine kinase. Non-receptor tyrosine kinase (Src), a kind of well-known non-receptor protein tyrosine kinase, plays a critical role in the regulation of many normal cellular transduction pathways such as cell proliferation[1], differentiation, adhesion, apoptosis and angiogenesis[2]. It is a prototypic member of a family of kinases (Src Family Kinases, SFKS) including Src, Yes, Fyn, Lyn, Lck, Hck, Fgr, Blk and Yrk. In most normal cells, Src is expressed at low levels. But as reported, Src is over-expressed in a variety of human tumor types[3-5], osteoporosis[6] and bone disease[7], which indicated that lower the activity of Src kinase is profoundly significant. Therefore, Src exists as a therapeutic target for tumors, bone and other diseases. In recent years, a good number of Src kinase inhibitors have been identified. These include various heteroaromatic compounds, such as pyrazolopyrimidines[8], pyrrolopyrimidines[9], pyridopyrimidines[10], quinolines[11], quinazolines[12], indolinones[13] and others. Although many inhibitors have been reported, most of these have poor specificity. Designing selective Src kinase inhibitors is challenging because of the highly homologous nature of the domain within the Src family.
Three-dimensional quantitative structure-activity relationship (3D-QSAR) can analyze the structure factors of compounds with the same structure in 3D space, build pharmacophore models with high predictive abilities and map the characteristics of receptor sites. Comparative molecular field analysis (CoMFA) is one of the most important 3D-QSAR research methods, which can explore the properties of compounds through the studies of electrostatic field and steric field produced by non-covalent interaction of compounds and receptors[14]. Comparative molecular similarity indices analysis (CoMSIA) is an extension of the CoMFA method. Compared to CoMFA, it takes Gaussian functions that related to distance as its molecular fields energy functions. CoMSIA can define 5 kinds of molecular fields, steric, electrostatic, hydrophobic, hydrogen-bond donor and hydrogenbond acceptor[15].
Docking is an operational process, in which receptors and drugs can identify each other and form molecular complex by space and energy matching, thus can predict the structure of the complex. It’s a kind of important target-based drug design method.
3D-QSAR and docking analysis has previously been used to understand the structure-activity relationship of Src inhibitors and develop novel potential Src inhibitors with better activity. Fang et al reported theoretical studies of QSAR and molecular design on a novel series of ethynyl-3-quinolinecarbonitriles as Src inhibitors[16]. Anwer et al. conducted a QSAR study on a series of indolin-2-ones acting as non-receptor Src tyrosine kinase Inhibitors[17]. However, so far, the structure-activity relationship and inhibitory mechanism of Src inhibitors of substituted thienopyridine carbonitriles remain largely unknown. In this investigation, 3D-QSAR studies including CoMFA and CoMSIA analysis and docking analyses on substituted 2-phenyl-, 2-thienyl-7- phenylamino-thieno[3,2,-b]pyridine-6-carbonitriles,7- phenylamino-thieno[3,2-b]pyridine-6-carbonitriles, and 7-[(2,4-dichloro-5-methoxyphenyl)-amino]-2- heteroaryl-thieno[3,2-b] pyridine-6-carbonitriles as potent Src inhibitors reported by Boschelli et al.[18-20] were conducted. These results could not only help to understand the structure-activity relationship of Src inhibitors but also to design new compounds with higher inhibitory activity against Src.
Materials and Methods
Data sets:
A set of 45 substituted thienopyridine carbonitriles synthesized by Boschelli et al [18-20] was selected. Their structures and biological data are listed in Table 1. The index of the biological activity of the compounds was expressed along with IC50 values. The IC50 values were converted to pIC50 (-logIC50) values and used as dependent variables in the 3D-QSAR.
Molecular modeling and alignment:
Molecular modeling was performed using molecular modeling software package SYBYL-X 2.1 (Tripos, St Louis, MO, USA). The compounds were charged with the Gasteiger-Hückel and the preliminary conformational search was performed. The energy was minimized for 1000 steps using Tripos force field and the Powell method and the termination setting was 0.001 kcal/(mol×A). The optimized conformations through molecular mechanics conformational search were obtained and submitted to CoMFA and CoMSIA analysis.
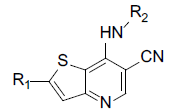
Molecular alignment is the base of 3D-QSAR modeling. Molecular alignment hypothesized that the ligands that were to be analyzed should interact with receptor binding sites in the same or similar mode. To make sure the pharmacophore of the ligands has the same spatial distribution, selection of the composite parts is an important factor for CoMFA and CoMSIA analysis. The compounds that were used in this investigation had the same skeleton, but with different substituents. Thus public skeleton was used for molecular alignment. Here compound 14, one of the compounds with the highest biological activity was chosen as the template. The public skeleton that used for alignment of the training set was shown in fig. 1. The results of the alignment were shown in fig. 2.

Fig. 1: Public skeleton of thienopyridine carbonitriles used for alignment

Fig. 2: Overall alignment of the molecules used in the 3D-QSAR study
CoMFA and CoMSIA setup:
CoMFA and CoMSIA analyses were performed by SYBYL-X 2.1. In CoMFA analysis, the electrostatic and steric fields were included in the field analysis. An sp3 carbon atom with 0.2 nm grid spacing and 0.152 nm van der Waals radium were used as the probe. The default cut-off energy for both the steric and electrostatic field was set to 125.46 kJ·mol-1. In addition to the electrostatic and steric fields, hydrophobic, hydrogen bond acceptor and hydrogen bond donor descriptor fields were calculated in CoMSIA analysis.
The PLS methodology was used for statistical analysis which can identify the quality of CoMFA and CoMSIA models. Here leave-one-out (LOO) cross-validation method was performed to get the optimum number of components. The column filtering value was set as 8.4 kJ·mol-1, and none-cross-validation was employed to do regression analysis. Among the results, the crossvalidation correlation coefficient (q2) can represent the stability of the models, and the none-crossvalidation coefficient (r2), standard error estimate (SEE), F-estimated value (F) and predictive correlation coefficient (r2 pred) can reflect the fitting degree of the models.
Molecular docking:
To understand the binding mechanism and interaction mode of Src kinase with its inhibitors as well as the binding conformation of the ligand better, molecular docking was employed by using the Surflex dock module in SYBYL-X 2.1. The crystal structure of Src kinase with an inhibitor AP23464 was retrieved from RCSB Protein Data Bank (PDB entry code: 2BDJ). Before docking, all the water molecules and ligands were removed and the polar hydrogen atoms and AMBER7FF99 charges were added to the protein. MOLCAD surfaces were generated for visualizing the binding mode of the docked Scr kinase-ligand complexes.
Results and Discussion
CoMFA and CoMSIA methods in SYBYL-X 2.1 were used to generate the 3D-QSAR model to evaluate how the changes in 3D structural features of chemical substituent groups affected inhibitory activity. Thirty five substituted thienopyridine carbonitrile compounds were selected as the training set that the range of pIC50 values of those compounds covers the values of the entire 45 compounds, then the 10 remaining compounds were used as a test set. The models of CoMFA and CoMSIA were both based on the training set (Table 1). Internal statistical validation by PLS analysis conferred significant parameters was shown in Table 2.
 |
||||
|---|---|---|---|---|
| Compounds | R1 | R2 | IC50, nM | pIC50 |
| 1* |  |
 |
34 | -1.53 |
| 2 |  |
 |
13 | -1.11 |
| 3 |  |
 |
50 | -1.70 |
| 4* |  |
 |
980 | -2.99 |
| 5 |  |
 |
140 | -2.15 |
| 6 |  |
 |
53 | -1.72 |
| 7 |  |
 |
7.2 | -0.86 |
| 8 |  |
 |
67 | -1.83 |
| 9 |  |
 |
1300 | -3.11 |
| 10 |  |
 |
14 | -1.15 |
| 11 |  |
 |
25 | -1.40 |
| 12 |  |
 |
420 | -2.62 |
| 13* |  |
 |
8.2 | -0.91 |
| 14 |  |
 |
7.2 | -0.86 |
| 15 |  |
 |
7.4 | -0.87 |
| 16 |  |
 |
17 | -1.23 |
| 17 |  |
 |
52 | -1.72 |
| 18 |  |
 |
9.1 | -0.96 |
| 19* |  |
 |
11 | -1.04 |
| 20 |  |
 |
13 | -1.11 |
| 21 |  |
 |
23 | -1.36 |
| 22* |  |
 |
110 | -2.04 |
| 23 |  |
 |
8.8 | -0.94 |
| 24 |  |
 |
15 | -1.18 |
| 25 | H |  |
2500 | -3.40 |
| 26 |  |
 |
250 | -2.40 |
| 27* |  |
 |
34 | -1.53 |
| 28 |  |
 |
13 | -1.11 |
| 29 |  |
 |
21 | -1.32 |
| 30 |  |
 |
>10000 | -4.00 |
| 31 |  |
 |
50 | -1.70 |
| 32 |  |
 |
13 | -1.11 |
| 33 |  |
 |
21 | -1.32 |
| 34 |  |
 |
7.2 | -0.86 |
| 35 |  |
 |
25 | -1.40 |
| 36 |  |
 |
13 | -1.11 |
| 37 |  |
 |
52 | -1.72 |
| 38* |  |
 |
56 | -1.75 |
| 39 |  |
 |
13 | -1.11 |
| 40* |  |
 |
51 | -1.71 |
| 41* |  |
 |
300 | -2.48 |
| 42 |  |
 |
13 | -1.11 |
| 43 |  |
 |
14 | -1.15 |
| 44 |  |
 |
47 | -1.67 |
| 45 |  |
 |
>10000 | -4.00 |
Table 1: Structures of Src Inhibitors used in 3d-Qsar Analysis
| PLS | CoMFA | CoMSIA |
|---|---|---|
| q2 | 0.739 | 0.624 |
| r2 | 0.997 | 0.991 |
| ONC | 7 | 6 |
| SEE | 0.053 | 0.091 |
| F values | 1232.712 | 495.174 |
| r2pred | 0.887 | 0.793 |
| Fraction | ||
| Steric | 0.561 | 0.276 |
| Electrostatic | 0.439 | 0.42 |
| Donor | - | 0.089 |
| Acceptor | - | 0.025 |
| Hydrophobic | - | 0.191 |
Table 2: Pls Statistics of the Comfa and Comsia 3d-Qsar Models
The model of CoMFA with a better cross-validated correlation coefficient value (q2 = 0.739) is a suitable model for predictive capability. Both of the predicted and experimental pIC50 values of the 45 substituted thienopyridine carbonitrile compounds are shown in Table 3. The data from the CoMFA model are depicted graphically as a scatter plot in fig. 3A. Other parameters included a non-cross-validated coefficient r2 of 0.997 with an optimal component of 7, SEE of 0.053 and F value of 1232.712. Furthermore, the CoMFA model also has a high predictive correlation coefficient (r2 pred) of 0.887 for prediction of the test set, which indicated that the predictive ability of the CoMFA model is effective. The static field and electrostatic field descriptors account for 56.1 and 43.9 % of the variance, respectively.

Fig. 3: CoMFA and CoMSIA graphs of experimental and predicted pIC50 values
(●) Training set, ( ) test set
| Compounds | Experimental | CoMFA | CoMSIA | ||
|---|---|---|---|---|---|
| Pred. | Res | Pred. | Res | ||
| 1* | -1.5315 | -1.034 | -0.4975 | -0.78 | -0.7515 |
| 2 | -1.1139 | -1.125 | 0.0111 | -1.155 | 0.0411 |
| 3 | -1.699 | -1.693 | -0.006 | -1.79 | 0.091 |
| 4* | -2.9912 | -1.679 | -1.3122 | -1.006 | -1.9852 |
| 5 | -2.1461 | -2.152 | 0.0059 | -2.139 | -0.0071 |
| 6 | -1.7243 | -1.647 | -0.0773 | -1.657 | -0.0673 |
| 7 | -0.8573 | -0.865 | 0.0077 | -1.031 | 0.1737 |
| 8 | -1.8261 | -1.787 | -0.0391 | -1.736 | -0.0901 |
| 9 | -3.1139 | -3.079 | -0.0349 | -3.081 | -0.0329 |
| 10 | -1.1461 | -1.145 | -0.0011 | -1.287 | 0.1409 |
| 11 | -1.3979 | -1.417 | 0.0191 | -1.427 | 0.0291 |
| 12 | -2.6232 | -2.623 | -0.0002 | -2.547 | -0.0762 |
| 13* | -0.9138 | -1.138 | 0.2242 | -1.126 | 0.2122 |
| 14 | -0.8573 | -1.002 | 0.1447 | -0.807 | -0.0503 |
| 14 | -0.8573 | -1.002 | 0.1447 | -0.807 | -0.0503 |
| 15 | -0.8692 | -0.862 | -0.0072 | -0.896 | 0.0268 |
| 16 | -1.2304 | -1.108 | -0.1224 | -1.097 | -0.1334 |
| 17 | -1.716 | -1.712 | -0.004 | -1.629 | -0.087 |
| 18 | -0.959 | -0.994 | 0.035 | -1.008 | 0.049 |
| 19 | -1.0414 | -1.244 | 0.2026 | -1.369 | 0.3276 |
| 20 | -1.1139 | -1.029 | -0.0849 | -1.06 | -0.0539 |
| 21 | -1.3617 | -1.366 | 0.0043 | -1.396 | 0.0343 |
| 22* | -2.0414 | -1.685 | -0.3564 | -1.466 | -0.5754 |
| 23 | -0.9445 | -0.997 | 0.0525 | -1.057 | 0.1125 |
| 24 | -1.1761 | -1.21 | 0.0339 | -1.096 | -0.0801 |
| 25 | -3.3979 | -3.4 | 0.0021 | -3.395 | -0.0029 |
| 26 | -2.3979 | -2.339 | -0.0589 | -2.289 | -0.1089 |
| 27* | -1.5315 | -1.163 | -0.3685 | -0.999 | -0.5325 |
| 28 | -1.1139 | -1.115 | 0.0011 | -1.126 | 0.0121 |
| 29 | -1.3222 | -1.348 | 0.0258 | -1.261 | -0.0612 |
| 30 | -4 | -4.04 | 0.04 | -4.036 | 0.036 |
| 31 | -1.699 | -1.703 | 0.004 | -1.79 | 0.091 |
| 32 | -1.1139 | -1.12 | 0.0061 | -0.994 | -0.1199 |
| 33* | -1.3222 | -1.917 | 0.5948 | -1.809 | 0.4868 |
| 34 | -0.8573 | -0.87 | 0.0127 | -0.937 | 0.0797 |
| 35 | -1.3979 | -1.395 | -0.0029 | -1.446 | 0.0481 |
| 36 | -1.1139 | -1.127 | 0.0131 | -1.045 | -0.0689 |
| 37 | -1.716 | -1.724 | 0.008 | -1.668 | -0.048 |
| 38* | -1.7482 | -1.348 | -0.4002 | -1.504 | -0.2442 |
| 39 | -1.1139 | -1.065 | -0.0489 | -1.049 | -0.0649 |
| 40* | -1.7076 | -2.336 | 0.6284 | -2.473 | 0.7654 |
| 41* | -2.4771 | -2.336 | -0.1411 | -2.473 | -0.0041 |
| 42 | -1.1139 | -1.1 | -0.0139 | -1.04 | -0.0739 |
| 43 | -1.1461 | -1.116 | -0.0301 | -1.236 | 0.0899 |
| 44 | -1.6721 | -1.771 | 0.0989 | -1.821 | 0.1489 |
| 45 | -4 | -4.007 | 0.007 | -4.027 | 0.027 |
Table 3: Comparison of Experimental and Predicted Pic50 Of Compounds using Comfa Models
As shown in Table 2, The CoMSIA model possessed high non-cross-validated coefficient (r2= 0.991) and q2 (0.624). Moreover, the result showed that the CoMSIA model was a good model for predictive capability because of its predictive correlation coefficient (r2 pred) of 0.793 for prediction of the test set. The data from the CoMSIA model are depicted graphically as a scatter plot in fig. 3B.
To visualize the structure-activity relationship information content of the 3D-QSAR model, 3D CoMFA contour maps were generated to display favored and disfavored positions by plotting the coefficients from the CoMFA model. The CoMFA steric and electrostatic contour maps of 3D-QSAR analysis were shown in fig. 4 using compound 14 as a template molecule. As shown in fig. 4A, the CoMFA steric field included green and yellow regions. The green areas (80 % contribution) meant these regions were bulkily favorable and the yellow contours meant 20 % contribution for the disfavored region. The steric green contours surrounding the group R1 indicated that this region with a bulky group would improve the inhibitory activity. The methoxy group of R2 is near the yellow areas, which means adding a bulky substitution here would decrease the biological activity. This result can be used to explain compound 25 and 26, which has a hydrogen atom and benzoyl ring respectively as the group R1, exhibited lower activity. Furthermore, compound 9 has only one methyl group in R2 compared to compound 7, which exhibited a lower activity and conversely, compound 23 with a longer carbon chain at R1, but showed higher activity than compound 22. The electrostatic field contour maps of the CoMFA model are displayed in fig. 4B. The small-scale red contour was located in the methoxy group of R2, which indicated that adding electronegative groups here would increase inhibitory activity. Meanwhile, the whole molecule was surrounded by blue regions, especially the R1 group. The blue regions showed that electropositive groups around these areas would increase the inhibitory activity of substituted thienopyridine carbonitrile compounds. Therefore, pIC50 of compound 7 is higher than compound 8 and that of compound 31 is higher than compound 32. Compared to compounds 8 and 31, compounds 7 and 32 have one additional methoxy group in the R2 group. Compounds 16 and 17 have only one atom different, but compound 16 showed higher activity. The CoMSIA contour maps displayed that with compound 14 and the field contributions of the CoMSIA model of steric, electrostatic, hydrogen bond acceptor, hydrogen bond donor and hydrophobic were 27.6, 42, 2.5, 8.9 and 19.1 %, respectively (Table 2). Here, the 3D contour of hydrogen bond acceptor, hydrogen bond donor and hydrophobic were shown to make up for the deficiencies in the CoMFA model (fig. 5).

Fig. 4: CoMFA contour maps of compound 14 as reference

Fig. 5: CoMSIA contour maps of compound 14 as reference
Hydrophobic contour maps are displayed in fig. 5B, which yellow (with 80 % contribution) and azure (with 20 % contribution), respectively specify hydrophobic and hydrophilic groups. A large yellow contour is near the meta-position and ortho-position of the benzene ring in R1. Besides, part of the yellow region is located in the ortho and para position of the benzene ring in the R2 groups, which indicated that hydrophobic groups here can increase the activity. These findings confirmed that most of the compounds with a benzene ring, except compound 25, possessed better activity.
In figs. 5A and 5C, the hydrogen bond acceptor fields and the hydrogen bond donor fields were depicted. In hydrogen bond accepting counter maps, magenta (80 %) and red (20 %) contours indicated that hydrogen bond acceptor groups are favorable and unfavorable, respectively. All magenta contours and most of the red contours were located near the benzene ring of R1 and a small part of the red region located on the piperazine at the end of the R1 group. This could explain why the compounds exhibited higher activity when they have an N atom in the para position of the benzene ring in the R1 group and hydrogen bond donor in the terminal of the R1 group as in compounds 14 and 15. Hydrogen bond donor fields are displayed in cyan (80 %) and purple (20 %) contour in which the cyan region referred to the area where a hydrogen bond donating groups is favorable, while the purple region represented the area where a hydrogen bond donating groups is unfavorable. Interestingly, all the purple regions were located on the imino group in the skeleton near the R2 group. So the imino group in the skeleton could play a key positive effect on Src kinase inhibitory activity of those compounds.
To explore the mechanism of inhibitory activity of thienopyridine carbonitriles, compounds 7, 14, 15, 30 and 34 were used as predictors for intermolecular interactions between Src and thienopyridine carbonitriles by molecular docking. As shown in Table 4, all these compounds except compound 30 could be considered as specific ligands of Src with a docking scores of more than 5. It is worth noting that compound 30 has the lowest docking score, which explains why it has the lowest inhibitory activity. Moreover, a re-docking procedure with inhibitor AP23464, which was co-crystallized with Src in PDB structure 2BDJ was performed. The docking results showed that AP23464 has the highest docking score of 12.0469 (Table 4). To better present the docking mode, 3 types of binding modes (line, electrostatic potential and lipophilic potential, respectively) visualized by MOLCAD surfaces have been shown in figs. 6 and 7. The line model showed that these 4 compounds formed stable hydrogen bonds with the binding pocket of Src (fig. 6). The Src inhibitor AP13464 formed 4 hydrogen bonds with Met341, Asp404 and Glu310. Compounds 14 and 34 formed one hydrogen bond with Lys295 and Thr338 of Src, respectively. Besides, compound 7 and 15 formed 3 hydrogen bonds with Src, which formed similar hydrogen bonds by interacting with Thr338 and Ser345 of Src and the others by interacting with Asp348 and Leu273, respectively. While there is no hydrogen bond formed between compound 30 and Src, which explained why compound 30 exhibited very low inhibitory activity. According to fig. 7, the electrostatic potential and lipophilic potential models demonstrated that all these compounds penetrated into the active pocket of Src (fig. 7). There was a large lipophilic domain in the active pocket where the benzene ring of the R1 group and the common skeleton interacted with each other and the hydrophilic R2 group was repelled into the hydrophilic domain inside the pocket. These results display the binding mode of the docked Src kinase and thienopyridine carbonitriles complexes to indicate why these compounds 7, 14, 15, 34 and AP23464 exhibited high inhibitory activity. However, the low inhibitory activity of compound 30 combined with other compounds in a different binding mode indicated that these compounds did not interact with the large lipophilic domain at the edge of the active pocket.

Fig. 6: The predicted line binding modes of compounds 7, 14, 15, 30, 34 and AP23464 to Src

Fig. 7: Docking conformation of compounds 7, 14, 15, 30, 34 and AP23464 and MOLCAD surface of Src at the binding site
CoMFA[14] and CoMSIA[15] are general methods in 3D-QSAR. Stable CoMFA and CoMSIA models for 3D-QSAR analysis were obtained with a good predictive capacity for thienopyridine carbonitriles Src inhibitors in the present studies. The models can provide quantitative estimations of inhibitory activity of thienopyridine carbonitriles on Src. In the CoMFA model, the addition of a bulky group or the electropositive group to the R1 group can enhance the inhibitory activity of the compound. In addition, reducing the bulky group or increasing the electronegative group on the R2 group can also increase the inhibitory activity of the compound (fig. 4A). The effect of methoxy as an electronegative group on the activity was greater than the effect of its steric hindrance. However, after comparing the structure and activity of compounds 7, 8 and 9, it was found that the activity of a compound is reduced when a methyl group was added to the methoxy group, indicating that effect of steric hindrance of thienopyridine carbonitriles might have a higher priority than the effect of electrostatic field in the inhibitory activity on Src. That could explain the differences in the inhibitory activity among compounds 2, 3 and 4 as well. Therefore, both steric and electrostatic factors play key roles in the inhibitory activity of thienopyridine carbonitriles on Src. According to the 3D Contour maps of the CoMSIA model, the hydrophilic and hydrogen bond acceptor groups at the R1 group are advantageous for the activity of these compounds (fig. 5A-B). However, hydrogen bond donating groups, which are located at the R2 group might increase the activity of the compounds (fig. 5C). In fact, hydrogen bond donor groups are not exclusively located on the R2 group and are also located on the imino group of the skeleton, which is contained by each thienopyridine carbonitrile compound. Therefore, the imino group in the skeleton could play a key positive effect on Src kinase inhibitory activity of those compounds.
Molecular docking of compounds 7, 14, 15, 30 and 34 were figured out for a better understanding of the interaction with Src (fig. 6). Here, AP23464, a known inhibitor of Src kinase, which has a 2,6,9-trisubstituted purine targeted the ATP-binding site of Src[21], was used as a reference molecule. AP23464 could protrude deeply into the active site, which made abundant polar and hydrophobic interaction with Src residues (fig. 7). This interaction is similar to that of compounds 7, 14, 15 and 34 but 30 appeared to be different, as can be seen from the docking results. The formation of driving hydrogen bonds between these compounds and Src also made their binding more stable. Docking studies have indicated that compounds with high inhibitory activity could bind well with the substrate site of Src and the binding feature of these compounds was similar to that of the reference inhibitor. The inhibitory activity of compounds 7, 14, 15, 30 and 34 on Src was adequately supported by molecular docking calculations. These compounds would be of great value as lead compounds for exploiting new Src inhibitors.
In conclusion, the CoMFA QSAR model (Table 2), which had good internal availability with a q2 value of 0.739 and high predictive ability with r2 pred of 0.887, demonstrated that steric and electronic properties were significant factors for inhibitory activity of thienopyridine carbonitriles on Src. Furthermore, the CoMSIA QSAR model (Table 2) with a q2 value of 0.624 and high predictive ability with r2 pred of 0.793 has been generated to explain that hydrogen bond acceptor, hydrogen bond donor and hydrophobic properties play a very crucial role on the inhibitory activity as well. Those models (fig. 3) could supply the tools for predicting the inhibitory activity of thienopyridine carbonitrile compounds. Molecular docking analysis showed that these compounds with high inhibitory activity were able to bind well in the ATP-binding region of Src. The results of the present study could be of great value in designing novel substituted thienopyridine carbonitriles with more potent Src kinase inhibitory activity.
Acknowledgements
This work was supported by the National Natural Science Foundation of China (81673670), Guangdong Special Support Plan for High-level Talents (2016TQ03R849), the Science and Technology Program of Guangzhou (201610010108) and Jinan Double Hundred Talents Plan.
Conflicts of interest
The authors declare that there are no conflicts of interest.
References
- Yeatman TJ. A renaissance for SRC. Nat Rev Cancer 2004;4(6):470-80.
- Thomas SM, Brugge JS. Cellular functions regulated by Src family kinases. Annu Rev Cell Dev Biol 1997;13:513-609.
- Ho CP, Wen ML, Camuso A, Castenada S, Fager K, Flefleh C, et al. Targeted overexpression of activated human c-SRC in transgenic mice results in mammary tumors that are highly sensitive to the novel, oral, multi-targeted kinase inhibitor dasatinib (BMS-354825). Clin Cancer Res 2005;11(24):9135S-36S.
- Puls LN, Eadens M, Messersmith W. Current status of SRC inhibitors in solid tumor malignancies. Oncologist 2011;16(5):566-78.
- Recchia I, Rucci N, Migliaccio S, MacKay AR, Festuccia C, Bologna M, et al. Pyrrolopyrimidine class Src inhibitors inhibit osteoclast and bone metastatic tumor cell functions. J Bone Miner Res 2001;16:S270.
- Soriano P, Montgomery C, Geske R, Bradley A. Targeted disruption of the c-src proto-oncogene leads to osteopetrosis in mice. Cell 1991;64(4):693-702.
- Boyce BF, Xing L, Yao Z, Yamashita T, Shakespeare WC, Wang Y, et al. SRC inhibitors in metastatic bone disease. Clin Cancer Res 2006;12(20 Pt 2):6291s-5s.
- Kumar A, Ahmad I, Chhikara BS, Tiwari R, Mandal D, Parang K. Synthesis of 3-phenylpyrazolopyrimidine-1,2,3-triazole conjugates and evaluation of their Src kinase inhibitory and anticancer activities. Bioorg Med Chem Lett 2011;21(5):1342-6.
- Recchia I, Rucci N, Festuccia C, Bologna M, MacKay AR, Migliaccio S, et al. Pyrrolopyrimidine c-Src inhibitors reduce growth, adhesion, motility and invasion of prostate cancer cells in vitro. Eur J Cancer 2003; 39(13):1927-35.
- Vu CB, Luke GP, Kawahata N, Shakespeare WC, Wang Y, Sundaramoorthi R, et al. Bone-targeted pyrido[2,3-d]pyrimidin-7-ones: potent inhibitors of Src tyrosine kinase as novel antiresorptive agents. Bioorg Med Chem Lett 2003;13(18):3071-4.
- Boschelli DH, Wang D, Wang Y, Wu B, Honores EE, Barrios Sosa AC, et al. Optimization of 7-alkene-3-quinolinecarbonitriles as Src kinase inhibitors. Bioorg Med Chem Lett 2010; 20(9):2924-7.
- Ple PA, Green TP, Hennequin LF, Curwen J, Fennell M, Allen J, et al. Discovery of a new class of anilinoquinazoline inhibitors with high affinity and specificity for the tyrosine kinase domain of c-Src. J Med Chem 2004;47(4):871-87.
- Guan HP, Liang CX, Tang C, Laird D. Tetrahydroindole based indolinones with a substituted aminopropyl side chain as potent SRC inhibitors. Abstr Pap Am Chem Soc 2003;225:U185-6.
- Cramer RD, Patterson DE, Bunce JD. Comparative molecular field analysis (CoMFA). 1. Effect of shape on binding of steroids to carrier proteins. J Am Chem Soc 1988; 110(18):5959-67.
- Klebe G, Abraham U, Mietzner T. Molecular similarity indices in a comparative analysis (CoMSIA) of drug molecules to correlate and predict their biological activity. J Med Chem 1994;37(24):4130-46.
- Fang DQ, Wu WJ, Zhang R, Zeng GH, Zheng KC. Theoretical studies of QSAR and molecular design on a novel series of ethynyl-3-quinolinecarbonitriles as SRC inhibitors. Chem Biol Drug Des 2012;80(1):134-47.
- Anwer Z, Gupta SP. A QSAR Study on a Series of Indolin-2-Ones Acting as Non-Receptor Src Tyrosine Kinase Inhibitors. Lett Drug Des Discov 2011;8(10):918-25.
- Boschelli DH, Wu B, Barrios Sosa AC, Durutlic H, Chen JJ, Wang Y, et al. Synthesis and Src kinase inhibitory activity of 2-phenyl- and 2-thienyl-7-phenylaminothieno[3,2-b]pyridine- 6-carbonitriles. J Med Chem 2005;48(11):3891-902.
- Boschelli DH, Wu B, Barrios Sosa AC, Durutlic H, Ye F, Raifeld Y, et al. Identification of 7-phenylaminothieno-[3,2-b]pyridine-6-carbonitriles as a new class of Src kinase inhibitors. J Med Chem 2004;47(27):6666-8.
- Boschelli DH, Wu B, Barrios Sosa AC, Chen JJ, Golas JM, Boschelli F. Inhibition of Src kinase activity by 7-[(2,4-dichloro-5-methoxyphenyl)amino]-2-heteroaryl-thieno[3,2-b]pyridine-6-carb onitriles. Bioorg Med Chem Lett 2005;15(21):4681-4.
- Dalgarno D, Stehle T, Narula S, Schelling P, van Schravendijk MR, Adams S, et al. Structural basis of Src tyrosine kinase inhibition with a new class of potent and selective trisubstituted purine-based compounds. Chem Biol Drug Des 2006;67(1):46-57.