- *Corresponding Author:
- B. K. Satheeshababu
Department of Pharmaceutics, Government College of Pharmacy, #2 P Kalinga Rao Road, Bangalore‑560 027, India
E‑mail: bksatishbabu@gmail.com
| Date of Submission | 10 November 2011 |
| Date of Revision | 14 February 2013 |
| Date of Acceptance | 18 February 2013 |
| Indian J Pharm Sci 2013;75(2):162-170 |
Abstract
The aim of this study was to synthesis the conjugated chitosan by covalent attachment of thiol moieties to the cationic polymer, mediated by a carbodiimide to improve permeation properties of chitosan. Thioglycolic acid was covalently attached to chitosan by the formation of amide bonds between the primary amino groups of the polymer and the carboxylic acid groups of thioglycolic acid. Hence, these polymers are called as thiomers or thiolated polymers. Conjugation of chitosan was confirmed by Fourier transform-infrared and differential scanning calorimetric analysis. Matrix type transdermal patches of carvedilol were prepared using the different proportions of chitosan and chitosan-thioglycolic acid conjugates (2:0, 1.7:0.3, 1.4:0.6, 1:1, 0.6:1.4 and 0.3:1.7) by solvent casting technique. Prepared matrix type patches were evaluated for their physicochemical characterization followed by in vitro evaluation. Selected formulations were subjected for their ex vivo studies on Wistar albino rat skin and human cadaver skin using the modified Franz diffusion cell. As the proportion of conjugated chitosan increased, the transdermal patches showed increased drug permeation. The mechanism of drug release was found to be nonFickian profiles. The present study concludes that the transdermal patches of carvedilol using conjugated chitosan with different proportions of chitosan were successfully developed to provide improved drug permeation. The transdermal patches can be a good approach to improve drug bioavailability by bypassing the extensive hepatic first-pass metabolism of the drug.
Keywords
Carvedilol, chitosan‑thioglycolic acid conjugates, matrix monolithic system, transdermal drug delivery system
Chitosan molecule is a copolymer of N‑acetyl‑D-glucosamine and D‑glucosamine, which are constituents of normal mammalian tissue; thus provides biocompatibility. In recent years, chitosan has gained increasing interest in the pharmaceutical field due to its favorable biological properties such as biodegradability and the lack of toxicity, together with its wide availability in nature and low cost. In addition, it offers the advantage of easy chemical modifications on account of the primary amino group at the 2‑position of each polymer subunit. In order to attach a simple sulfhydryl compound covalently to these primary amino groups of the polymer via the formation of amide bonds, we selected thioglycolic acid (TGA) [1,2].
Carvedilol is a novel, multiple‑action cardiovascular drug that is currently approved in many countries for the treatment of hypertension. The reduction in blood pressure produced by carvedilol results primarily from β‑adrenoceptor blockade and vasodilation, the latter resulting from α1‑adrenoceptor blockade [3,4].
Carvedilol was chosen as the model candidate for this study. Since, it possesses near ideal characteristics that a drug must have in formulating a transdermal drug delivery system: Low molecular mass, high lipid solubility, effective in low plasma concentration as well as a high degree of first‑pass metabolism [5].
The objective of the present research work was to improve permeation properties of chitosan by conjugating it with TGA and to formulate matrix type transdermal patches with different proportions of conjugated chitosan and chitosan using the carvedilol as a model drug.
Materials and Methods
Carvedilol was received as a gift sample from Dr. Reddy’s Laboratories Limited, Hyderabad, India. Chitosan was purchased from Sigma‑Aldrich Chemicals, St. Louis, USA., thiogycolic acid and carbodiimide hydrochloride were purchased from Spectrochem Pvt. Ltd., Mumbai, India. All the other chemicals were of analytical grade.
Synthesis of chitosan‑TGA conjugates
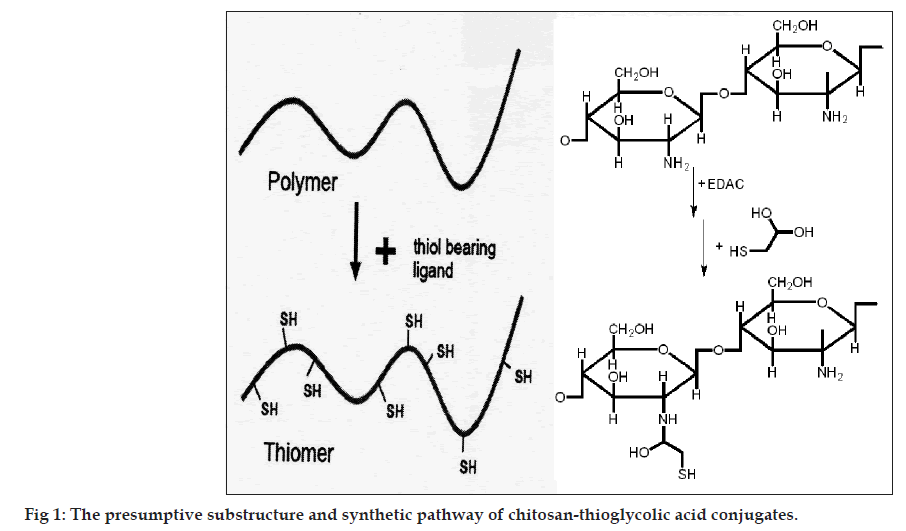
Covalent attachment of TGA to chitosan was achieved by the formation of amide bonds between the primary amino groups of the polymer and the carboxylic acid group of TGA. First, 500 mg of chitosan was hydrated in 4 ml of 1 M HCl and dissolved by the addition of demineralized water in order to obtain a 1% w/v solution of chitosan hydrochloride. Thereafter, 1‑ethyl‑3‑(3‑dimethylaminopropyl) carbodiimide hydrochloride (EDAC) was added in a final concentration of 50 mM in order to activate the carboxylic acid moieties of the subsequently added TGA. After EDAC was completely dissolved in the chitosan hydrochloride solution, 500 mg of TGA was added. The pH was adjusted to 9.0 using 1 M NaOH. The reaction mixture was incubated for 3 h at room temperature under permanent stirring. In order to eliminate unbound TGA and to isolate the pure polymer conjugates, the reaction mixtures were dialyzed in tubing’s prepared from dialysis membrane‑110 for 3 days at 10° in the dark against 5 mM HCl, then two times against the same medium but containing 1% NaCl to reduce ionic interactions between cationic polymer and the anionic sulfhydryl compound [6]. Thereafter, sample was dried in desiccator under vacuum. The dried conjugated chitosan was stored in desiccator until further use. The presumptive substructure and synthetic pathway of chitosan‑TGA conjugates is shown in fig. 1.
Characterisation of synthesised conjugates
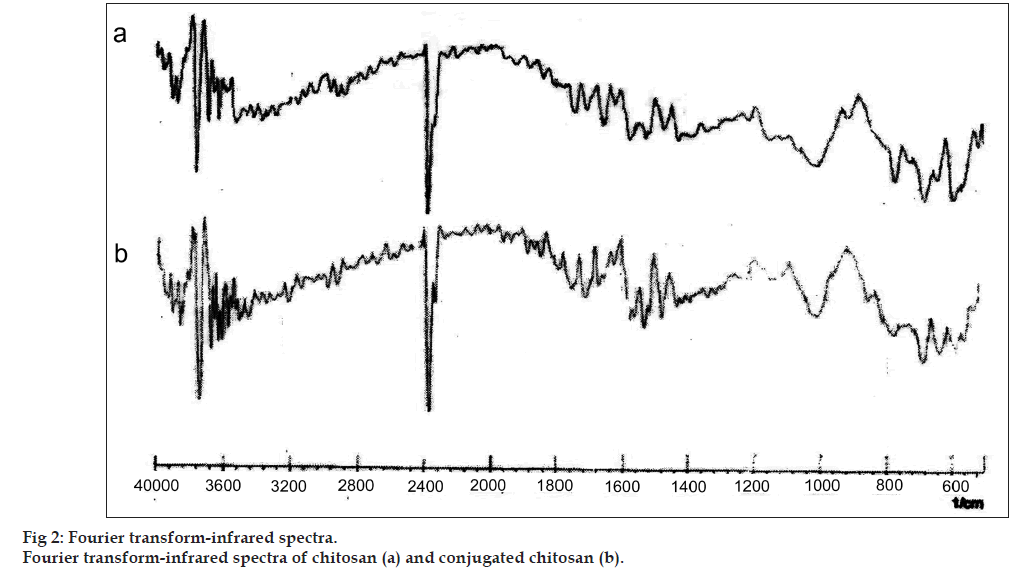
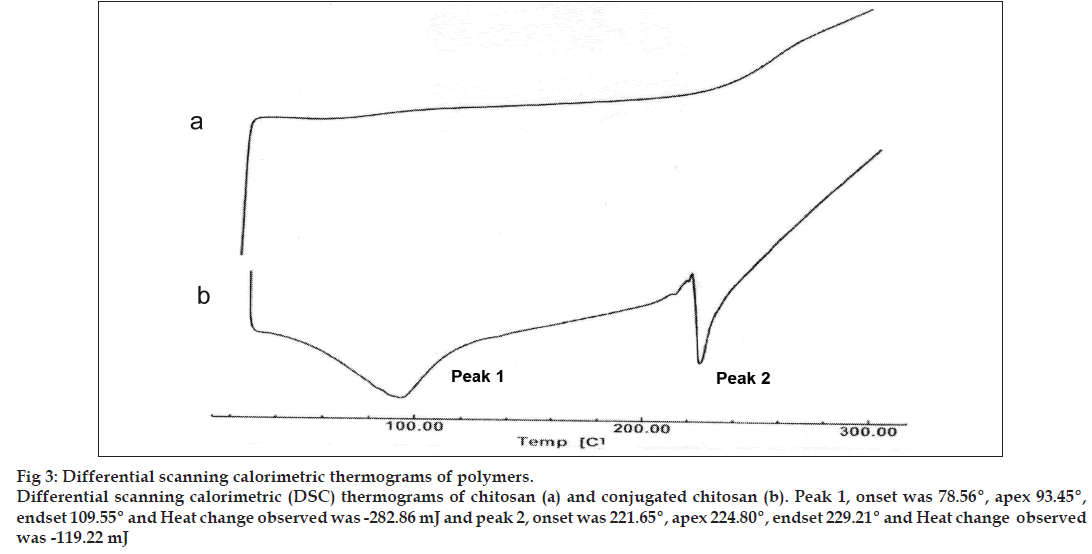
The conjugation of chitosan with TGA was primarily confirmed by determining charring point of the polymers. Further, confirmed by Fourier transform‑infrared (FT‑IR) and differential scanning calorimetric (DSC) analysis. The charring point of the chitosan and conjugated chitosan was determined by taking approximately 5 mg of the sample in a glass capillary tube sealed at one end. The sample‑containing capillary tube was placed in melting point apparatus and the temperature was increased gradually. The temperature at which sample charred completely was noted down as the charring point of that sample in degree. The samples of chitosan and conjugated chitosan were prepared in the form of KBr pellets and subjected for scanning from 4000/cm to 400/cm using FT‑IR spectrophotometer (FT‑IR‑8400, Shimadzu, Japan). For DSC studies, approximately, 2 mg of chitosan and conjugated chitosan sample was taken in an aluminum pan, sealed with aluminum cap and kept under nitrogen purging (atmosphere). Both the samples were scanned from 0° to 300° with the scanning rate of 10° rise/min using differential scanning calorimeter (DSC‑60, Shimadzu, Japan).
Drug‑polymers compatibility study
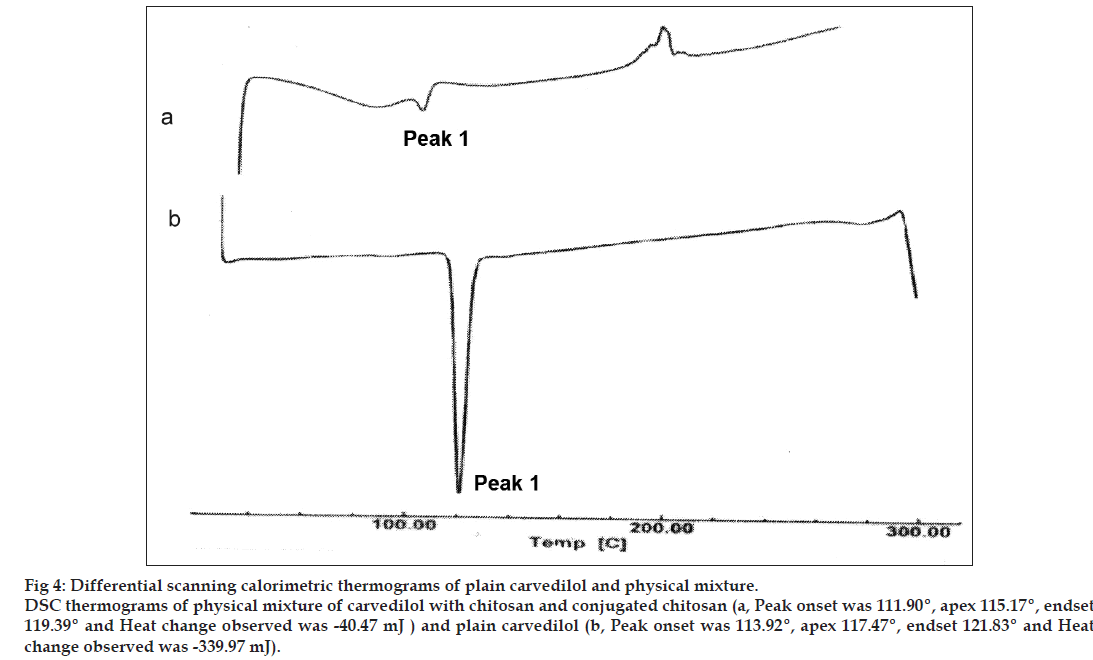
The compatibility of drug with polymers was determined by subjecting the drug, polymers and physical mixture of drug and polymers (1:1) for DSC. The studies were performed as per the procedure given above.
Preparation of plain and conjugated chitosan patches
Polymeric solution (2% w/v) was prepared by dissolving chitosan and conjugated chitosan using 2% acetic acid. The proportions of chitosan and conjugated chitosan were maintained as shown in Table 1. Glycerine (10% w/w) was added as plasticizer and the drug carvedilol (10% w/w) was added into the 35 ml solution and homogenised. The patches were casted on circular glass mould and allowed to dry over a level surface [7]. The patches were cut with a circular metallic die of 1 cm internal diameter to give an area of 0.785 cm2 and stored in an airtight desiccator under ambient conditions prior to use.
| Formulation code | Conjugated chitosan (mg) | Chitosan (mg) | Drug (mg) | Glycerine (mg) |
|---|---|---|---|---|
| S0 | ‑ | 700 | 70 | 70 |
| S1 | 105 | 595 | 70 | 70 |
| S2 | 210 | 490 | 70 | 70 |
| S3 | 350 | 350 | 70 | 70 |
| S4 | 490 | 210 | 70 | 70 |
| S5 | 595 | 105 | 70 | 70 |
Table 1: Formulation of Plain and Conjugated Chitosan Patches.
Thickness and folding endurance
Thickness of all the patches was measured using dial thickness apparatus (Mitutoyo 2046F, Japan) at five different points on each patch and average of five readings was taken. A modified United States Pharmacopoeia (USP) tablet disintegrating tester was used to determine the folding endurance of the patches. It consisted of fixed and movable jaws that could be moved up and down at the rate of 30 strokes/min. The distance between the two jaws at their farthest and closest was 6 and 5 cm, respectively. The patches (6 cm length) were clamped between the jaws in such a way that the jaws were at their closest, the patches beat across its middle and when at their farthest, the patch was in a stretched condition. Thus for every stroke of the movable jaw the patch went through one cycle of bending and stretching. The folding endurance is expressed as the number of strokes required to either break or develop visible cracks on the patches. The test was conducted for 20 min equating 600 strokes.
Swelling index
The polymeric patches cut into 0.785 cm2 were weighed accurately and allowed to swell on a plate containing 2% w/v of agar. Individual patches were weighed periodically until they showed a constant weight [8]. The swelling index (SI) of each patch was calculated using the following equation: Percentage of SI=(W2–W1)/W1×100.
Percentage of moisture content
The patches of size 0.785 cm2 were weighed individually and stored in desiccator consists of fused calcium chloride at room temperature for 24 h. Individual patches were weighed repeatedly until they showed a constant weight. The percentage of moisture content was calculated as the difference between initial and final weight with respect to final weight. Percentage t moisture content=(initial weight–final weight)/final weight×100.
Percentage of moisture uptake
A weighed patch of size 0.785 cm2 stored in a desiccator at room temperature for 24 h was taken out and exposed to 84% relative humidity (a saturated solution of potassium chloride) in a desiccator until a constant weight for the patches was obtained. The percentage of moisture uptake was calculated as the difference between final and initial weight with respect to initial weight [9].
Water vapor transmission study
The patches 3.142 cm2 was fixed over the brim of a glass vial, consists of 2 g of fused calcium chloride as desiccant. The vial was weighed and kept in desiccator contain saturated solution of potassium chloride to provide 84% relative humidity. The vial was taken out and weighed at every 24 h intervals for a period of 7 days. The flux, i.e., the amount of water vapor transmitted through 1 cm2/24 h and permeability coefficient were calculated using the formula P=(slope/Vp(Kcl))×24, where P is permeability coefficient and Vp(Kcl) is the vapor pressure of saturated solution of potassium chloride.
Tinius Olsen Benchtop Tester, England, UK. The upper one is movable and lower one was fixed. The patches of specific size (4 cm×1 cm) was fixed between these grips and upper jaw was moved at a speed of 100 mm/min applying force gradually until the patches break. The tensile strength of the patches was taken directly from the dialed reading in kilogram and extension of patch in millimeter.
Gel strength
Gel strength of the chitosan and conjugated chitosan was determined using locally fabricated instrument, having free moving piston with pointed conical tip (tip length ‑ 10 mm; tip angle ‑ 60°) along with the provision to apply the load over the piston. The 10% w/v gels of both the polymers were prepared individually using 4% v/v hydrochloric acid as a solvent. The homogenized gel was filled in sample holder and stored below 10° in a refrigerator for 24 h. The gel strength of the polymer was determined by placing the piston tip over gel surface and the load was applied over the piston at a constant rate by adding the water using i.v. infusion set at a constant flow rate (100 ml/min). The load required to pierce the piston tip up to 4 mm in the gel was taken as the gel strength of that polymer. The temperature of the gel was maintained below 10° throughout the study.
In vitro skin permeation study
The in vitro skin permeation experiments were conducted in a modified Franz diffusion cell (receptor compartment capacity: 16 ml; surface area: 1.5 cm2). The diffusion cell consists of two compartments; the upper compartment, i.e., the donor compartment, which contains the transdermal system, will be in contact with the dialysis membrane. The bottom part contains the receptor solution, the water jacket for temperature control and the sampling port. The permeation study was carried out across the dialysis membrane‑110. The receiver compartment was filled with 16 ml of ethanol:phosphate buffer pH 7.4 (1:1). The donor compartment was then placed in position such that the surface of the patch just touches the receptor fluid surface. The whole assembly was placed on a magnetic stirrer and the solution in the receptor compartment was constantly and continuously stirred at 50 rpm; the temperature of whole assembly was maintained at 37±0.5° by circulating hot water inside the water jacket. The samples were withdrawn at different time intervals up to 24 h and replenished with an equal volume of ethanol:buffer solution at each time interval. The absorbance of withdrawn samples was measured at 243 nm using U.V spectrophotometer [10,11].
Ex vivo permeation studies (using rat skin)
Ex vivo skin permeation studies were performed (Institutional Animal Ethics Committee, National College of Pharmacy, Shimoga, IAEC/CLEAR/P. COL/21/02/2009‑10) by using a modified Franz diffusion cell with a receptor compartment of 16 ml capacity. The Wistar Albino rat’s skin containing epidermis and stratum corneum excised from the dorsal surface was mounted between the donor and receptor compartment of the diffusion cell. Further processing was carried out as described above. The cumulative amounts of drug permeated per square centimeter of patches were plotted against time.
Ex vivo permeation studies (using human cadaver skin)
The fresh full thickness skin (75‑80 μm) human cadaver skin (from abdominal region) of male of age group about 45 years was obtained from the postmortem Department of Forensic Medicine, McGann District Hospital, Shimoga. The skin was immersed in water at 60° for a period of 5 min. The epidermis was peeled from the dermis after exposure. The isolated (25±5 μm) was rapidly rinsed with hexane to remove surface lipids and rinsed with water and then either used and stored frozen (for not more than 48 h) wrapped in aluminum foil. The transdermal device was placed over the skin. Further processing was carried out as described above. The cumulative amounts of drug permeated per square centimeter of patches were plotted against time [12].
Stability studies
Stability of a pharmaceutical product may be defined as the capability of a particular formulation, in a specific container, to remain within its physical, chemical, therapeutic, and toxicological specifications throughout its shelf life. As per International Conference on Harmonisation (ICH) guidelines the length of study and storage conditions are for long term testing 25±2°/75±5% RH for 12 months and for accelerated testing 40±2°/75±5% RH for 6 months. The optimized formulation was subjected for 2 month stability study according to ICH guidelines. The selected formulations were packed in aluminum foils, which were in wide mouth bottles closed tightly. They were then stored at 40°/75% RH for 2 months and evaluated for their permeation study.
Results and Discussion
The charring point of chitosan and conjugated chitosan were found to be 255° and 185°, respectively. The significant differences in charring point of chitosan and conjugated chitosan have suggested that there might be the conjugation of chitosan with TGA. The FT‑IR spectra have shown bands represented S‑H stretching (at 2685.00/cm) and additional bands at 1527.67/cm for ‑ C=O stretching of amide bond, thus confirming the conjugation of chitosan with TGA through the amide linkage only (fig. 2). The DSC thermogram of conjugated chitosan, have shown one extraendothermic peak at 224.80° represented the thiol moiety, which was absent in the DSC thermogram of chitosan. This has further confirmed the conjugation of chitosan with TGA (fig. 3).
The DSC analysis of carvedilol alone showed a sharp endothermic peak at 117.47° corresponding to its melting point, indicating the drug sample was pure. The DSC analysis of carvedilol with chitosan and conjugated chitosan demonstrated negligible change in the melting point of carvedilol (115.17°), which indicated that the polymer do not interact with the drug (fig. 4).
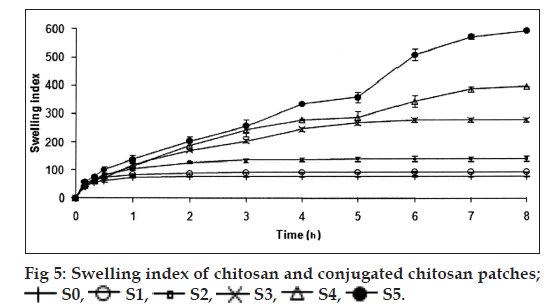
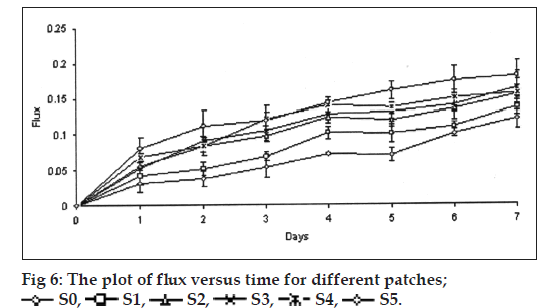
The thickness and folding endurance for the patches of each formulation are shown in Table 2. Results indicated that the patches would not break and would maintain their integrity with general skin folding when applied. The swelling profile of the patches is shown in Table 2 and fig. 5. It is found that the SI of S0 (77.24±3.38) is lowest when compared to S1 (92.83±1.31), S2 (138.87±8.89), S3 (278.51±5.17), S4 (396.00±0.09) and SI of S5 (592.85±0.05) was found to be highest when compared to others. Chitosan has a rigid structure and can allow little amount of water molecules to penetrate the matrix, but in case of conjugated chitosan due to presence of thiol group in place of primary amino group of chitosan the polymer chain gets opened and forms a loose matrix which allows more number of water molecules to penetrate. Hence, the SI of patches was found to be increased with increase in concentration of conjugated chitosan. The results of moisture content and moisture uptake study are shown in Table 2. Moisture content of patches S3 (45.61±0.26), S4 (46.68±0.68) was increased when compared to S1 (16.3±0.50). The moisture uptake of patches S0 (15.62±0.52), S3 (18.83±0.49) was decreased when compared to S4 (24.70±0.54) and S5 (27.70±0.62) respectively. Moisture content and moisture uptake studies indicated that increase in ratio of conjugated chitosan resulted in increased moisture content and moisture uptake of the patches. This is due to replacement of primary amino group by thiol group in conjugated chitosan, which opens the polymeric network and allows to absorb more amount of moisture, as a result of this the swelling of polymer was also found to be increased. Water vapour transmission studies indicated that all the patches prepared were permeable to water vapor. The results are shown in Table 2 and fig. 6. The value of permeation coefficient was lowest in S0 (0.078±0.013) and highest in S5 (0.0113±0.019). This is due to presence of higher concentration of conjugated chitosan in S5. The rate of WVT in different patches was found to be decreased in following order S5>S4>S3>S2>S1>S0. The tensile strength (0.7199±0.018) and extension (2.103±0.651) of patches S0 was found to be highest, whereas tensile strength (0.2061±0.023) and extension (0.252±0.531) of patches S5 was lowest as shown in Table 2. Due to presence of thiol group in place of primary amino group it creates opening in the polymer chains, as a result the extension of the patches decreased with increasing proportion of conjugated chitosan and also the tensile strength decreased with increase in proportion of conjugated chitosan. The results reveal that the patches have reasonable tensile strength and moderate extension capability. Gel strength of the chitosan was found to be 238.73±2.88 g, whereas the conjugated chitosan showed gel strength of 10.22±0.01 g. A significant change in the gel strength of chitosan was observed after the conjugation with TGA. This might be due to opening of the polymer chains after conjugation, which resulted in the formation of a very soft gel as it retained more amount of moisture. Whereas, chitosan formed a hard gel as the amount of moisture retained was less due to the rigidity of the matrix. The reduction in the gel strength of chitosan after the conjugation has further supported the results of SI, moisture uptake and in vitro drug permeation of the patches contained different proportion of conjugated chitosan.
| Code | Thickness(µm)* ± SD | Folding endurance* | Swelling index* ± SD | Percentage of moisture content* ± SD | Percentage of moisture uptake* ± SD | Water vapor transmission* ± SD | Tensile strength (kg/cm2)* ± SD | Extension* (cm) SD |
|---|---|---|---|---|---|---|---|---|
| S0 | 20.7 ± 0.02 | No visible cracks | 77.2 ± 3.4 | 28 ± 0.7 | 15.6 ± 0.5 | 0.008 ± 0.013 | 0.72 ± 0.02 | 2.1 ± 0.651 |
| S1 | 20.8 ± 0.05 | No visible cracks | 92.8 ± 1.3 | 6.4 ± 0.5 | 24 ± 0.6 | 0.0085 ± 0.012 | 0.71 ± 0.03 | 1.38 ± 0.055 |
| S2 | 21 ± 0.05 | No visible cracks | 138.9 ± 8.9 | 35 ± 0.6 | 23.9 ± 0.6 | 0.0095 ± 0.005 | 0.65 ± 0.014 | 0.9 ± 0.023 |
| S3 | 20 ± 0.02 | No visible cracks | 278.5 ± 5.2 | 45.6 ± 0.3 | 18.8 ± 0.5 | 0.0102 ± 0.007 | 0.61 ± 0.054 | 0.55 ± 0.035 |
| S4 | 21.3 ± 0.01 | No visible cracks | 396 ± 0.1 | 46.7 ± 0.7 | 24.7 ± 0.5 | 0.01 ± 0.011 | 0.59 ± 0.035 | 0.4 ± 0.1 |
| S5 | 21.5 ± 0.04 | No visible cracks | 593 ± 0.05 | 44.6 ± 0.6 | 27.7 ± 0.6 | 0.0113 ± 0.019 | 0.21 ± 0.023 | 0.26 ± 0.531 |
SD=Standard deviation, *Mean (n=3)
Table 2: Characterisation of Transdermal Patches
The transdermal patches were also evaluated for in vitro drug permeation and their cumulative percent drug permeated was calculated. The patches containing only chitosan (S0) have shown 33.14±1.61% drug permeation in 24 h whereas the patches containing higher proportion of conjugated chitosan (S5) have shown 101.10±4.38% drug permeation in 24 h. The patches contained conjugated chitosan to chitosan in ratios of 0.3:1.7 (S1), 0.6:1.4 (S2), 1:1 (S3) and 1.4:0.6 (S4) have shown 67.72±2.86%, 81.33±6.48%, 85.4±1.91% and 97.72±5.24% drug permeation in 24 h, respectively.
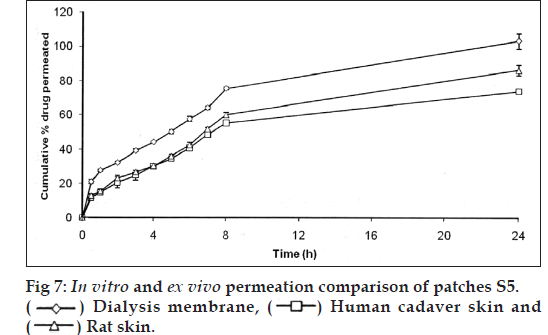
In vitro drug permeation was found to be more for the patches contained conjugated chitosan in different proportions with chitosan (S1‑S5) than the patches contained only chitosan (S0). This might be due to the conjugation, which introduced thiol groups in the chitosan, which were able to take up more amount of moisture at a faster rate and thus, allowed the polymer matrix to swell at a faster rate. The conjugation also causes opening of the polymer chains, which will not resist the drug diffusion and consequently, give rise to more rapid release of drug. This would be the reason for the amount of drug permeated with increased proportion of conjugated chitosan in the patches. The patches contained conjugated chitosan and chitosan in proportion of 0.3:1.7 (S5) was selected for ex vivo drug permeation studies. It showed 86.21±3.19% and 73.77±1.48% drug permeation through the rat skin and human cadaver skin respectively in 24 h. The comparison of in vitro and ex vivo drug permeation profile is shown in fig. 7.
The drug permeation data were analyzed for the rate and mechanism of drug permeation using zero order, first order, Higuchi and Korsmeyer‑Peppas models shown in Table 3. The in vitro drug permeation of the all formulation followed first order kinetics and the mechanism of drug permeation was found to be anomalous (nonFickian) diffusion in S0, S1, S2, S4, S5 patches and S3 patch follows anomalous (nonFickian) case 2 profiles. The ex vivo drug permeation of S5 followed first order kinetics and the mechanism of drug permeation was found to be anomalous (nonFickian) diffusion in case of both rat skin and human cadaver skin. The comparative in vitro and ex vivo drug permeation profile suggested the similar drug release pattern from this formulation.
| Formulation code | Zero order plot (R2) | First order plot (R2) | Higuchi’s plot (R2) | Korsmeyer‑ peppas’s plot (n) |
|---|---|---|---|---|
| S0 | 0.5649 | 0.5895 | 0.8299 | 0.698 |
| S1 | 0.7327 | 0.8512 | 0.9309 | 0.6451 |
| S2 | 0.7488 | 0.9318 | 0.9587 | 1 |
| S3 | 0.7863 | 0.9692 | 0.9729 | 0.4755 |
| S4 | 0.8001 | 0.9929 | 0.9764 | 0.4571 |
| S5* | 0.8486 | 0.9826 | 0.9714 | 0.533 |
| S5# | 0.796 | 0.9312 | 0.9514 | 0.533 |
*Excised rat skin, #Human cadaver skin
Table 3: Drug Permeation Kinetic Parameters of Permeation Studies Through Dialysis Membrane
The patches S5 was subjected to accelerated stability studies for 60 days at 40°/75% RH, in vitro permeation study was performed after 0, 30 and 60 days. Cumulative percentage of drug permeation was found to be 101.10±4.38, 98.18±1.26 and 96.41±2.46 after 0, 30 and 60 days, respectively. Results indicate that there is negligible change in permeation profile even after 2 months. The patches subjected for stability studies were found to be smooth and flexible and no change in the physical appearance of the patches.
The conjugation of the chitosan with TGA was primarily confirmed on the basis of charring point of the chitosan and conjugated chitosan, which was further confirmed by FT‑IR and DSC studies. The drug and polymers were subjected for the compatibility study using DSC, which suggested that there was no significant interaction between the drug and polymers. The various formulations of matrix type transdermal patches of carvedilol were prepared using chitosan and conjugated chitosan in different proportions. The patches were evaluated for different parameters such as thickness, folding endurance, SI, moisture content and moisture uptake, water vapor transmission test, tensile strength and extension, gel strength, in vitro and ex vivo permeation and stability studies. Observations of all the formulations for physical characterization have shown that the formulations show optimum results.
The release kinetics shows that chitosan and conjugated chitosan patches follow non‑Fickian diffusion and follow first order kinetics. Conjugation of chitosan increases the drug permeation, S5 shows maximum permeation. The gel strength of the conjugated chitosan has supported the results obtained from swelling study, moisture uptake study and in vitro drug permeation. Stability studies were conducted for S5 patches up to 2 months. These patches were evaluated for in vitro permeation after 2 months. No significant change was found in permeation during study period. Thus, it could be concluded that patches were stable. Studies have shown promising results, and there is a scope for further pharmacodynamic and pharmacokinetic evaluation. There is a need to conduct toxicity studies using various experimental animals and evaluate the safety and efficacy of selected formulations.
References
- Kast CE, Bernkop‑Schnurch A. Thiolated polymers – Thiomers: Development and in vitro evaluation of chitosan‑thioglycolic acid conjugates. Biomaterials 2001; 22:2345‑52.
- Bernkop‑Schnurch A, Steininger S. Synthesis and characterisation of mucoadhesive thiolated polymers. Int J Pharm 2000; 194:239‑47.
- Tanwar YS, Chauhan CS, Sharma A. Development and evaluation of carvedilol transdermal patches. Acta Pharm 2007;57:151‑9.
- Stafylas PC, Sarafidis PA. Carvedilol in hypertension treatment. Vasc Health Risk Manag 2008;4:23‑30.
- Ubaidulla U, Reddy MV, Ruckmani K, Ahmad FJ, Khar RK. Transdermal therapeutic system of carvedilol: Effect of hydrophilic and hydrophobic matrix on in vitro and in vivo characteristics. AAPS PharmSciTech 2007;8:2.
- Kast CE, Frick W, Losert U, Bernkop‑Schnurch A. Chitosan‑thioglycolic acid conjugate: A new scaffold material for tissue engineering? Int J Pharm 2003;256:183‑9.
- Dureja H, Tiwary AK, Gupta S. Simulation of skin permeability in chitosan membranes. Int J Pharm 2001;213:193‑8.
- Ammar HO, Salama HA, El‑Nahhas SA, Elmotasem H. Design and evaluation of chitosan films for transdermal delivery of glimepiride. Curr Drug Deliv 2008;5:290‑8.
- Aggarwal G, Sanju D. Development, fabrication and evaluation of transdermal drug delivery system‑A review. Pharmainfo.net 2009;7.
- Padula C, Nicoli S, Colombo P, Santi P. Single‑layer transdermal film containing lidocaine: Modulation of drug release. Eur J Pharm Biopharm 2007;66:422‑8.
- Wahid A, Sridhar BK, Shivakumar S. Preparation and evaluation of transdermal drug delivery system of etoricoxib using modified chitosan. Indian J Pharm Sci 2008;70:455‑60.
- Sadashivaiah R, Dinesh BM, Patil UA, Desai BG, Raghu KS. Design and in vitro evaluation of haloperidol lactate transdermal patches containing ethyl cellulose‑povidone as film formers. Asian J Pharm 2008;2:43‑9.
