- *Corresponding Author:
- A. S. Vairale
Dermatology–Research and Development, IPDO, Innovation Plaza, Dr. Reddy’s Laboratories Ltd., Bachupally, Hyderabad–500 072
E-mail: vairale_ajay@rediffmail.com
| Date of Submission | January 04, 2012 |
| Date of Revision | March 14, 2012 |
| Date of Acceptance | March 17, 2012 |
| Indian J Pharm Sci, 2012, 74 (2): 107-115 |
Abstract
A gradient reversed phase HPLC method was developed and validated for analysis of betamethasone dipropionate, its related substances and degradation products, using Altima C18 column (250×4.6 mm, 5 µm) with a flow rate of 1.0 ml/min and detection wavelength of 240 nm. The mobile phase A is a mixture of water, tetrahydrofuran and acetonitrile in the ratio of 90:4:6 (v/v/v) while mobile phase B is a mixture of acetonitrile, tetrahydrofuran, water and methanol in the ratio of 74:2:4:20 (v/v/v/v). The samples were analyzed using 20 µl injection volume and the column temperature was maintained at 50°. The limit of detection and limit of quantitation were found to be 0.02 µg/ml and 0.07 μg/ml, respectively. The stability-indicating capability of method was established by forced degradation studies and method demonstrated successful separation of drug, its related substances and degradation products. The method was validated as per the International Conference on Harmonization guidelines. The developed method is linear in the range of 0.07 to 200% of specification limits established for all the known related substances; betamethasone17â??propionate, betamethasone 21â??propionate, betamethasone 17â??propionateâ??21â??acetate (RSD <5, 2, 1%, respectively, r2=09991â??0.9999 for sample concentration of 100 µg/ml). The method is sensitive, specific, linear, accurate, precise and stability indicating for the quantitation of drug, its related substances and other degradation compounds.
Keywords
Betmethasone dipropionate, forced degradation, HPLC method, stability indicating, topical formulations
Betamethasone dipropionate (BD) (9-fluoro-11(β), 17,21-trihydroxy-16(β)-methylpregna-1,4-diene-3,20- dione 17,21-dipropionate) is an active pharmaceutical ingredient belonging to the family of glucocorticoid steroid and is classified as a super-potent corticosteroid with topical antiinflammatory activity. The topical formulations containing BD are being marketed in US since 1975. The various dosage forms of BD currently available in the market are cream, gel and lotion and these approved products contain at least 0.064% betamethasone dipropionate. The topical corticosteroids, such as BD are effective in the treatment of psoriasis and corticosteroid-responsive dermatoses, primarily because of their antiinflammatory, antipruritic, and vasoconstrictive actions [1-3]. The topical products of BD contain very low concentration of active substance to avoid the skin irritation; however, it results into higher frequency of administration.
In pharmaceutical product development, impurity profiling plays a vital role. The regulatory bodies such as US-FDA and EMA mandates to estimate the impurity present above 0.1% of the label claim for the active substance. The International Conference on Harmonization (ICH) has also provided a guidance document to monitor impurities present in new drug substances and new drug products [4]. Sometimes over the shelf life, the dosage form factors can influence the drug stability and ultimately resulting into forced recall of the marketed products. Fluocinonide topical solution USP, 0.05% presented in 60-ml bottle, was recalled from the United States markets because degradation products were generated leading to the sub-potent formulation [5]. According to a stimuli paper for topical and transdermal product [6] by USP Pharmacopeia forum, determination of related substances should be the first step in examination of safety and quality of the drug product. Thus, according to the recommended approach, the analytical method being used should be sensitive (having low limit of detection and quantitation) and stability indicating i.e. should be able to separate and quantify the drug, its related substances and degradation products.
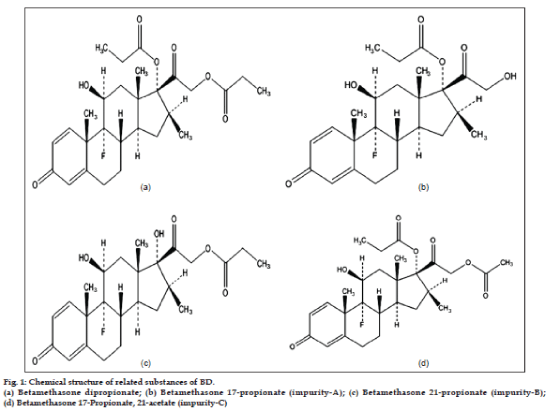
As depicted in fig. 1, the active moiety, BD has very close structural similarities with its all three related substances and hence it is very challenging to develop a stability-indicating RP-HPLC method which can monitor the chromatographic purity of BD and can also quantify the related substances throughout the shelf-life of the dosage form. The other challenges in developing analytical method for related substance in BD topical formulations are; low concentrations of active, presence of preservative and antioxidant and interference from their respective degradation products. The thorough literature survey revealed that a few stability-indicating normal and reverse phase HPLC methods for betamethasone dipropionate, betamethasone valerate and dexamethasone in their respective dosage forms [7-13] are available but all of these methods are specific to the formulation compositions which are different than the formulation developed in our laboratory. Moreover, the three pharmacopeia; USP, BP and EP have reported the assay methods for estimating BD in different dosage forms but not for the impurity quantification [14-16].
The present analytical work describes an accurate, specific, repeatable and stability-indicating method for the determination BD in presence of its degradation products and related substances for assessment of purity of drug and stability of its topical dosage forms. The proposed method was validated as per ICH guidelines and its updated international convention [17].
Materials and Methods
9α-Fluoro-11β,17,21-trihydroxy-16β-methyl-pregna-1, 4-diene-3,20-dione 17-propionate (impurity-A), 9α- fluoro-11β,17,21-trihydroxy-16β-methyl-pregna-1,4- diene-3,20-dione 21-propionate (impurity-B), 9α-flu oro-11β,17,21-trihydroxy-16β-methyl-pregna-1,4-die ne-3,20-dione 17-propionate 21-acetate (impurity-C) and BD were procured from Crystal Pharma, Italy. Cream formulation containing BD was prepared at Dermatology-R and D Laboratory of Dr. Reddy’s. The HPLC grade acetonitrile, tetrahydrofuran and methanol were purchased from Rankem (RFCL Ltd., Delhi). The nylon 66 membrane filters of 0.45 µm size and nylon syringe filters of 0.2 µm size were obtained from Pall Life Science Limited, India. The PVDF syringe filters of 0.2 µm size were obtained from Merck-Millipore, India. Milli-Q Plus water purification system (Millipore, Milford, MA, USA) was used to generate high purity water. All experiments were performed using class volumetric glassware in GLP compliant analytical laboratory.
The method development and validation was carried out on Waters Alliance-HPLC system equipped with 2695-separation module connected to 2996-photo diode array detector and the data was acquired by Empower® version 2. The other equipments used are electronic balance (Mettler Toledo, USA), sonicator (Bandalein Sonorex, Germany), centrifuge (Heraeus Biofuge Stratos, UK), photo-stability chamber (Sanyo Gallenkamp PLC, Leics., UK) and vacuum oven (Themolab, India).
Chromatography conditions
The separation of BD and related substances was achieved using Alltima C18 5 μ, 250×4.6 mm as a stationary phase and eluting it for 80 min with mobile phases A-B (gradient program as depicted in Table 1) at a flow rate of 1.0 ml/min. The mobile phase A is a mixture of water, tetrahydrofuran and acetonitrile in the ratio of 90:4:6 (v/v/v) while mobile phase B is a mixture of acetonitrile, tetrahydrofuran, water, and methanol in the ratio of 74:2:4:20 (v/v/v/v). The samples were analyzed using 20 µl injection volume and the column temperature was maintained at 50° throughout the analysis using column oven. Detection and purity establishment of the main drug and its related substances were achieved using a photo diode array (PDA) detector at 240 nm wavelength.
| Time (min) | Flow rate (ml/min) | Mobile Phase-A (%) | Mobile Phase-B (%) |
|---|---|---|---|
| 0.01 | 1.00 | 75.0 | 25.0 |
| 2.0 | 1.00 | 75.0 | 25.0 |
| 37.0 | 1.00 | 58.0 | 42.0 |
| 48.0 | 1.00 | 45.0 | 55.0 |
| 57.0 | 1.00 | 45.0 | 55.0 |
| 62.0 | 1.00 | 10.0 | 90.0 |
| 70.0 | 1.00 | 10.0 | 90.0 |
| 72.0 | 1.00 | 75.0 | 25.0 |
| 80.0 | 1.00 | 75.0 | 25.0 |
Table 1: The optimised gradient programme
Preparation of standard and sample solution
A mixture of water and acetonitrile in the ratio of 20:80 v/v was used as a diluent. The standard stock solution of BD was prepared at 100 µg/ml concentration. The working standard solution of 1 µg/ml was prepared from 100 µg/ml stock solution with the help of above mentioned diluent. The resolution solution to be used in system suitability experiment was made to contain 2 µg/ml impurity-C and 100 µg/ ml BD.
The sample solutions of dosage forms and respective placebo were prepared by transferring 4 g of drug product formulation or 4 g of placebo formulation, which is equivalent to 2.0 mg of BD, into 20 ml volumetric flask to which 15 ml of diluent was added and further mixed using cyclo-mixer. The resultant dispersion was further sonicated for 30 min with intermittent shaking and then brought to the room temperature and the volume was made up to the mark with diluent. The resultant dispersion was further centrifuged at 10,000 rpm for 15 min. Further, the supernatant solution was filtered through 0.2 µm PVDF filter.
Method validation
The developed method was validated for specificity, limit of detection (LOD), limit of quantitation (LOQ), linearity, precision, accuracy, solution stability, robustness and filter validation as per the guidance provided by ICH guidelines [17]. The system suitability was demonstrated every time before the experiments of above mentioned validation parameters. The system suitability experiment consists of injecting blank (diluent), resolution solution and working standard solution (in duplicate) in to the chromatographic system. The acceptance criterion for the system suitability is explained in detail in result and discussion section.
Specificity is the ability of a method to measure the analyte response in the presence of all potential impurities and formulation matrix. The specificity of the method was established by injecting solution of 100 µg/ ml of BD and three individual solution of impurity-A (2 µg/ml), impurity-B (1 µg/ml) and impurity-C (1 µg/ml) in the above given chromatographic conditions.
Further, to understand the matrix effect, sample solutions of dosage forms, their respective placebo and sample solutions of dosage forms spiked with known impurities (2 µg/ml of impurity-A, 1 µg/ml of impurity-B and 1 µg/ml of impurity-C) were also injected. Moreover, 4 g sample of dosage forms and their respective placebo formulations were exposed to various stress conditions like acid (1 ml of 1 N HCl at 40° for 1 h) and base (1 ml of 0.2 N NaOH at RT for 15 min), peroxide (1 ml of 50% v/v H2O2 at RT for 20 min), heat (105° for 6 h), UV (total 200 watt h/m2), light (total 1.2 million Lux h) and humidity (90% RH at 25° for 72 h). The sample and placebo for acid were neutralized with base (1 ml of 1.0 N NaOH) and the sample and placebo for base were neutralized with acid (1 ml of 0.02 N HCl). The final samples were prepared from these neutralized samples as per the method described under the section ‘Preparation of standard and sample solution’.
The limit of detection (LOD) and limit of quantitation (LOQ) for BD and all three known impurities was determined by adopting slope method approach as delineated in ICH guidelines [17]. The individual stock solutions of BD (100 µg/ml) and three known impurities; impurity-A (100 µg/ml), impurity-B (100 µg/ml) and impurity-C (100 µg/ml) were prepared to demonstrate the linearity. The solution for six calibration levels containing BD and three known impurities were prepared using different volumes from the above mentioned stock solutions. The resultant solutions of calibration levels have different specifications of individual known impurities (<5% for impurity-A, 2% for impurity-B and 1% for impurity-C). The graph of peak area of BD and three known impurities was plotted against their respective concentrations. The method of least square regression was used to describe correlation coefficient, regression equation and Y-intercept bias.
The precision was studied by preparing six replicates at LOQ and 100% level of the specification (<2% for impurity-A, 1% for impurity-B and 1% for impurity-C). The LOQ samples were prepared by taking 4 g of placebo formulation in 20 ml volumetric flask and spiking it with BD, impurity-A, impurity-B and impurity-C (to have individual concentration of 0.07 µg/ml in 20 ml sample solution) and the final volume was made up to the mark. The 100% level samples were prepared by taking 4 g of formulation (equivalent to total 2 mg of BD i.e. 100 µg/ml) in 20 ml volumetric flask and spiking it with impurity-A (to have concentration of 2 µg/ml), impurity-B (to have concentration of 1 µg/ml) and impurity-C (to have concentration of 1 µg/ml) and the final volume was made up to the mark. The % RSD of observed impurity levels were calculated and reported for each impurity. The intermediate precision (reproducibility) at 100% level was also performed during validation exercise by analyzing the new set of six replicates samples on day 2 by second analyst.
The recovery experiments were carried out by standard addition technique to demonstrate the accuracy of the proposed method. The BD and impurity standard solutions at four different levels (LOQ, 50, 100 and 150%) were added to placebo. The prepared triplicate solutions were injected in to the chromatographic system. The LOQ samples were prepared by taking 4 g of placebo formulation in 20 ml volumetric flask and spiking it with BD, impurity-A, impurity-B and impurity-C (to have individual concentration of 0.07 µg/ml in 20 ml sample solution) and the final volume was made up to the mark. The 50% level samples were prepared by taking 4 g of placebo formulation in 20 ml volumetric flask and spiking BD (to have concentration of 100 µg/ml), impurity-A (to have concentration of 2.5 µg/ml), impurity-B (to have concentration of 1 µg/ml) and impurity-C (to have concentration of 0.5 µg/ml) and the final volume is made up to the mark. Similarly the 100% and 150% level samples were prepared by varying the concentration of all three impurities while keeping the BD concentration same as that in 50% level.
The solution stability was demonstrated for working standard solution of BD (1 µg/ml) and impurity spiked solutions of all three known impurities (impurity-A: 2 µg/ml, impurity-B: 1 μg/ml and impurity-C: 1 µg/ml). Both the solutions were prepared in duplicate and bench top stability at room temperature was evaluated by analyzing samples at initial, 24, 48 and 120 h. The similarity factor was calculated against freshly prepared working standard of BD at each time point.
The robustness of the method was established by injecting three different solutions (working standard solution of BD, resolution solution and sample solutions of dosage forms spiked with three known impurities) at three different flow rate and three different column temperature. The concentration of working standard of BD used was 1 µg/ml. The concentration impurity-C was kept at 1 µg/ml and BD was kept at 100 µg/ml in the resolution solution. The third solution was prepared to contain 100 µg/ ml of BD along with 2 µg/ ml of impurity-A, 1 μg/ml of impurity-B and 1 µg/ml of impurity-C. The duplicate injections of the above three solutions were analyzed by keeping flow rate 1 ml/min at three column temperature of 45°, 50° and 55°. Further, the duplicate injections of the above three solutions were also analyzed by keeping column temperature at 50° at flow rate of 0.9, 1.0 and 1.2 ml/min. Thus, total six injections in duplicate were analyzed using the chromatographic system.
The filter validation exercise was done on two different filters (PVDF and Nylon) using sample solutions of dosage forms spiked with three known impurities (as prepared in 100% level of precision experiment). Further, the above samples were centrifuged at 10,000 rpm for 15 min and 20 µl supernatant solutions were analyzed using the chromatographic system. The supernatant was also filtered through 0.2 µ PVDF and 0.2 µ Nylon filters. The peak responses of individual three impurities from filtered samples were compared against peak responses from centrifuged (Un-filtered) samples.
Results and Discussion
BD and all its related compounds showed wavelength maxima at 240 nm and therefore it was selected as wavelength for the detection. The column oven temperature was maintained at 50° to achieve the sharpness of the peaks.
Three different injection volumes; 20, 50 and 100 µl were evaluated to achieve the maximum peak response. However, 20 µl was selected as injection volume, since loss of specificity among the placebo and impurity-C were observed at 50 µl and 100 µl injection.
Initially, the mobile phase A consist of mixture of water and acteonitrile in the ratio of 90:10 (v/v) which is more polar and mobile phase B consist of a mixture of acetonitrile and water in the ratio of 90:10 (v/v) which is less polar were tried in gradient elution. Further, methanol was added and acetonitrile was reduced in mobile phase B to make it less polar. Thus, the gradient elution with mobile phase A (90:10 v/v of water:acetonitrile) and mobile phase B (80:10:10 v/v/v of acetonitile:water:methanol) gave the required separation of BD and its related substances. However, the separation amongst peaks of impurity-C and the excipients from the formulation matrix could not be achieved. Therefore, tetrahydrofuran (THF) was added to the mobile phase B to make it further less polar as the polarity index of THF is 4.0. The percentage of THF in the mobile phase B was optimized to 2%. Thus, the final composition of mobile phase B was optimized as 74:2:4:20 v/v/v/v of acetonitrile:THF:water:methanol, respectively. The gradient elution with this combination of mobile phase A (90:10 v/v of water:acetonitrile) and mobile phase B (74:2:4:20 v/v/v/v of acetonitrile:T HF:water:methanol) gave good separation amongst BD, all impurities, peaks from matrix and BD but the base line shift was observed. Therefore, to avoid this shift in baseline THF was also added in mobile phase A. Finally the combination of mobile phase A consisting of water, tetrahydrofuran and acetonitrile in the ratio of 90:4:6 (v/v/v) and mobile phase B consisting of acetonitrile, tetrahydrofuran, water, and methanol in the ratio of 74:2:4:20 (v/v/v/v) with elution time of 80 min gave sharp peaks and desired resolution of BD, its related compounds and matrix peaks.
Among the three different makes of column having same stationary phase (chemistry and dimensions), Altima C18 (250×4.6 mm) column was chosen since it gave higher selectivity of all peaks of interest and showed consistent performance in various lots of the columns.
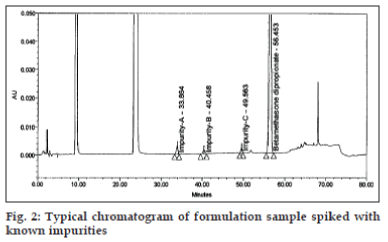
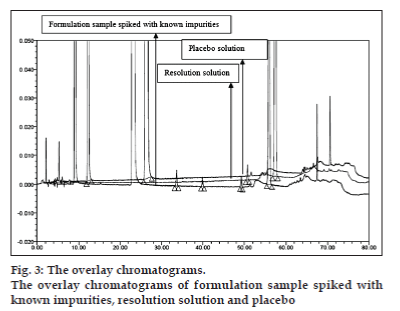
Flow rate of 1.0 ml/min was chosen for the back pressure reasons. The optimized method showed good resolution between BD and three related substances (fig. 2) and BD, three related substances and placebo peaks (fig. 3). The retention time, relative retention time and relative response factor of each impurity and their concentration with respect to BD are depicted in Table 2.
| Impurities | Working concentration | RT (min) | RRT | RRF | |
|---|---|---|---|---|---|
| (µg/ml) | (%) | ||||
| Impurity-A | 5 | 5 | 33.86 | 0.602 | 1.09 |
| Impurity-B | 2 | 2 | 40.45 | 0.715 | 1.17 |
| Impurity-C | 1 | 1 | 49.56 | 0.880 | 1.01 |
| BD | 100 | 100 | 56.45 | 1.000 | 1.00 |
Table 2: Retention time, relative retention time and relative response factor of bd and impurities
The extraction of drug from the formulation matrix was carried out using different ratio of various solvent mixtures such as methanol:tetrahydrofuran, water:methanol and water:acetonitrile. The solvent mixture containing tetrahydrofuran showed poor peak asymmetry and water:methanol solvent mixture could not provide the desired recoveries from the formulation matrix. BD and its related substances are soluble in acetonitile and therefore combination of water:acetonitrile (20:80 v/v) gave complete extraction from the matrix of in house formulations. Moreover, this solvent mixture also imparted good peak symmetry because the chosen solvent mixture is miscible with the optimized combination of mobile phases.
The system suitability with the following acceptance criterion was demonstrated every time before all experiments of the validation parameters. The resolution between impurity-C and BD was set to be not less than 11 since this was sufficient to provide the required separation between impurity-C and placebo peaks. The ratio of peak areas of BD in two replicate injections from the working standard solution should be in the range of 0.9 to 1.1 since this ratio ascertains to limit the injection to injection variability. The tailing factor of 2 was selected since this controls the peak asymmetry.
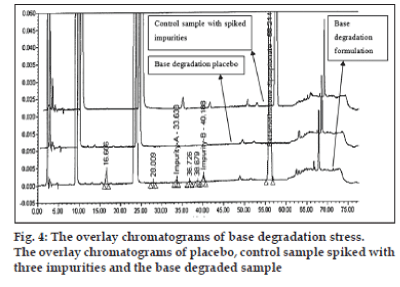
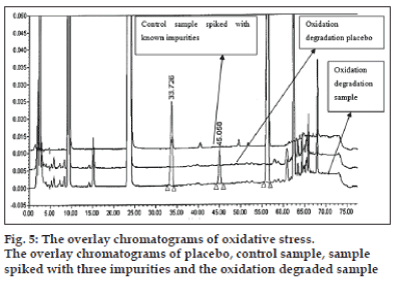
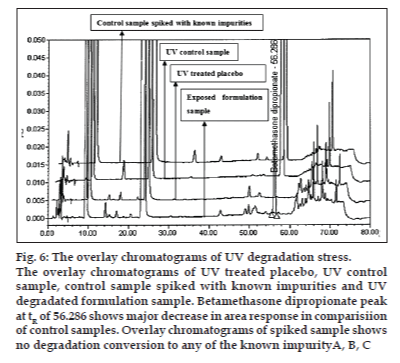
The optimized chromatographic conditions were further subjected to method validation as per ICH guidelines. The chromatograms depicted in figs. 2 and 3 revealed that the developed method is specific since there is no interference amongst BD, its related substances and peaks from formulation matrix. The results of the various forced degradation experiments are summarized in Table 3. The peak purity of BD and its related substances in forced degradation samples shows that the peak of BD and its related substances is pure as the purity angle of BD and its related substance is less than the purity threshold. Amongst, the various degradation conditions only base, peroxide and light are responsible for the degradation of BD. The data from Table 3, figs. 4 and 5 revealed that BD got degraded in base to form unknown impurities of 2.28% and in peroxide condition to form impurity A 17.63%. As depicted in fig. 6, the peak height and area counts of BD got reduced, confirming the susceptibility of BD to photolytic conditions. Moreover, as depicted in Table 3 the maximum net degradation of BD was also observed in photolytic conditions (49.4% in UV and 89.6% in visible). However, the data revealed that the photo degradation of BD did not result in to the three known impurities. This finding is in line with the recent findings of Lin et al. [18]. The overall results of specificity study insure the stability-indicating nature of the developed method [19].
| Degradation conditions* | Impurity-A (%) | Impurity-B (%) | Impurity-C (%) | Highest unknown (%) | Total impurity (%) | Net degradation (%) | |
|---|---|---|---|---|---|---|---|
| A | Control | ND** | ND | BLOQ*** | ND | 0.05 | 0.05 |
| B | Acid | 0.27 | 0.48 | ND | ND | 0.75 | 0.70 |
| C | Base | 0.63 | 1.27 | ND | 2.28 | 4.90 | 4.85 |
| D | Oxidation | 17.63 | Nil | ND | 7.86 | 25.88 | 25.83 |
| E | Heat | 0.43 | ND | ND | ND | ND | 0.38 |
| F | UV | ND | ND | 1.14 | ND | 1.14 | 49.4 |
| G | Visible | ND | ND | ND | ND | ND | 89.6 |
| H | Humidity | ND | ND | ND | ND | ND | 0.00 |
Table 3: Force degradation data of bd from developed formulation
Fig. 6: The overlay chromatograms of UV degradation stress.
The overlay chromatograms of UV treated placebo, UV control
sample, control sample spiked with known impurities and UV
degradated formulation sample. Betamethasone dipropionate peak
at tR of 56.286 shows major decrease in area response in comparisiion
of control samples. Overlay chromatograms of spiked sample shows
no degradation conversion to any of the known impurityA, B, C
The limit of detection and limit of quantitation were found to be 0.02 and 0.07 μg/ml, respectively for BD as well as its related substances. Moreover, the signals to noise (S/N) ratios are in the range of 3.4 to 4.3 for LOD and 9.4 to 10.4 for LOQ for BD and its related substance, indicating that the noise is not contributing to the quantified area.
The results of linearity experiments are depicted in Table 4. The results revealed that the developed method is linear in the range of 0.07 µg/ml (LOQ) to 2.02 µg/ml (200% of unknown impurity specification-1%) for BD. The same method is also linear in the range of 0.07 µg/ml (LOQ) to 200% of individual impurity specification (i.e. for impurity-A 200% of 5%=10 µg/ml, for impurity-B 200% of 2%=4 µg/ml and for impurity-C 200% of 1%=2 µg/ ml) of all three impurities. The regression coefficients for BD and the three related impurities are in the range of 0.9991-0.9999. Moreover, the calculated Y intercept bias (Intercept/Area count of response at 100% of specification level×100) is less than 2%, validating the linearity of the curve.
| Compound | Linearity range (µg/ml) | Correlation coefficient r2 | Linearityequation | Y- Intercept bias |
|---|---|---|---|---|
| Impurity-A | 0.069-9.921 | 0.9998 | 39001x+404.1 | 0.2 |
| Impurity-B | 0.07-3.97 | 0.9991 | 41820x+601.4 | 0.7 |
| Impurity-C | 0.07-2.00 | 0.9999 | 36572x+66.27 | 0.2 |
| BD | 0.07-2.02 | 0.9999 | 36980x-407.1 | -1.0 |
Table 4: Linearity data for bd and its impurities
The results of precision (repatability and reproducibility) experiments are collated in Table 5. The data confirmed the repetability and reproducibility (precision at 100% level with second analyst on day 2) of the developed method since all % RSD values are less than 5.
| Impurities | Precision at LOQ | Precision at 100% | Intermediate precision at 100% | |||
|---|---|---|---|---|---|---|
| Impurity (%) | % RSD n=6 | Impurity (%) | % RSD n=6 | Impurity (%) | % RSD n=6 | |
| Impurity-A | 0.08 | 2.58 | 2.06 | 0.96 | 2.10 | 0.43 |
| Impurity-B | 0.07 | 4.48 | 0.99 | 1.21 | 0.98 | 1.03 |
| Impurity-C | 0.07 | 4.29 | 1.00 | 1.05 | 0.97 | 1.07 |
Table 5: Precision and intermediate precision data
The mean of all recovery values at three different levels for all related impurities are in the range of 98-102% which are well within the acceptance criteria of 90-110%. Thus, the developed method is accurate with respect to all three impurities.
The bench top solution stability data of standard (BD) and sample solutions (three related impurities) showed that there is no instability upto 120 h since the calculated similarity factor at the three different time period were below the acceptance criterion of 10%. Thus, the developed method is rugged.
The results of robustness studies are collated in Table 6. The data revealed that by varying the flow rate and column temperature, the acceptance criterion for system sutability is still fullfilled for all the three parameters (ratio of peak areas of BD in two replicate injections, tailing factor of BD and resolution between impurity-C and BD). Morovere, by varying the flow rate and column temperature for sample solutions of dosage forms spiked with three known impurities, the relative retention time of all three impurities with respect to BD did not get affected. Thus, the developed method is robust.
| Parameters | Flow rate (ml/min) | Column temperature (°) | Acceptance criteria | ||||
|---|---|---|---|---|---|---|---|
| 0.90 | 1.0 | 1.20 | 45 | 50 | 55 | ||
| The ratio of the area of two diluted standard injections | 1.00 | 1.01 | 1.03 | 1.01 | 1.01 | 1.00 | NLT 0.9 and NMT 1.1 |
| The tailing factor of BD | 0.9 | 0.9 | 0.9 | 0.9 | 0.9 | 0.9 | Not more than 2.0 |
| The Resolution between the impurity-C and BD | 13.2 | 13.0 | 12.7 | 13.1 | 13.0 | 12.1 | Not less than 11.0 |
Table 6: System suitability data for robustness studies
The filter validataion data is delineated in Table 7. The data revealed that the difference of impurity contents (for all three impurities and total impurities) from centrifuged portion and filtered portion is not more than 10%, indicating that there is no drug binding and no interference from any unknown peaks generated from either PVDF or Nylon filter.
| Parameters | Impurity-A (%) | Impurity-B (%) | Impurity-C (%) | Total impurity (%) | ||||
|---|---|---|---|---|---|---|---|---|
| SPL-1 | SPL-2 | SPL-1 | SPL-2 | SPL-1 | SPL-2 | SPL-1 | SPL-2 | |
| Centrifuged sample | 2.126 | 2.135 | 0.965 | 0.954 | 1.025 | 1.018 | 4.116 | 4.107 |
| 0.2 µ Nylon filter | 2.126 | 2.104 | 0.955 | 0.966 | 1.015 | 1.022 | 4.096 | 4.092 |
| 0.2 µ PVDF filter | 2.115 | 2.095 | 0.957 | 0.938 | 0.965 | 1.003 | 4.099 | 4.036 |
| % Difference 0.2 µ Nylon filter | 0.0 | 1.5 | 1.0 | 1.3 | 1.0 | 0.4 | 0.5 | 0.4 |
| % Difference 0.2 µ PVDF filter | 0.5 | 1.9 | 0.8 | 1.7 | 0.2 | 1.5 | 0.4 | 1.7 |
Table 7: Data of filter validation experiment in ruggedness study
The developed method provides selective quantification of BD and its three related impurities without having interference from blank solution and formulation matrix solutions, thereby affirming stability-indicating nature. The proposed method is highly sensitive, reproducible, and specific. Further, the developed method is robust for separating and quantifying BD and its three related impurities. The proposed method can also be extended for routine quality analysis of pharmaceutical products of the similar composition. The experience from the above described method indicates its simplicity in terms of sample preparation, precision and ruggedness compared to the other reported methods of determining BD and its related substance from lotions, creams and ointments.
Acknowledgements
The authors wish to thank the management of Dr. Reddy’s Laboratories Ltd. for supporting this work. The authors would also like to thank Dr. Ganesh Jadhav and Dr. Satish Kandavilli for their active support.
References
- Barnes PJ. Antiinflammatory actions of glucocorticoids: Molecular mechanisms. ClinSci 1998;94:557-72.
- Barnes PJ. Therapeutic strategies for allergic diseases. Nature 1999;402(Suppl 6760):B31-8.
- Haynes RC Jr. Thyroid and antithyroid drug. In: Gilman AG, Rall TW, Nies AS, Taylor P, editors. Goodman and Gilman’s the pharmacological basis of therapeutics. 8th ed. New York: Pergamon Press; 1990. p. 1361-83.
- Genotoxic and Carcinogenic Impurities in Drug Substances and Products: Recommended Approaches. FDA Center for Drug Evaluation and Research. Guidance for Industry (Draft); 03 December 2008.
- Roy J. Pharmaceutical Impurities-A Mini-Review. AAPS PharmSciTech2002;3(2):E6.
- Ueda CT, Shah VP, Derdzinski K, Ewing G, Flynn G, Maibach H, et al. Topical and Transdermal Drug Product–Stimuli to the revisionprocess. Pharmacopeial Forum 2009;35:750-64.
- Xiong Y, Xiao KP, Rustum AM. Development and validation of a stability-indicating RP-HPLC method to separate low levels of dexamethasone and other related compounds from betamethasone. J Pharm Biomed Anal 2009;49:646-54.
- Pereira AS, Oliveira LS, Mendes GD, Gabbai JJ, Nucci G. Quantification of betamethasone in human plasma by liquid chromatography-tandem mass spectrometry using atmospheric pressure photoionization in negative mode. J Chromatogr B 2005;828:27–32.
- Bhosale SD, Rajput SJ. RP-HPLC method for simultaneous determination of butenafine hydrochloride and betamethasone dipropionate in a cream formulation. J AOAC Int 2011;94:106-9.
- Arthur KE, Wolff JC, Carrier DJ. Analysis of betamethasone, dexamethasone and related compounds by liquid chromatography/ electrospray mass spectrometry. Rapid Commun Mass Spectrom2004;18:678–84.
- DeWasch K, De Brabander HF, Van de Wiele M, Vercammen J, Courtheyn D, Impens S. Differentiation between dexamethasone and betamethasone in a mixture using multiple mass spectrometry. J Chromatogr A 2001;926:79–86.
- Wu SM, Chen SH, Wu HL. Determination of betamethasone and dexamethasone by derivitization and liquid chromatography. Anal ChimActa 1992;268:255–60.
- Snyder LR, Kirkland JJ, Glajch JL, editors. Practical HPLC Method Development. New York: John Wiley and Sons; 1997.
- The United States Pharmacopeia-34/National formulary-29, Asian edition, Rockville MD: US Pharmacopoeia Convention, Inc.; 2011. 2025, 2026, 2028.
- British Pharmacopeia Vol. 1. London: The Stationery Office Publications; 2011. p. 265.
- European pharmacopeia. 5th ed. Strasbourg: Council of Europe; 2011. 1091.
- ICH, Validation of analytical procedures: text and methodology. Geneva: International Conference on Harmonization; 1996.
- Lin M, Li M, Buevich AV, Osterman R, Rustum AM. Rapid structure elucidation of drug degradation products using mechanism-based stress studies in conjunction with LC-MS and NMR spectroscopy: identification of a photodegradation product of betamethasone dipropionate. J Pharm Biomed Anal 2009;50:275-80
- ICH, Stability testing of new drug substances and product. Geneva: International Conference on Harmonization, IFPMA; 2003
