- Corresponding Author:
- M. C. Gohel
Anand College of Pharmacy, Anand-388 001,Ahmedabad-382 481, India
E-mail: mukeshgohel@hotmail.com
| Date of Submission | 17 December 2011 |
| Date of Revision | 08 April 2014 |
| Date of Acceptance | 16 April 2014 |
| Indian J Pharm Sci 2014;76(3): 245-251 |
Abstract
The objective of present work was to construct nomogram for obtaining a value of similarity factor (f 2 ) by employing the values of number of observations (n) and sum of squared difference of percentage drug dissolved between reference (R) and test (T) products (Σni=1(Ri-Ti)2) The steps for rearrangement of equation of similarity factor are presented. The values of f 2 were selected in the range of 45 to 100 for 4 to 12 observations (n) for computing the values (Σni=1(Ri-Ti)2) of Linear regression analysis was performed between number of observations and (Σni=1(Ri-Ti)2) Perfect correlation was observed in each case. Nomogram was constructed and later it was validated by using drug dissolution data from literature and our laboratory. The use of nomogram is recommended during research and development work to investigate effect of formulation or process variables. The nomogram can also be used during change in manufacturing site or change in equipment. It is concluded that the steps for calculation of f 2 can be truncated in the middle (i.e. at the step of calculation of factor (Σni=1(Ri-Ti)2) and a decision of similarity/dissimilarity can be taken employing the nomogram.
Keywords
Dissolution, nomogram, rearranged similarity function equation, similarity factor
The dissolution test is the most powerful performance test for solid oral dosage forms. Dissolution test is mainly used in the pharmaceutical industry for the measurement of batch-to-batch variability, i.e. for quality control purposes. The selected classical uses of the dissolution test include formulation and development work, selection of bio-batch, surrogate for in vivo test and establishment of in vivo in vitro correlation (IVIVC). The batch for bioequivalence study (biobatch) is selected considering the similarity of dissolution from reference and test products in multiple biorelevant dissolution media. The data for dissolution study and bioequivalence are generally demanded by FDA in ANDA applications.
A nomogram, a two-dimensional graph, is constructed to permit the approximate computation of a mathematical function. Most nomograms are used in applications where an approximate answer is appropriate and useful. Nomogram may also be used to check an answer obtained from an exact calculation method, i.e. for validation. In the present study, a nomogram is constructed for obtaining a value of similarity factor (f2).
Generic version of drug formulations has become popular due to cost benefit to the patients. During the development of generic formulation, similarity of dissolution between reference and test formulations is checked in multiple dissolution media. Moore and Flanner presented a model independent approach for expressing similarity and dissimilarity between dissolution profiles [1]. The equation of similarity factor is widely used in the pharmaceutical industry after its endorsement by USFDA [2]. The SUPAC-IR guideline also indicate that the dissolution profile can be compared using the similarity factor [3].
FDA guideline mentions that twelve units each of test and reference products must be employed for computing similarity factor using the mean dissolution values at each sampling time. To allow use of mean data, the percent coefficient of variation at the earlier time points (e.g. 15 min) should not be more than 20% and at other time points should not be more than 10%.
The dissolution measurements of the test and reference batches should be made under the same conditions. The dissolution time points for both the profiles should be the same. It is common practice to use relatively dense and equally spaced sampling time [4]. Only one measurement should be considered after 85% drug dissolution of both the products. The reference batch should be the most recently manufactured product.
As per EMEA guidelines, the evaluation of similarity is based on; (1) a minimum of three time points (zero excluded); (2) twelve individual values for every time points for each formulation; (3) not more than one mean value of greater than 85% drug dissolved for each formulation; (4) the standard deviation of the mean of any product should be less than 10% from second to last time points, and (5) in cases where more than 85% of the drugs are dissolved within 15 min, dissolution profiles may be accepted as similar without further mathematical evaluation [5].
Similarity factor can be used for dissolution profile comparison of formulations on switching over from one equipment to equipment. The impact of process variables can be examined by comparing dissolution profiles. The concept of quality by design is preferred by USFDA. The most integral parts of QbD are design of experiment (DOE) and design space. Singh and co-workers mentioned that DOE represent effective and cost-effective analytical tools to yield the optimal solution to a particular problem [6]. Singh and co-workers remarked that formulation by design is a holistic concept of formulation development aiming to design more efficacious, safe, economical and patient-compliant drug delivery system [7]. Flanner and co-workers used similarity and dissimilarity factors as dependent variables in D-optimal design [8].
In design of experiment (DOE), f2 or 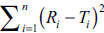 can be selected as a response (dependent variable).
The objective of undertaking present study was
to simplify the calculation of similarity factor by
terminating the calculations at an intermediate
step. The Eqn. for similarity is as follows:
can be selected as a response (dependent variable).
The objective of undertaking present study was
to simplify the calculation of similarity factor by
terminating the calculations at an intermediate
step. The Eqn. for similarity is as follows: 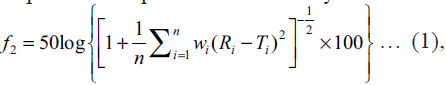 where
f2 is similarity factor, n is number of observations, wi is an optional weight factor and Ri and Ti represents
the percentage drug dissolved from reference and test
formulations respectively at different time points.
where
f2 is similarity factor, n is number of observations, wi is an optional weight factor and Ri and Ti represents
the percentage drug dissolved from reference and test
formulations respectively at different time points.
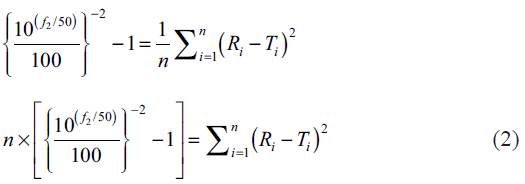
In the present study percent drug dissolved at all sampling time points were treated as equally important and therefore equal weight was given to data set at each sampling time point (wi=1). The steps for rearrangement of the similarity factor are shown below:
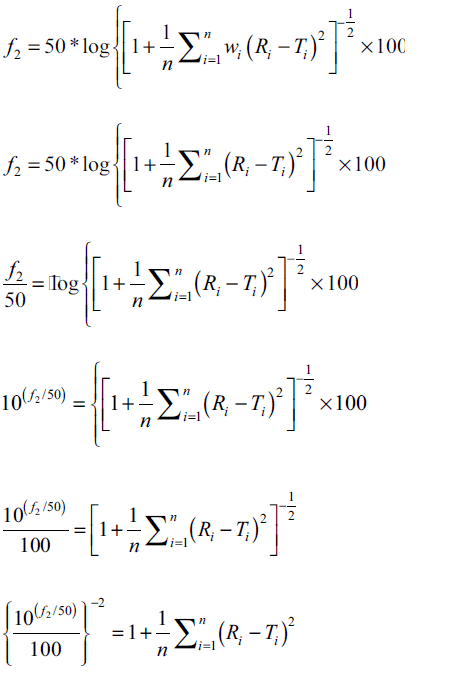
For the construction of nomogram, the values of similarity factor (f2) were chosen in the range of 45 to 100 with a step size of five and the number of observations (n) was selected in the range of 4 to 12 with a step size of one in eqn. 2. The computed values of sum of squared difference between reference and test products for selective f2 values are shown in Table 1.
| n | f2 | Dn f2 | D | n f2 | D | n | f2 | D | |||
|---|---|---|---|---|---|---|---|---|---|---|---|
| 4 | 50 | 396 | 4 | 65 | 96.48 | 4 | 83 | 15.15 | 4 | 99.99 | 0.0037 |
| 5 | 495 | 5 | 120.59 | 5 | 18.93 | 5 | 0.0046 | ||||
| 6 | 594 | 6 | 144.71 | 6 | 22.72 | 6 | 0.0055 | ||||
| 7 | 693 | 7 | 168.83 | 7 | 26.50 | 7 | 0.0065 | ||||
| 8 | 792 | 8 | 192.95 | 8 | 30.29 | 8 | 0.0074 | ||||
| 9 | 891 | 9 | 217.07 | 9 | 34.08 | 9 | 0.0083 | ||||
| 10 | 990 | 10 | 241.19 | 10 | 37.86 | 10 | 0.0092 | ||||
| 11 | 1089 | 11 | 265.31 | 11 | 41.65 | 11 | 0.0101 | ||||
| 12 | 1188 | 12 | 289.43 | 12 | 45.44 | 12 | 0.0110 | ||||
n: Number of observations, f2: Similarity factor and 
Table 1: Computed values of sum of squared difference between reference and test products (eqn. 2)
Researchers can use the grid shown in Table 1 for
computation of similarity factor by employing the
values of  (D) and n. A diagrammatic
representation of data is always easier to interpret and
therefore an effort was made to generate nomogram
by performing linear regression analysis between
the number of observations and the sum of squared
difference of percentage drug dissolved between
reference and test products for the selected values of
similarity factor (45 to 99.99). Figs. 1 and 2 show
the nomogram. Two figures were drawn in place of
one figure to improve readability of data. The value
of correlation coefficient was unity in all the cases,
indicating a perfect fit between the independent
variable (n) and dependent variable
(D) and n. A diagrammatic
representation of data is always easier to interpret and
therefore an effort was made to generate nomogram
by performing linear regression analysis between
the number of observations and the sum of squared
difference of percentage drug dissolved between
reference and test products for the selected values of
similarity factor (45 to 99.99). Figs. 1 and 2 show
the nomogram. Two figures were drawn in place of
one figure to improve readability of data. The value
of correlation coefficient was unity in all the cases,
indicating a perfect fit between the independent
variable (n) and dependent variable 

Figure 1: Nomogram for computation of similarity factor (f2 = 80 to 99.9).
The similarity factor can be obtained by intersecting the X axis (number of observations) and Y axis (sum of squared difference between R
and T).  F2=80,
  F2=83,
  F2=85,
  F2=90,
  F2=95,
  F2=99.9.

Figure 2: Nomogram for computation of similarity factor (f2 = 45 to 75).
The similarity factor can be obtained by intersecting the X axis (number of observations) and Y axis (sum of squared difference between
R and T). F2=45, F2=50, F2=55, F2=60, F2=65,  F2=70,
  F2=75.
For validation of the concept, data of dissolution studies were picked up from literature [9-13]. The similarity factor, computed using Eqn. 1, was compared with that obtained from the nomogram in each case and it was confirmed that the nomogram can be used by scientist for calculation of similarity factor and for drawing conclusion of similarity/ dissimilarity between two dissolution curves. The results are depicted in Table 2.
| n |  |
f2 | Reference Number |
|---|---|---|---|
| 4 | 154.83 | 60.02 | 6 |
| 4 | 357.645 | 51.09 | 6 |
| 4 | 354.22 | 51.19 | 6 |
| 4 | 393.63 | 50.06 | 6 |
| 4 | 474.61 | 48.06 | 6 |
| 8 | 1719.26 | 41.64 | 7 |
| 7 | 193.202 | 63.58 | 8 |
| 12 | 712.09 | 55.48 | 9 |
| 7 | 57.792 | 75.83 | 10 |
| 7 | 4472.8 | 29.84 | 10 |
 and f2 were calculated using actual data, and Eqn. 1 respectively
Table 2: Results for literature data sets for validation
Quetiapine fumarate extended release tablets (test product) were developed in our laboratory. Seroquel XR was chosen as a reference product. Dissolution study was conducted in 0.1 N HCl for 2 h followed by 6.2 pH phosphate buffer for up to 20 h, USP type I apparatus, 100 rpm for the test and the reference product. The samples were collected at 2, 4, 6, 8, 12, 16, and 20 h (n=7). The average percent drug dissolution from the test and reference product were 34 (35), 49 (45), 57 (55), 65 (66), 77 (80), 90 (92), and 99 (100). The data in parenthesis represneted for the reference product (Seroquel XR). The value of sum of squared difference between the reference and the test product was 36 and similarity factor (f2) was calculated as 80.29 using the equation suggested by Moore and Flanner [1]. Nomogram shown in fig. 1 yielded a value of 80.
The dissolution profiles are dissimilar (f2<50) if
the computed values of sum of squared difference
between reference and test products  are higher than 396, 495, 594, 693, 792, 891, 990,
1089 and 1188 for numbers of sampling times 4, 5,
6, 7, 8, 9, 10, 11 and 12 respectively (See Table 1).
The reverse is true (f2>50) if the computed values of
are higher than 396, 495, 594, 693, 792, 891, 990,
1089 and 1188 for numbers of sampling times 4, 5,
6, 7, 8, 9, 10, 11 and 12 respectively (See Table 1).
The reverse is true (f2>50) if the computed values of  are lower than the values stated above.
For the computation of similarity factor, USFDA
recommends use of twelve observations [2]. The data
shown in Table 3 were evolved using eqn. 2. Table 3 can be used for precise computation of similarity
factor if the factor  is known for n equal
to 12. Similar tables can be constructed for different
number of observations (n) using Eqn. 2.
is known for n equal
to 12. Similar tables can be constructed for different
number of observations (n) using Eqn. 2.
 |
f2 | |
f2 | |
f2 | |
f2 | |
f2 |
|---|---|---|---|---|---|---|---|---|---|
| 109429 | 1 | 17333 | 21 | 2737.0 | 41 | 423.69 | 61 | 57.05 | 81 |
| 99800 | 2 | 15807 | 22 | 2495.2 | 42 | 385.36 | 62 | 50.98 | 82 |
| 91017 | 3 | 14415 | 23 | 2274.6 | 43 | 350.39 | 63 | 45.44 | 83 |
| 83008 | 4 | 13146 | 24 | 2073.4 | 44 | 318.51 | 64 | 40.38 | 84 |
| 75703 | 5 | 11988 | 25 | 1889.9 | 45 | 289.43 | 65 | 35.77 | 85 |
| 69041 | 6 | 10932 | 26 | 1722.5 | 46 | 262.90 | 66 | 31.57 | 86 |
| 62965 | 7 | 9969 | 27 | 1569.9 | 47 | 238.72 | 67 | 27.74 | 87 |
| 57424 | 8 | 9091 | 28 | 1430.7 | 48 | 216.66 | 68 | 24.24 | 88 |
| 52370 | 9 | 8290 | 29 | 1303.8 | 49 | 196.54 | 69 | 21.05 | 89 |
| 47761 | 10 | 7559 | 30 | 1188.0 | 50 | 178.19 | 70 | 18.14 | 90 |
| 43557 | 11 | 6893 | 31 | 1082.4 | 51 | 161.45 | 71 | 15.49 | 91 |
| 39724 | 12 | 6286 | 32 | 986.1 | 52 | 146.19 | 72 | 13.07 | 92 |
| 36227 | 13 | 5732 | 33 | 898.3 | 53 | 132.27 | 73 | 10.87 | 93 |
| 33039 | 14 | 5226 | 34 | 818.2 | 54 | 119.58 | 74 | 8.85 | 94 |
| 30131 | 15 | 4765 | 35 | 745.1 | 55 | 108.00 | 75 | 7.02 | 95 |
| 27478 | 16 | 4345 | 36 | 678.5 | 56 | 97.44 | 76 | 5.35 | 96 |
| 25060 | 17 | 3962 | 37 | 617.8 | 57 | 87.81 | 77 | 3.82 | 97 |
| 22854 | 18 | 3612 | 38 | 562.4 | 58 | 79.03 | 78 | 2.43 | 98 |
| 20842 | 19 | 3293 | 39 | 511.8 | 59 | 71.02 | 79 | 1.16 | 99 |
| 19007 | 20 | 3002 | 40 | 465.7 | 60 | 63.71 | 80 | 0.00 | 100 |
f2: Similarity factor
Table 3: Similarity factor for twelve observations
Shah et al. reported that if the computed value of
f2 is 50, 65 or 83, the dissolution profiles can be
considered as similar at 10, 5 and 2 % difference
between reference and test products respectively [9]. If
the computed value of  is in between the
contour lines of f2 equal to 50 and 65, it is concluded
that the dissolution profiles are similar at 5 to 10%
difference between reference and test products.
However, if the computed value of
is in between the
contour lines of f2 equal to 50 and 65, it is concluded
that the dissolution profiles are similar at 5 to 10%
difference between reference and test products.
However, if the computed value of  is
in between the lines of f2 equal to 65 and 83, the
dissolution profiles are similar at 2 to 5 % difference between reference and test products. If the computed
value is below the line of f2 equal to 83, the
dissolution profiles are considered similar at 0 to 2 %
difference between reference and test products. Radar
diagram is presented in fig. 3 to display the results
graphically for f2 equal to 50 and 65. If the computed
value of
is
in between the lines of f2 equal to 65 and 83, the
dissolution profiles are similar at 2 to 5 % difference between reference and test products. If the computed
value is below the line of f2 equal to 83, the
dissolution profiles are considered similar at 0 to 2 %
difference between reference and test products. Radar
diagram is presented in fig. 3 to display the results
graphically for f2 equal to 50 and 65. If the computed
value of  is within the inner enclosed
geometrical area, the curves are similar at ≤5% level
and the outer enclosed area indicate similarity at
≤10%. The dissimilar region is appropriately defined
in the radar diagram.
is within the inner enclosed
geometrical area, the curves are similar at ≤5% level
and the outer enclosed area indicate similarity at
≤10%. The dissimilar region is appropriately defined
in the radar diagram.

Figure 3: Radar diagram for similarity factor equal to 50 and 65.
As the number of sampling time increases, the sum of squared
difference between R and T increases. n, F2=50, F2=65.
The concept presented in the present work can find
endless industrial applications demanding comparison
of dissolution profiles. The concept of quality by
design (QbD) and use of Design of Experiment
(DOE) have become popular in recent time. The
factor  can be used as a dependent
variable in DOE. Normal operating range (NOR) can
be used in the contour plot depicting the effect of two
independent variables IV’s on the factor
can be used as a dependent
variable in DOE. Normal operating range (NOR) can
be used in the contour plot depicting the effect of two
independent variables IV’s on the factor  .
.
Moore and Flanner expressed curvilinear relationship
between similarity factor (f2) and average difference
between percentage drug dissolved from reference
and test curves [1]. Model fitting was done employing
the values of log  (y-axis) and f2 (x-axis). A reasonable linearization (correlation
coefficient=0.989) was achieved on using semi
logarithmic plot for each observation (n=4 to 12).
The values of slope and intercept can also be used
for arbitrary calculation of similarity factor. If grid
search technique is adopted with this approach, exact computation of f2 is not feasible as the value of
correlation coefficient is less than one.
(y-axis) and f2 (x-axis). A reasonable linearization (correlation
coefficient=0.989) was achieved on using semi
logarithmic plot for each observation (n=4 to 12).
The values of slope and intercept can also be used
for arbitrary calculation of similarity factor. If grid
search technique is adopted with this approach, exact computation of f2 is not feasible as the value of
correlation coefficient is less than one.
Two nomograms are presented in the present study for computation of similarity factor. The data for the construction of nomogram are presented in a grid form. The nomogram was successfully used to compute value of similarity factor for the data reported in literature. A lot of men hours can be saved in pharmaceutical industry if the expanded grid is prepared, once only, containing calculations for f2 from 0 to 100 with a step size of one unit. Moreover, the expanded grid can be used for the validation purpose for the calculations of similarity factor by regulators. The use of nomogram is recommended for novice as well as for the scientists who are running in short of time since the calculation steps for obtaining the value of f2 are truncated. The terminal steps for calculation of f2 (logarithm and square root functions) are eliminated, which necessitates the need of computers, time, accuracy in calculation and trained personnel. The simplified approach, proposed in present work, is user friendly.
References
- Moore JW, Flanner HH. Mathematical comparison of dissolution profiles. Pharm Tech 1996;20:64-74.
- Guidance for Industry: Dissolution Testing of Immediate Release Solid Oral Dosage Forms.U.S. Department of Health and Human Services, Food and Drug Administration, Center for Drug Evaluation and Research (CDER). Aug, 1997.
- Guidance for Industry: Immediate Release Solid oral Dosage Forms, Scale-Up and Post-Approval Changes: Chemistry,Manufacturing and Controls, In Vitro Dissolution Testing, and In Vivo Bioequivalence Documentation. U.S. Department of Health and Human Services, Food and Drug Administration, Centre for Drug Evaluation and Research (CDER). November 1995.
- Vertzoni M, Symillides M, Iliadis A, Nicolaides E, Reppas C. Comparison of simulated cumulative drug versus time data sets with indices. Eur J Pharm Biopharm 2003;56:421-8.
- Note for Guidance on the Investigation of Bioavailability and Bioquivalence. EMEA, London. 2001.
- Singh B, Kumar R, Ahuja N. Optimizing drug delivery systems using systematic “design of experiments.” Part I: fundamental aspects. Crit Rev Ther Drug Carrier Syst 2005;22:27-105.
- Singh B, Kapil R, Nandi M, Ahuja N. Developing oral drug delivery systems using formulation by design: vital precepts, retrospect and prospects, Expert Opin Drug Deliv 2011;8:1341-60.
- Flanner HH, Vesey VF, Loehe JR. Dissolution fit factors as response variables in statistically designed experiments. Dissolution Technol 2001;8:1-5.
- Shah VP, Tsong Y, Sathe P, Liu J. In vitro dissolution profile comparison-statistics and analysis of the similarity factor, f2. Pharm Res 1998;15:889-96.
- Tsong Y, Hammerstrom T, Sathe P, Shah VP. Statistical assessment of mean differences between two dissolution data sets. Drug Inf J 1996;30:1105-12.
- Chow S, Ki FY. Statistical comparison between dissolution profiles of drug products. J Biopharm Stat 1997;7:241-58.
- Dunne A, Butler J, Devane J. A review of methods used to compare dissolution profile data. Pharm SciTechnol Today 1998;1:214-23.
- Polli JE, Rekhi G, Augsburger LL, Shah VP. Methods to compare dissolution profiles and a rationale for wide dissolution specifications for metoprolol tartrate tablets. J Pharm Sci 1997;86:690-700.