- *Corresponding Author:
- V. Udaya Bhaskar
Division of Pharmaceutical Analysis and Quality Assurance, Raghavendra Institute of Pharmaceutical Education and Research, Anantapur-522 721, India
E-mail: ubrpharm@gmail.com
| Date of Submission | 6 June 2013 |
| Date of Revision | 10 July 2014 |
| Date of Acceptance | 20 July 2014 |
| Indian J Pharm Sci 2014;76(5):407-414 |
Abstract
A new stability-indicating high-performance liquid chromatographic method for simultaneous analysis of sitagliptin and simvastatin in pharmaceutical dosage form was developed and validated. The mobile phase consisted of methanol and water (70:30, v/v) with 0.2 % of n-heptane sulfonic acid adjusted to pH 3.0 with ortho phosphoric acid was used. Retentions of sitagliptin and simvastatin were 4.3 min and 30.4 min, respectively with a flow rate of 1 ml/min on C 8 (Qualisil BDS, 250×4.6 mm, 5 μ). Eluents were detected at 253 nm using photodiode diode array detector. The linear regression analysis data for the linearity plot showed correlation coefficient values of 0.9998 and 0.9993 for sitagliptin and simvastatin, with respective concentration ranges of 20-150 μg/ml and 8-60 μg/ml. The relative standard deviation for inter-day precision was lower than 2.0%. The assay of sitagliptin and simvastatin was determined in tablet dosage form was found to be within limits. Both drugs were subjected to a variety of stress conditions such as acidic, basic, oxidation, photolytic, neutral and thermal stress in order to achieve adequate degradation. Results revealed that considerable degradation was found in all stress conditions except oxidative degradations. The method has proven specificity for stability indicating assay method.
Keywords
Sitagliptin, simvastatin, reverse phase liquid chromatography
Sitagliptin (SIT), [(R)-4-oxo-4- [3-(triflouromethyl)- 5,6-dihydro [1,2,4]triazolo [4,3-a]pyrizine-7(8H)-yl]-1- (2,4,5-trifloro phenyl)butan-2-amine] is the first of a new class of drugs for the treatment of type II diabetes, a well known hypoglycemic drug in the present therapy. It reduces blood glucose concentration by enhancing the effect of incretins and there by leading to a significant increase in insulin secretion [1,2]. The reported methods for determination of SIT in tablet dosage forms were UV spectrophotometry [3-6], RP-HPLC [7], UPLC [8], tandem mass spectrometry [9,10], capillary electrophoresis [11]. Simvastatin (SIM), [(1S,3R,7S,8S,8aR)-8-{2- [2r,4r)- 4-hydroxy-6-oxotetrahydro-2H-pyran-2yl]ethyl}- 3,7-dimethyl-1,2,3,7,8.8a-hexahydronaphthalene- 1-yl-2,2-dimethylbutanoate] belongs to a class of drugs that inhibit HMG-CoA reductase, commonly called statins, which act by inhibiting the metabolic pathway responsible for the endogenous production of cholesterol. SIM is mainly used for the treatment of dislipidemia and the prevention of cardiovascular disease. The determination of SIM has been carried out in tablets by UV spectrophotometry [12], RPHPLC [13-16], LC-MS/MS [17]. All the above reported methods were based on the estimation of SIT/SIM alone or in combination with other drugs. Focus on search for availability of a simultaneous stabilityindicating assay method (SIAM) for SIT and SIM revealed a report by Patel et al. [18], but the method has not included the stress studies and failed to reveal the possible degradation products. As there is a requirement for a suitable SIAM for SIT and SIM, the present study has been taken up with an objective to develop a stability-indicating RP-HPLC method for the simultaneous estimation of SIT and SIM by stress degradation to reveal possible degradation products in the combined dosage forms. This communication might as well represent the first report of a simple, sensitive and reproducible method for the simultaneous estimation of SIT and SIM from combined dosage form. Due to the high lipohillic nature of SIM compared to SIT, C8 column is recommended in this procedure to reduce the relative retention of SIM to the required retention of SIT. However, this work has been designed to reduce the retention of SIM (30 min) at the maximum by using C8 column and suitable buffer without affecting the specificity for SIT at lower retention time (4 min).
Materials and Methods
The pharmaceutical preparation of combination of SIT and SIM was Juvisync tablet. Methanol and water were of HPLC grade, purchased from Merck and Co. All solutions were protected from light and analyzed on the day of preparations. Glassware used in each procedure were soaked overnight in a mixture of chromic acid and sulphuric acid mixture, then rinsed thoroughly with double distilled water and dried in hot air oven. LC system (Agilent LC Model-1200 with Ezchromelite Software) containing C8 (Qualisil BDS, 250×4.6 mm, 5 μ) column with PDA detection, Labindia -3000+ UV/Vis double beam spectrophotometer with a fixed slit width 1nm and 1cm matched quartz cells were employed in the present study.
Preparation of standard drug solutions
Stock solutions of SIT and SIM were prepared by dissolving 10 mg of each in separate 10 ml of volumetric flask with small quantity of methanol. The mixture was sonicated for 10 min and made up the volume with methanol to give a concentration of 1000 μg/ml. These stock solutions were used for preparing working standards and calibration standards.
Chromatographic conditions
The mobile phase consisted of methanol and water in ratio 70:30 (water containing 0.2% HSA and pH was adjusted to 3.0 with OPA) were filtered before use through a 0.45 μ membrane and degassed for 10 min. The mobile phase was pumped from the solvent reservoir to the column at a flow rate of 1.0 ml/min and the injection volume was 20 μl. The eluents were monitored at 253 nm using PDA detection.
Calibration of standards
The calibration line was constructed for SIT and SIM using series of respective calibration standards. Aliquots stock solutions of SIT and SIM were accurately transferred in to 10 ml volumetric flasks and diluted to mark with mobile phase to yield a concentration range of 20-150 μg/ml for SIT and 8-60 μg/ml for SIM. The calibration line was obtained by plotting the mean peak area (n=3) against concentrations of drug.
Assay of SIT and SIM in tablets
Twenty tablets of marketed formulation (Juvisync) containing SIT 100 mg and SIM 20 mg were weighed, and finely powdered. Tablet powder equivalent to 100 mg SIT (which will contain SIM equivalent to 20 mg) was weighed and transferred to a 100 ml volumetric flask and extracted with methanol by sonication, then the volume was made up to 100 ml with diluents to obtain concentration of 1000 μg/ml. Resultant solution was filtered through Whatman filter paper followed by 0.45 μ nylon filter. One milliliter of filtrate was taken in 10 ml volumetric flask and was made up to 10 ml with diluent to obtain a concentration of 100 μg/ml for SIT and 20 μg/ml for SIM. From these solution aliquots concentrations are prepared and used for the sample analysis. Results were shown in Table 1.
| Formulation | Label claim (SIT; SIM) | Amount found (mg) mean ± SD (n=3) | Assay (%) | RSD (%) | |||
|---|---|---|---|---|---|---|---|
| SIT | SIM | SIT | SIM | SIT | SIM | ||
| Juvisync | 50 mg; 20mg | 50.30 | 19.31 | 100.1 | 96.6 | 0.15 | 0.47 |
Table 1: Assay results for sitagliptin and Simvastatin
Method validation procedure
The method was validated according to the ICH guidelines [19]. The following validations characteristics such as specificity, linearity, accuracy, precision, limits of detection, limit of quantitation and robustness.
Specificity
Specificity studies were carried out by stress degradation study, the parameter was evaluated based on the adequate resolution between analyte and degradation products as well as the ability of the method to detect analyte in presence of other products.
Linearity
The linearity of calibration curves (peak area vs concentration) in pure solution was checked over the concentration range of 20-150 μg/ml of SIT and 8-60 μg/ml of SIM. The regression line relating standard concentrations of drug using regression analysis, the calibration curves were linear in the studied range and equations of the regression analysis were obtained, r2=0.9998 for SIT and r2=0.9993 for SIM. The data was shown in figs. 1 and 2.
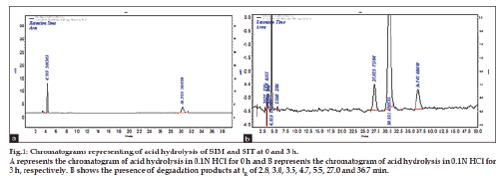
Figure 1: Chromatograms representing of acid hydrolysis of SIM and SIT at 0 and 3 h.
A represents the chromatogram of acid hydrolysis in 0.1N HCl for 0 h and B represents the chromatogram of acid hydrolysis in 0.1N HCl for
3 h, respectively. B shows the presence of degradation products at tR of 2.8, 3.0, 3.5, 4.7, 5.5, 27.0 and 36.7 min.
Accuracy
The accuracy study was carried by spiking of standard to the preanalyzed test sample solution at three different levels such as 80, 100, and 120%. Spiked solutions were analyzed under optimized conditions in replicate. The results were shown in Table 2.
| Parameters | SIT | SIM |
|---|---|---|
| Retention time (min) | 4.3 | 30.4 |
| LOD (ng/ml) | 0.829 | 2.509 |
| LOQ (ng/ml) | 0.2707 | 0.820 |
| Linearity (µg/ml) | 20-150 | 8-60 |
| Linearity (coefficient) | 0.9998 | 0.9993 |
| Precision (interday RSD (%)) | 0.27 | 0.28 |
| Assay (percentage) | 100.1 | 96.5 |
| Robustness (flow rate) | ||
| 0.9 ml | 99.8% | 98.7% |
| 1.1 ml | 101.2% | 101.8% |
| Robustness (% organic) | ||
| 68:32 | 98.3% | 102.1% |
| 72:28 | 98.9% | 98.3% |
| Robustness (pH) | ||
| 3.1 | 98.4% | 101.4% |
| 2.9 | 99.8% | 102.6% |
| System suitability | ||
| Theoretical plates | 6882 | 12311 |
| Repeatability (RSD) | 0.54% | 0.61% |
| Asymmetry | 1.166 | 0.996 |
| Tailing factor | 1.11 | 1.24 |
| Resolution | - | 17.5 |
Table 2: Summary Of Validation Parameters
Precision
The intermediate precision was studied by three replicate measurements of concentration of SIT and SIM by interday measurements. The repeatability of the method was done by intraday analysis. Three levels of concentrations used in the study were 20, 50 and 150 μg/ml for SIT and 8, 20 and 60 μg/ml of SIM.The result was interpreted as % RSD and presented in Table 3.
| Concentration (µg/ml) | Sitagliptin mean ± SD (n=3) | RSD (%) | Simvastatin mean ± SD (n=3) | RSD (%) | |
|---|---|---|---|---|---|
| SIT | SIM | ||||
| 20 | 8 | 795721 ± 215.5 | 0.2708 | 113070 ± 317.55 | 0.2808 |
| 50 | 20 | 201146 ± 60.9 | 0.0302 | 155618 ± 316.70 | 0.2034 |
| 150 | 60 | 609113 ± 144.2 | 0.0236 | 943057 ± 100.01 | 0.1060 |
Table 3: Precision (Area) Of The Method
Limits of detection and quantitation
The limit of detection (LOD) and limit of quantitation (LOQ) for the procedure were calculated based on standard deviation formula as outlined in ICH guidelines and was presented in Table 2.
Robustness
The robustness of the method was evaluated by varying the HPLC pump flow rate (±0.1 ml/min), organic solvent content (±2% v/v) and pH (±0.1 unit). Robustness was assessed based on the significant change in peak area (RSD%) and % assay of SIT and SIM when compared to optimized conditions. Results were presented in Table 3.
System suitability
It is defined as tests to measure the method that can generate result of acceptable accuracy and precision. System suitability was carried out after the method development and validation have been completed. For this, parameters like retention time (tR), plate number (n), tailing factor (TF), peak asymmetry and resolution (Rs) of samples were measured, and shown in Table 2.
Forced degradation studies of sitagliptin and simvastatin
With an objective to find out the degradation products, which in turn help in the establishment of degradation pathways and the intrinsic stability of drug molecule, stress degradation studies were carried out by using acidic, basic, oxidative, photo, thermal and neutral stress conditions. All stress studies were carried out at 1000 μg/ml of each drug and were analyzed periodically at 50 μg/ml for both SIT and SIM. The periodic time intervals are decided based on the drug sensitivity for stress where as the duration stress study was limited to 5-10% degradation and care was taken to avoid drastic degradation. The stress was continued till the degradation reached to 5-10%. Number of degradation products and % degradation for each condition was identified based on comparison of respective stress chromatogram with blank and zero hour chromatogram.
Acid degradation studies
Acid decomposition studies were carried out in 0.1N HCl at room temperature for a period of 3 h. Ten milligrams of each SIT and SIM was weighed and transferred to a 10 ml standard volumetric flasks. Drugs dissolved by adding few ml of methanol and made up with 0.1N HCl to get final conc. of 1000 μg/ml. From above solution 0.5 ml mixture of SIT and SIM solution was drawn periodically in to a separate 10 ml standard flasks and made up to the volume with mobile phase get the conc. of 50 μg/ml of each drug (pH was adjusted to 4.5 with ammonia). The final solution was injected in the optimized conditions. Chromatograms are shown in fig. 1a and 1b.
Alkaline degradation studies
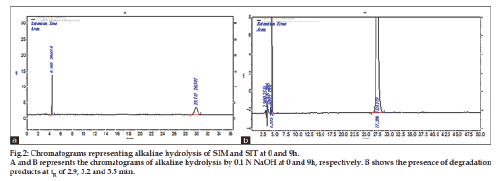
Alkaline decomposition studies were carried in 0.1N NaOH at room temperature for a period of 9 h. The same above procedure was carried out for alkaline hydrolysis. In this study, solution was drawn at time periods of 0, 1, 3, 6 and 9 h and pH adjustment was done to 4.5 using OPA. Chromatograms are shown in fig. 2a and 2b.
Oxidative degradation studies
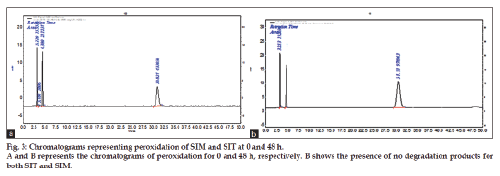
The oxidative stress studies were done in 0.3% H2O2 at room temperature for 48 h then the study was extended with increase in strength of hydrogen peroxide to 3%. Ten milligrams of each standard SIT and SIM was weighed and transferred to a 10 ml standard volumetric flask. The drug was dissolved by adding few ml of methanol and make up with 3% H2O2 to get final concentration of 1000 μg/ml. From above solutions 0.5 ml mixture of SIT and SIM solution was drawn into separate 10 ml standard flasks and made up to the volume with mobile phase get the concentration of 50 μg/ml of each drug. From this solution 2 ml of drug solution was drawn at time periods of 0, 1, 3, 6, 9, 12, 24 and 48 h. The results are tabulated in Table 4 and chromatograms were shown in fig. 3a and 3b. No degradation product was found even after 3 days.
| Stress condition | Retention time (tR) of degradation products | Total % of degradation | ||||||||||
|---|---|---|---|---|---|---|---|---|---|---|---|---|
| 3.12 ± 0.2 | 3.35 ± 0.2 | 3.6 ± 0.2 | 4.72 ± 0.2 | 5.37 ± 0.2 | 27.0 ± 0.2 | 36.9 ± 0.2 | 2.92 ± 0.2 | SIT | SIM | |||
| 0.1N HCl (3 h) | Yes | Yes | Yes | Yes | Yes | Yes | Yes | Yes | 6.42 | 60.19 | ||
| 0.1N NaOH (3 h) | - | Yes | Yes | - | - | - | - | Yes | 35.02 | 2.06 | ||
| 3% H2O2 (3 h) | - | - | - | - | - | - | - | - | - | - | ||
| Thermal (9 h) | Yes | Yes | Yes | Yes | Yes | Yes | Yes | - | 8.31 | 4.90 | ||
| Photolytic (48 h) | Yes | Yes | Yes | - | Yes | Yes | Yes | - | 1.72 | 20.04 | ||
| Neutral (48 h) | Yes | Yes | - | - | Yes | Yes | Yes | - | 11.44 | 2.32 | ||
Thermal degradation studies
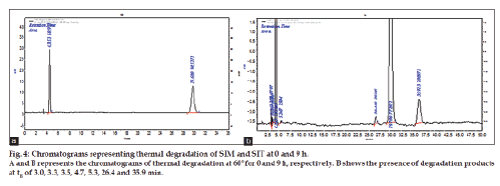
A thermal degradation study was carried by exposing the solid sample to 60° for 9h in hot air oven. Periodically, 10 mg of each standard SIT and SIM was weighed and transferred to a separate 10 ml standard volumetric flasks. The drug was dissolved by adding few ml of methanol and make up to get final concentration of 1000 μg/ml. From above solutions 0.5 ml mixture of SIT and SIM solution was drawn in to 10 ml standard flasks and made up to the volume with mobile phase get the concentration of 50 μg/ ml. The study was carried out at 0, 3, 6, and 9 h, time intervals. The results were shown in Table 4 and chromatograms were shown in fig. 4a and 4b.
Photolytic degradation studies
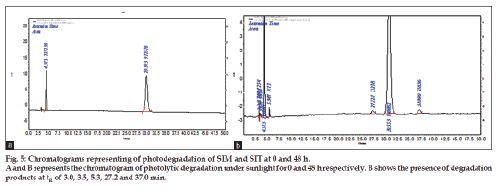
Photo stability degradation studies were carried out by keeping solid drug samples in sun light for a period of 48 h. This study was designed based on the concept that 4 h of hot sunny light is equal to 1.2 million lux h. The procedure adopted was similar to thermal degradation studies. The time interval followed was 0, 4, 8, 12, 24 and 48 h. The percentage content of degraded drug was determined based on zero hour chromatogram. The results are tabulated and shown in Table 4 and fig. 5a and 5b.
Neutral condition
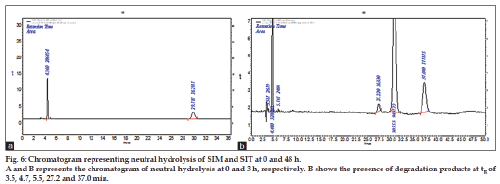
This study was carried out as solution state stability studies at pH of 6.5-7.5. Ten milligrams of each SIT and SIM was weighed and transferred to a separate 10 ml standard volumetric flasks. The drug was dissolved by adding few milliliters of methanol and make up to get final concentration of 1000 μg/ml. From above stock solutions 0.5 ml mixture of SIT and SIM solution was drawn in to separate 10 ml standard flasks and made up to the volume with mobile phase get the concentration of 50 μg/ml of each drug was prepared separately at 0, 24 and 48 h time intervals and made to the final volume with mobile phase and injected. From the peak areas in the chromatogram of stress degraded samples. The results are tabulated and shown in Table 4 and fig. 6.
Results and Discussion
In this study, separation of SIT and SIM were done on C8 column in order to reduce the retention time of SIM, because at the required retention time of SIT, the SIM retention may be more on C18 column. Optimization of mobile phase composition was performed based on resolutions among drugs and degradation products, asymmetric factor and theoretical plates. The mobile phase consisted of methanol and water in ratio of 70:30(0.2% HSA is added to water and pH was adjusted to 3.0 with OPA) was selected to give sharp and well-resolved peaks for SIT and SIM. The retention times for SIT and SIM were 4.3±0.2 and 30.5±0.3 min, respectively. UV overlaid spectra of SIT and SIM showed that the both the drugs absorbed appreciably at 253 nm, so the same wavelength was selected as the detection wavelength during degradation studies.
The optimized method was validated as per ICH Q2 guidelines. The method was specific in presence of degradation products as shown in figs. 1 to 6. The linearity was proven by calibration curves and it found to be linear over the range of 20-150 μg/ml for SIT and 8-60 μg/ml for SIM. The data of correlation coefficient (r2 value) for SIT and SIM were 0.9998 and 0.9993, respectively. The intermediate precision was tested by interday precision and was found to less than 1.5% against the acceptance limit of 2%. The low RSD (%) value indicated that the method is more precise. The recovery studies for accuracy were tested at three different levels (80, 100 and 120%) and their results were in between 98-102%, thus the accuracy of the method was proven. The detection limits (LOD) for SIT and SIM were 0.829 ng/ml and 0.2709 ng/ml, respectively, while quantitation limits (LOQ) was 2.509 and 0.82 ng/ml respectively. The lowest LOD value indicated the method is more sensitive. The validation parameters and the system suitability test parameters are shown in Table 2. Robustness of the method was studied by changing the flow rate of the mobile phase from 1 ml/min to 0.9 ml/min and 1.1 ml/min and pH change of ±0.1 units. The mobile phase composition was changed to 72:28, by increasing the percentage of methanol, the retention time for SIT and SIM were observed to be 4.1 min and 28.3 min, respectively. The corresponding assay value for all robust condition was between 98-102% against the Assay value of optimized conditions. Solution stability study was done as a part neutral degradation study and the results revealed that SIT and SIM were stable in solution up to 24 h.
The method has fulfilled for all validation parameters as per ICH guidelines. Forced degradation study was carried out by subjecting both drugs to acid and alkali hydrolysis, chemical oxidation, photolytic and thermal degradations. Acid hydrolysis showed that SIT gave five degradation products at retention time viz. 2.8, 3.24, 3.6, 4.7, 5.3 min, and two degradation products for SIM at retention time 27.0, 36.7 min, respectively (fig. 1). The chromatogram of base degraded sample showed degradation product peaks at retention time 2.9, 3.3, 3.9 min for SIM, whereas SIT was found to be stable to base degradation (fig. 2). Both drugs showed no degraded products for chemical oxidation and were stable to hydrogen peroxide even at 3% concentration (fig. 3) for 48 h exposure. In thermal and photolytic stress conditions drugs showed degraded peaks at retention time 3.1, 3.3, 3.6, 4.7, 5.3 min for SIT and two degradants at 27.2, 37.0 min for SIM (figs. 5 and 6). The study thereby indicated that both drugs are susceptible to acid, base, thermal, photolytic and neutral stress conditions but, are stable to chemical oxidation.
The degradation product for SIT has similar retention behavior that of SIT, so the separation among impurity has not taken place, however efforts have been made to separate SIT from their impurity. Both the drugs were resistant to oxidation but susceptible to photolytic degradation. This method can be conveniently used to detect the possible degradation product in the combined dosage form of SIT and SIM, during stability studies.
Aknowledgements
The authors thank Merck and Co., India for providing sitagliptin and simvastatin as gift sample for this work. This work was carried out at the analytical research laboratory of Raghavendra Institute of Pharmaceutical Education and Research, Andhra Pradesh, India.
References
- Ghazala K, Dinesh S, Agrawal YP, Neetu S, Avnish J, Gupta AK. Simultaneous estimation of metformin and sitagliptin in tablet dosage form. Asian J Biochem Pham Res 2011;2:223-9.
- Herman GA, Stevens C, Van Dyck K, Bergman A, Yi B, De Smet M, et al. Pharmacokinetics and pharmacodynamics of sitagliptin, an inhibitor of dipeptidyl peptidase IV, in healthy subjects: Results from two randomized, double-blind, placebo-controlled studies with single oral doses. Clin Pharmacol Ther 2005;78:675-88.
- El-Bagary RI, Elkady EF, Ayoub BM. Spectroflourometric and Spectrophotometric Methods for the Determination of sitagliptin in binary mixture with metformin and ternary mixture with metformin and sitagliptin Alkaline Degradation Product. Int J Biomed Sci 2011;7:62-9.
- Jain P, Chaudhary A, Desai B, Patel S, Patel S, Shimpi H. Development and validation of first order derivative UV Spectrophotometric method for determination of Sitagliptin in bulk and in Formulation. Int J Drug Dev Res 2011;3:194-9.
- Srivastava B, Akhtar J, Baghel US. Simultaneous estimation of ezetimibe and simvastatin by Vierodt’s method. Inter J Pharm Life Sci 2010;1:105-8.
- Bala Sekaran C, Prameela Rani A. Development and validation of Spectrophotometric Method for the Determination of DPP4 Inhibitor Sitagliptin, in its Pharmaceutical Dosage Forms. Int J Pharm Sci 2010;2:138-42.
- Shyamala M, Mohideen S, Satyanarayana T, Narasimha Raju CH, Suresh Kumar P, Swetha K. Validated RP-HPLC for simultaneous estimation of sitagliptin phosphate and metformin hydrochloride in tablet dosage form. Am J Pharm Tech Res 2011;1:193-101.
- Chellu SN, Malleswararao M, Suryanarayana V. Simultaneous determination of sitagliptin phosphate monohydrate and metformin hydrochloride in tablets by a validated UPLC Method. Sci Pharm 2012;80:139-52.
- Swales JG, Gallagher RT, Denn M, Peter RM. Simultaneous quantitation of metformin and sitagliptin from mouse and human dried blood spots using laser diode thermal desorption tandem mass spectrometry. J Pharm Biomed Anal 2011;55:554-51.
- Zeng W, Musson DG, Fisher AL, Michael LS, Schwartz, JS, Wang AQ. Determination of sitagliptin in human urine and hemodialysate using turbulent flow online extraction and tandem mass spectrometry. J Pharm Biomed Anal 2008;46:534-42.
- Sohajda T, Hui WH, Zeng LL, Li H, Szente L, Noszal B, et al. Evaluation of the interaction between sitagliptin and cyclodextrin derivatives by capillary electrophoresis and nuclear magnetic resonance spectroscopy. Electrophoresis 2011;32:2648-54.
- Sharma BP, Kourav N, Attar A. Development and Validated UV Spectrophotometric and RP-HPLC methods for the estimation of simvastatin and ezetimibe in combined pharmaceutical dosage form. Cur Trends Tech Sci 2010;1:135-42.
- Chaudhari BG, Patel NM, Shah PB. Stability-indicating reversed phase liquid chromatographic method for simultaneous determination of simvastatin and ezetimibe from their combination drug products. J AOAC Int 2007;90:1242-9.
- Rahman M, Parveen G, Nyola NK, Khan S, Sushma TM, Shahar I, et al. Simultaneous estimation of simvastatin and ezetimibe in pharmaceutical tablet dosage forms by RP-HPLC: A Review. Int J Pharm Res Dev 2010;2:56-62.
- Rathinaraj S, Rajamanickam, Mazarin J, Fiedlis P, AshikElahi AL, Rajveer CH, et al. Development and validation of analytical methods for simultaneous estimation of simvastatin and ezetimibe in combined dosage form. J Adv Pharm Res 2010;1:133-9.
- Anantha Kumar D, Sujan DP, Vijayasree V, Rao SJ. Simultaneous determination of simvastatin and ezetimibe in tablets by HPLC. Eur J Chem 2009;6:541-4.
- Wang L, Asgharnejad M. Second derivative UV Spectrometric Determination of simvastatin in its tablet dosage form. J Pharm Biomed Anal 2000;21:1243-8.
- Patel TR, Patel TB, Suhagia BN. Stability indicating RP-HPLC method for simultaneous estimation of simvastatin and sitagliptin in tablet dosage form. Indo Am J Pharm Res 2014;4:1993-9.
- International Conference on Harmonization (ICH). Tripartite guidelines, ICH Q2A: Text on Validation of Analytical Procedures. March 1995.
