- *Corresponding Author:
- Q. Zhang
Department of Clinical Laboratory, Tianjin Dongli Hospital, Dongli, Tianjin 300300,China
E-mail: zhangqiang_tj@hotmail.com
| This article was originally published in a special issue, “New Research Outcomes in Drug and Health Sciences” |
| Indian J Pharm Sci 2023:85(6) Spl Issue “32-40” |
This is an open access article distributed under the terms of the Creative Commons Attribution-NonCommercial-ShareAlike 3.0 License, which allows others to remix, tweak, and build upon the work non-commercially, as long as the author is credited and the new creations are licensed under the identical terms
Abstract
Oral squamous cell carcinoma is a common malignancy with high mortality rate. Hence, early diagnosis of oral squamous cell carcinoma is crucial for preventing the development of the disorder. The cetuximab has been testified in oral squamous cell carcinoma patients, while the accurate targeting is still uncertain. Herein, differential expression analysis was performed using limma package of R. Overlapped differentially expressed genes both in oral pathogens infected gingival cells and oral squamous cell carcinoma samples were identified via cross analysis. The potential target genes of cetuximab administration were also established. Several immune-associated pathways, such as cytokine-cytokine receptor interactions, were identified to be significantly perturbed during the development of oral squamous cell carcinoma. A total of six genes including C-X-C motif chemokine ligand 1, C-X-C motif chemokine ligand 8, NUAK family kinase 2, thioredoxininteracting protein, spectrin repeat containing nuclear envelope protein 1 and long intergenic non-protein coding RNA 474 were screened to be potentially involved in the development of oral squamous cell carcinoma. A logistic regression model was constructed based on NUAK family kinase 2, C-X-C motif chemokine ligand 1 and thioredoxin-interacting protein, and the receiver operating characteristic curves indicated that the logistic regression diagnostic model could reliably separate oral tumor samples from normal samples. We construct a logistic regression diagnostic model based on three key genes, NUAK family kinase 2, C-X-C motif chemokine ligand 1 and thioredoxin-interacting protein, which is probably conducive to the early diagnosis of oral squamous cell carcinoma.
Keywords
Oral squamous cell carcinoma, differentially expression analysis, gene ontology, Kyoto encyclopedia of genes and genomes enrichment analysis, gene expression omnibus database, logistic regression analysis
Oral Squamous Cell Carcinoma (OSCC) is the most common malignancy of the oral cavity around the world. The disorder is closely associated with a variety of substantial risk factors including tobacco products, alcohol, betel quid, areca nut, as well as genetic alteration[1]. According to the most recent GLOBOCAN report in Europe between 2012 and 2015, more than 300 000 patients are diagnosed with OSCC annually, which is considered as one of the top 10 most common cancers worldwide[2]. Moreover, there was an overall increasing incidence and mortality for OSCC, mostly Human Papillomavirus (HPV)-related in the oropharyngeal region[3]. Therefore, early detection is more crucial for preventing the OSCC and improving oral health. OSCC demonstrates a typical symptom including a non-healing mouth sore or ulcer. Occasionally, OSCC could be diagnosed at an early stage due to the patient’s self-identification of the mass lesion and symptoms that interfere with the fundamental functions of eating and speaking, such as pain with chewing or dysarthria[4]. However, these parameters are only determined by the dentist and might be hysteretic. Therefore, to establish a simple and effective screening method for OSCC, the identification of specific and sensitive diagnostic signature is important and urgent.
Over the last decades, gene diagnosis is becoming a new potential method for screening multiple human diseases[5,6]. For example, C-X-C Motif Chemokine Ligand 1 (CXCL1) has been evidenced to play a vital role in cancer and some other human diseases[7,8]. Besides, NUAK Family Kinase 2 (NUAK2) has been reported to act as an oncogene in melanoma[9]. However, the diagnostic research in OSCC is limited and there are only few potential diagnostic biomarkers for the disorder. For instance, Chang et al. have revealed that via a two-stage comprehensive evaluation, Nucleophosmin (NPM), Cyclin-Dependent Kinase 1 (CDK1) and N-myc Downstream Regulated 1 (NDRG1) were overexpressed in OSCC samples, while Checkpoint Suppressor 1 (CHES1) was underexpressed[10]. In another study, Peroxiredoxin-2 (PRDX-2) and Zinc-Alpha-2-Glycoprotein (ZAG) were proved to be upregulated which involves in the risk of OSCC and is considered as a promising biomarker[11]. Despite there are several previous studies exploring the diagnostic biomarkers for the disease, more effective and specific signatures for the diagnosis of OSCC are still urgently needed.
Cetuximab is considered as a monoclonal antibody which binds to the Epidermal Growth Factor Receptor (EGFR) and plays a pivotal role in the progression of several cancers types. In February 2004, it has granted accelerated approval by the United States Food and Drug Administration (USFDA) for the treatment of metastatic colorectal cancer on the basis of tumour response rates in Phase II trials. Since then, cetuximab has been testified in other cancers. However, the potential targets of cetuximab are still poorly understood. In present study, via analyzing the expression data of OSCC, as well as the expression data of tumor tissues, we revealed the Differentially Expressed Genes (DEGs) which might play important roles during the development of the disorder and cetuximab treatment. A logistic regression diagnostic model was finally constructed based on three key genes. Our predictive diagnostic signature for OSCC is a promising alternative in the early detection and providing more reference information.
Materials and Methods
Data collection:
The expression profile GSE12121 was downloaded from the Gene Expression Omnibus (GEO, https://www.ncbi.nlm.nih.gov/geo/) database.
The dataset was used for DEGs. Consequently, no ethical approval was needed. In addition, the dataset of GSE109756 was also obtained from the GEO database. The dataset includes 19 samples before cetuximab and 15 samples after treatment for Head and Neck Squamous Cell Carcinoma (HNSCC) patients. Overall, 14 samples before cetuximab treatment and 10 samples after cetuximab treatment for OSCC were selected in the study. The expression data in all samples was detected by Affymetrix Human Genome U133 plus 2.0 array.
Differential expression analysis:
The probes of messenger Ribonucleic Acid (mRNA) expression profiles with missing value were removed and then standardized by using the Robust Multi-Array (RMA) method. Subsequently, the differential expression analysis was performed by using the limma function package of R language[12]. Of which, |log2 (Fold Change [FC])|>1 and False Discovery Rate (FDR)<0.05 were used as the significant threshold to screen DEGs.
Functional enrichment analysis:
To analyze the key pathways involved in the development of OSCC, Gene Ontology (GO) (including Biological Process (BP), Molecular Function (MF) and Cellular Component (CC)) and Kyoto Encyclopedia of Genes and Genomes (KEGG) pathway enrichment analyses were carried out by using the clusterProfiler function of R language[13] and p<0.05 was regarded as the significant threshold.
The construction of logistic regression model:
Logistic regression analysis is commonly used for classification, that is, to predict a classification result by bringing into a series of variables. In our study, the expression values of selected mRNAs were used as variables to perform the logistic regression analysis to predict the sample type (disease or not). All samples used in this study were divided into normal control samples and OSCC samples, and a multivariate logistic regression model was established by using the Generalized Linear Model (GLM) function of R language. Among which, the expression values of selected mRNAs were used as continuous predictive variable and sample type was considered as classified response value.
Statistical analysis:
Statistical analysis was performed with R software v 3.5.2, where p<0.05 was considered as the significant threshold.
Results and Discussion
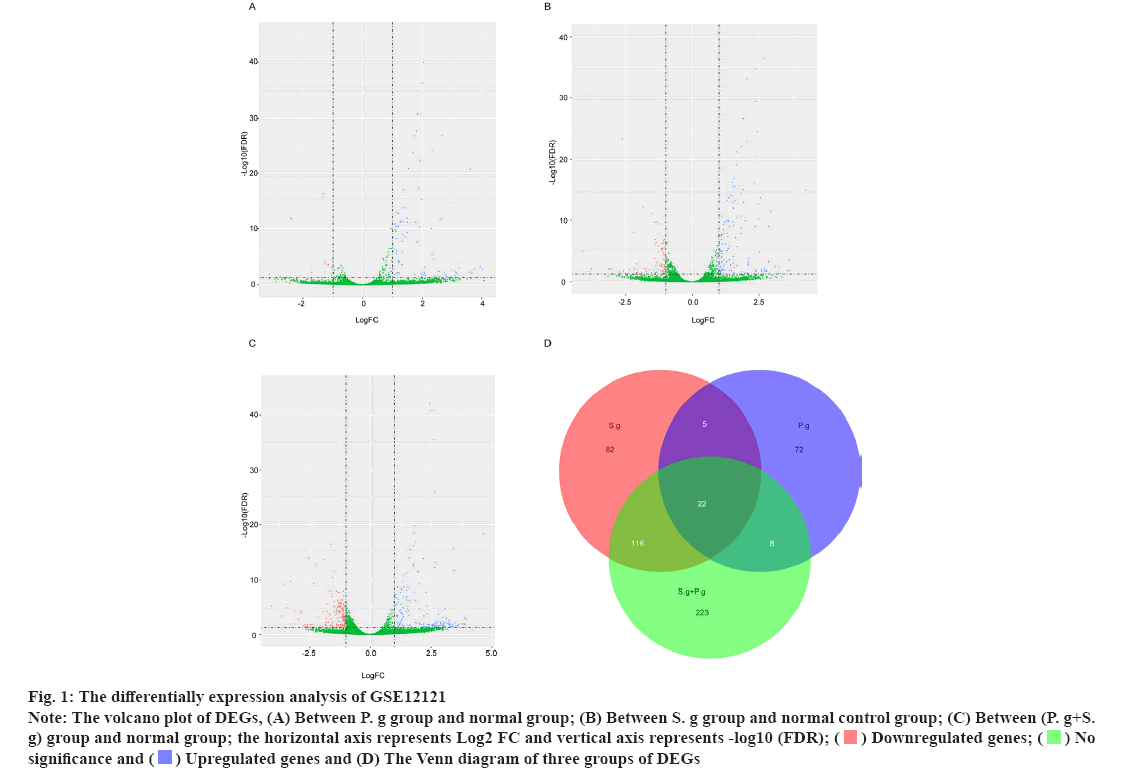
The differential expression analysis of GSE12121 on identified pathogen infected genes was shown in fig. 1. Streptococcus gordonii (S. g) and Porphyromonas gingivalis (P. g) are important and common pathogens which can lead to the oral infection. In this study, the differential expression analysis was performed in GSE12121 dataset with three matched groups including P. g treated group vs. untreated group, S. g treated group vs. untreated group and (P. g+S. g) treated group vs. untreated group. The results of differential expression analysis suggested that there were 107 DEGs in P. g treated group compared with untreated group (fig. 1A); there were 225 DEGs in S. g treated group compared with untreated group (fig. 1B); and there were 369 DEGs in (P. g+S. g) treated group compared with untreated group (fig. 1C). Moreover, we found that there were 22 DEGs simultaneously existing in three groups of differentially expression analysis results (19 upregulated genes and 3 downregulated genes) (fig. 1D) as shown in Table 1. These results suggested that those 22 genes were potentially involved in the progression of pathogen-caused OSCC.
Fig 1: The differentially expression analysis of GSE12121
Note: The volcano plot of DEGs, (A) Between P. g group and normal group; (B) Between S. g group and normal control group; (C) Between (P. g+S. g) group and normal group; the horizontal axis represents Log2 FC and vertical axis represents -log10 (FDR);

| Type | Gene symbol |
|---|---|
| Upregulated genes | ARRDC3 |
| KLF6 | |
| GADD45A | |
| CXCL8 | |
| NUAK2 | |
| ID3 | |
| SGK1 | |
| NFKBIZ | |
| DUSP1 | |
| GADD45B | |
| CXCL1 | |
| ZFP36 | |
| DUSP10 | |
| WEE1 | |
| MYL12A | |
| RBSN | |
| LINC00474 | |
| SOCS3 | |
| ZNF444 | |
| Downregulated genes | GLIPR1 |
| TXNIP | |
| SYNE1 |
Table 1: Overlapping Genes in Bacterial Infection Data Set (GSE12121)
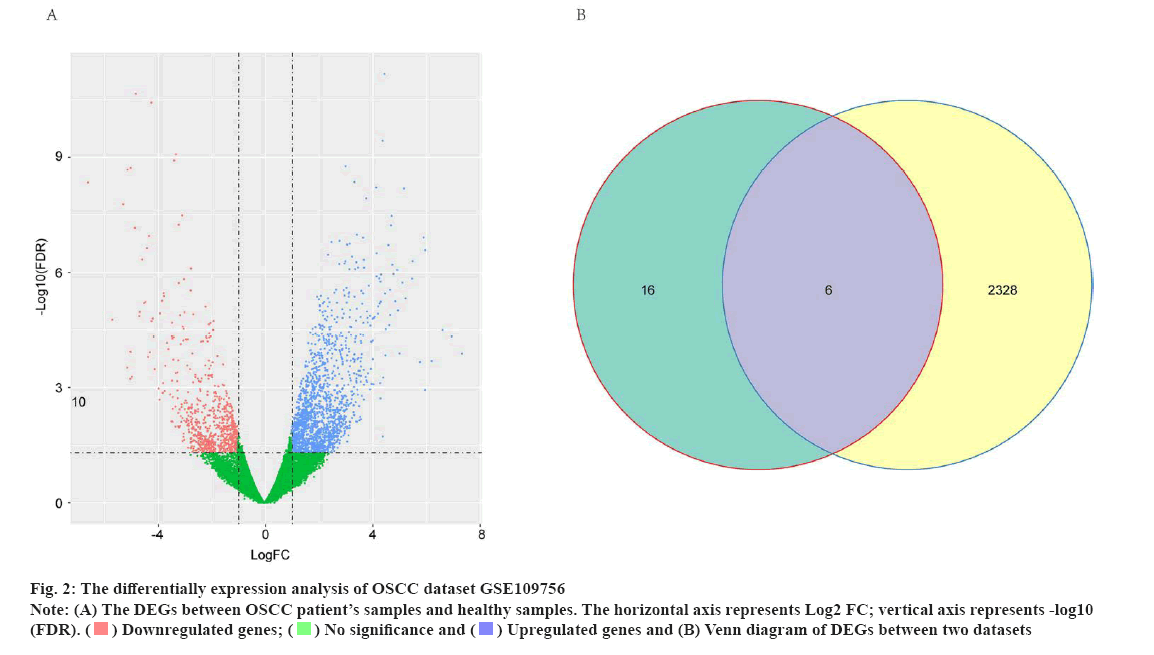
The differential expression analysis identified potential OSCC-related genes for cetuximab treatment was shown in fig. 2. To explore the potential targets of cetuximab treatment in OSCC patients, the dataset of GSE109756 was established. In this dataset, 14 samples before cetuximab and 10 samples after treatment with OSCC were selected for the study. The potential targets of cetuximab for OSCC were confirmed based on the comparision between 14 samples before cetuximab and 10 samples after treatment. In conclusion, the results identified 2334 DEGs in OSCC tumor tissues after treatment compared with individuals before cetuximab treatment (701 downregulated genes and 1633 upregulated genes) (fig. 2A). Subsequently, the Venn diagram revealed that there were six genes including CXCL1, C-X-C Motif Chemokine Ligand 8 (CXCL8), NUAK2, Thioredoxin-Interacting Protein (TXNIP), Spectrin Repeat Containing Nuclear Envelope Protein 1 (SYNE1) and Long Intergenic Non-Protein Coding RNA 474 (LINC00474) were intersecting between the 2234 DEGs in GSE109756 and the 22 overlapped DEGs in GSE12121 (fig. 2B). These results suggested that these six genes were potentially key genes for cetuximab treatment in OSCC patients.
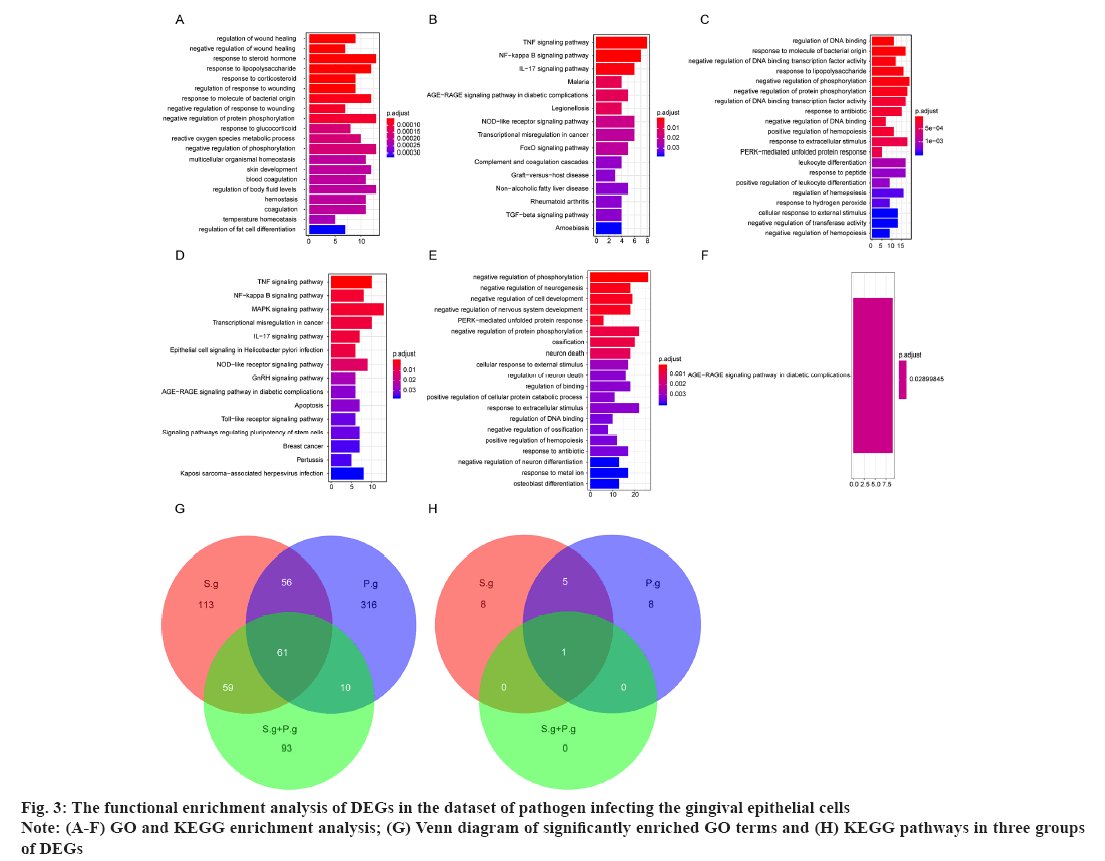
The functional enrichment analysis of DEGs in the dataset of pathogen infecting the gingival epithelial cells was shown in fig. 3. For DEGs of samples, GO term and KEGG enrichment analyses were conducted to explore the key terms closely involved in the development of pathogen-caused OSCC. For the 107 DEGs in P. g group, there were 444 significantly enriched GO terms including regulation of wound healing, negative regulation of wound healing and response to steroid hormone, and top 20 significantly enriched GO terms was shown in fig. 3A, as well as 15 significantly enriched KEGG pathways including Nuclear Factor (NF) signaling pathway, Nuclear Factor kappa B (NF-κB) signaling pathway and Interleukin-17 (IL-17) signaling pathway (fig. 3B). For the 225 DEGs in S. g group, there were 289 significantly enriched GO terms including regulation of Deoxyribonucleic Acid (DNA) binding, response to molecule of bacterial origin and response to Lipopolysaccharide (LPS) and top 20 significantly enriched GO terms were shown in fig. 3C, as well as DEGs15 significantly enriched KEGG pathways including Tumour Necrosis Factor (TNF) signaling pathway, NF-κB signaling pathway and Mitogen-Activated Protein Kinase (MAPK) signaling pathway (fig. 3D). For the 369 DEGs in (P. g+S. g) group, there were 223 significantly enriched GO terms such as negative regulation of phosphorylation, negative regulation of neurogenesis and negative regulation of cell development, where top 20 significantly enriched GO terms were shown in fig. 3E, as well as one significantly enriched KEGG pathway, Advanced Glycation Endproducts-Receptor for Advanced Glycation Endproducts (AGE-RAGE) signaling pathway in diabetic complications and only one KEGG pathway was shown in fig. 3F. Meanwhile, the Venn diagram showed that there were 61 GO terms and 1 KEGG pathway simultaneously existing in three groups of enrichment results (fig. 3G and fig. 3H), suggesting that these overlapped GO terms and KEGG pathways should be closely involved in the occurrence and development of pathogen infection-caused OSCC.
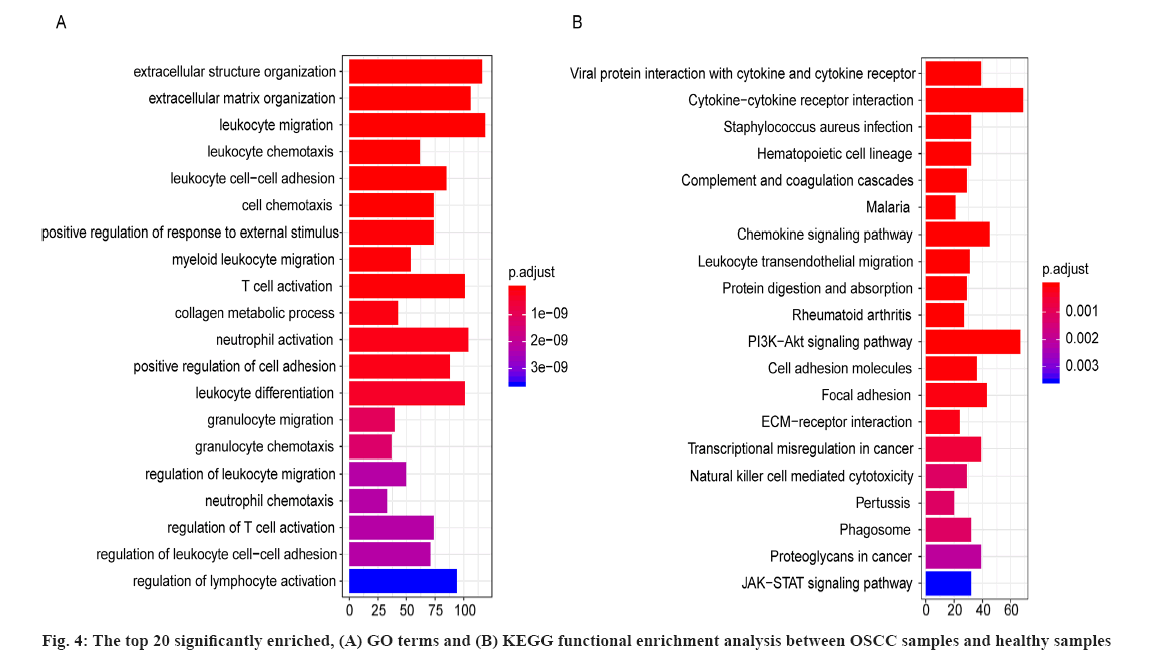
For the 2334 DEGs between OSCC samples and healthy samples in GSE109756, there were 672 significantly enriched GO terms including extracellular structure organization, extracellular matrix organization and leukocyte migration. The top 20 significantly enriched GO terms between OSCC samples and healthy periodontal samples were shown in fig. 4A, where the horizontal axis represents the number of enriched genes and vertical axis represents the names of the individual GO terms.
As well as 42 significantly enriched KEGG pathways including viral protein interaction with cytokine and cytokine receptor and cytokine-cytokine receptor interaction and the top 20 significantly enriched KEGG pathways between OSCC samples and healthy samples were shown in fig. 4B and the horizontal axis represents the number of genes and vertical axis represents the KEGG pathway. These results suggested the significantly enriched GO terms and KEGG pathways were potentially associated with the onset and development of OSCC.
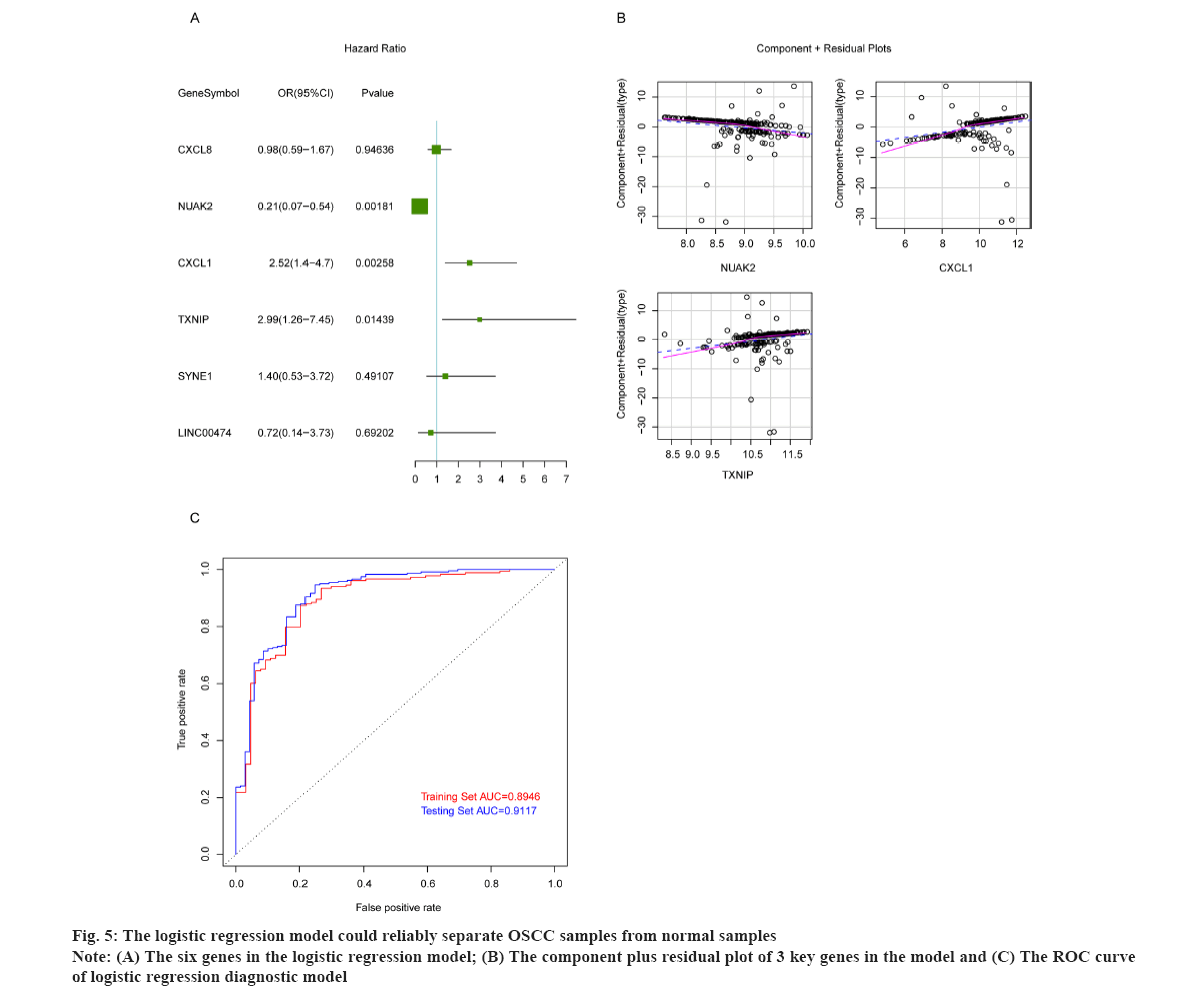
The logistic regression model could reliably separate OSCC samples from normal samples as shown in fig. 5. To build the logistic regression model with strong interpretation and few mRNAs as possible, the six overlapped genes were adopted in multivariate logistic analysis, and the results showed that the p values of NUAK2, CXCL1 and TXNIP were less than 0.05 (fig. 5A). Then we constructed the logistic regression model by bringing into these three optimal genes and the results indicated that the re-constructed model confirmed the normal distribution, the independent variables existing in the model showed a good linear relationship with the response variables. The component plus residual plot of 3 key genes in the model was shown in fig. 5B. The obvious linear relationship between the horizontal axis and the vertical axis indicates that the independent variables are suitable to be brought in the model. In addition, there was no extreme point that obviously affected the accuracy of the model. Subsequently, GSE186775 dataset was taken as the training set and GSE196688 dataset as the validation set to verify the accuracy of the model and the Receiver Operating Characteristic (ROS) curves showed that the Area Under the Curve (AUC) values of the model in the training set and validation set were 0.8946 and 0.9117, respectively (fig. 5C). The horizontal axis represents False Positive Rate (FPR) and the vertical axis is True Positive Rate (TPR). The AUC value can intuitively evaluate the quality of the model, the larger the AUC value from 0 to 1, the better the model. The above results indicated that the logistic regression model was established based on NUAK2, CXCL1 and TXNIP could reliably predict the type of samples, i.e. OSCC or normal.
OSCC is a multifactorial disease, closely relating to environmental factors, genetic factors and systemic diseases[1]. Owing to the mild and unspecific initial symptoms, it’s hard to diagnose the disorder, whereas, the treatment effects will be poor once the disease progresses. Additionally, it is increasingly essential for many diseases to apply the biomarkers at an early stage in clinical cases around the world[14]. In present study, we analyzed the expression profiles between OSCC samples and normal samples, and a large number of DEGs involving in the onset and development of the disease have been identified. Moreover, based on three crucial hub genes, we constructed a predictive diagnostic logistic regression model, which was verified to be relatively reliable.
A significant number of studies have shown that microorganisms play an important role in carcinogenesis. Not only bacterial species like Streptococcus[15], Neisseria[16] and Fusobacterium[17], but also viral and fungal species like Epstein-Barr Virus (EBV)[18], HPV[3] and Candida[19] were increasingly evidenced to involve in the onset (directly or indirectly) of OSCC. Some periodontal pathogens were also involved in various pathways to assist in the development of OSCC. For example, volatile sulfur compounds produced by P. g, including hydrogen sulfide and methyl mercaptan, induce oxidative stress, inhibit enzyme superoxide dismutase and promote collagen (type IV) breakdown, ultimately leading to invasion of OSCC into basement membrane[20].
In this study, we explored the association between sole pathogen (S. g or P. g) or two pathogens (S. g and P. g) and OSCC by analyzing the expression profiles of the gingival epithelial cells infected by pathogens, aiming to identify effective targets for the diagnosis or treatment. Further, we found that there were 22 overlapped DEGs simultaneously existing in three groups (P. g infection, S. g infection, P. g+S. g infection). In addition, we also analyzed an expression profile of OSCC and found that totally 2334 genes were differentially expressed between tumor tissues and healthy tissues. Moreover, totally six genes, including CXCL1, CXCL8, NUAK2, TXNIP, SYNE1 and LINC00474, were simultaneously and differentially expressed in oral pathogens infecting gingival epithelial cells and OSCC progression. These results implied that the six genes were closely involved in the development of OSCC.
The oral community faces with a survival conundrum, evading immune-mediated killing and meanwhile require inflammation to procure nutrients from tissue breakdown[21]. Increasing evidences demonstrated that periodontal bacteria would affect the interaction with host immune responses to enhance bacterial fitness. These suggested that immune responses occur during the development of OSCC. Herein, after conducting GO term and KEGG pathway enrichment analysis based on those DEGs, a series of immune-related metabolic pathways were significantly enriched during OSCC progression such as TNF pathway, NF-κB pathway, IL-17 pathway, MAPK pathway, IL-17 pathway, Toll-like receptor pathway, Cytokine-cytokine receptor interaction, viral protein interaction with cytokine and cytokine receptor, and so on. These enrichment results suggested that our analysis confirmed previous conclusions that immune responses play an important role during the progression of OSCC.
In order to make our diagnostic model more reliable, six genes CXCL1, CXCL8, NUAK2, TXNIP, SYNE1 and LINC00474 were all brought into model. We found that NUAK2, CXCL1 and TXNIP contributed more to the model (p<0.05). Lian et al. have revealed that Reactive Oxygen Species (ROS)/TXNIP/NLR Family Pyrin Domain Containing 3 (NLRP3) inflammasome pathway is a crucial step necessary for P. g-LPS-induced inflammation response of cultured mouse Periodontal Ligament Fibroblasts (mPDLFs)[22]. CXCL1 was found to be highly expressed in human oral tumor tissues compared with normal samples and IL-10 mitigated the expressions of CXCL5 and CXCL1 in IL-17-stimulated peripheral blood monocytic cells and the derived macrophages[23,24]. Oxidative stress is the primary reason for age-related diseases. Hou et al. have illustrated that NUAK2 and other seven genes associated with oxidative stress were significantly upregulated in Hydrogen peroxide (H2O2)-induced Human Colorectal Adenocarcinoma Cells (Caco-2) cells compared with untreated cells[25]. These results suggested that NUAK2, CXCL1 and TXNIP were probably involved in the immune response during OSCC development. Then we constructed the final logistic regression model based on the three genes, meanwhile, two independent datasets (GSE186775 as the training dataset and GSE196688 as the validation dataset) were used to verify the accuracy of this model. The results determined that our diagnostic model could reliably separate OSCC samples from healthy subjects. Furthermore, considering the crucial diagnostic role and potentially pathogenic role, NUAK2, CXCL1 and TXNIP deserved more deepening investigation in OSCC in the near future.
Although our study suggested that NUAK2, CXCL1 and TXNIP might be associated with the occurrence of OSCC, their specific functions needed to be explored in detail. In addition, more and more samples should be collected for the further verification.
In summary, via integrated bioinformatic analyses, we have identified three crucial genes associated with the occurrence of OSCC, including NUAK2, CXCL1 and TXNIP. Based on these three hub genes, a reliable diagnostic model has been constructed to accurately separate OSCC samples from normal samples. Our findings are probably providing more alternatives for clinical diagnosis of the disorder in the future.
Funding:
This work was supported by National Research and Development Program of China (2021YFC2009300) and Tianjin Health Committee, Tianjin Administration of Traditional Chinese Medicine (2021189).
Author’s contributions:
Wantong Wu and Qiang Zhang have contributed equally to this work and share first authorship.
Conflict of interests:
The authors declared no conflict of interest.
References
- Chamoli A, Gosavi AS, Shirwadkar UP, Wangdale KV, Behera SK, Kurrey NK, et al. Overview of oral cavity squamous cell carcinoma: Risk factors, mechanisms and diagnostics. Oral Oncol 2021;121:105451.
[Crossref] [Google scholar] [PubMed]
- Vucicevic Boras V, Fucic A, Virag M, Gabric D, Blivajs I, Tomasovic-Loncaric C, et al. Significance of stroma in biology of oral squamous cell carcinoma. Tumori 2018;104(1):9-14.
[Crossref] [Google scholar] [PubMed]
- Panarese I, Aquino G, Ronchi A, Longo F, Montella M, Cozzolino I, et al. Oral and Oropharyngeal squamous cell carcinoma: Prognostic and predictive parameters in the etiopathogenetic route. Expert Rev Anticancer Ther 2019;19(2):105-19.
[Crossref] [Google scholar] [PubMed]
- Huang CC, Chen WM, Shia BC, Chen M, Wu SY. The effect of statin medication on the incidence of oral squamous cell carcinoma among betel‐nut chewers. Head Neck 2023;45(6):1455-67.
[Crossref] [Google scholar] [PubMed]
- Alyousfi D, Baralle D, Collins A. Gene-specific metrics to facilitate identification of disease genes for molecular diagnosis in patient genomes: A systematic review. Brief Funct Genomics 2019;18(1):23-9.
[Crossref] [Google scholar] [PubMed]
- Lebo RV, Tonk VS. Analyzing the most frequent disease loci in targeted patient categories optimizes disease gene identification and test accuracy worldwide. J Transl Med 2015;13(1):1-6.
[Crossref] [Google scholar] [PubMed]
- Wang N, Liu W, Zheng Y, Wang S, Yang B, Li M, et al. CXCL1 derived from tumor-associated macrophages promotes breast cancer metastasis via activating NF-κB/SOX4 signaling. Cell Death Dis 2018;9(9):880.
[Crossref] [Google scholar] [PubMed]
- Wang L, Zhang YL, Lin QY, Liu Y, Guan XM, Ma XL, et al. CXCL1-CXCR2 axis mediates angiotensin II-induced cardiac hypertrophy and remodelling through regulation of monocyte infiltration. Eur Heart J 2018;39(20):1818-31.
[Crossref] [Google scholar] [PubMed]
- Namiki T, Yaguchi T, Nakamura K, Valencia JC, Coelho SG, Yin L, et al. NUAK2 amplification coupled with PTEN deficiency promotes melanoma development via CDK activation. Cancer Res 2015;75(13):2708-15.
[Crossref] [Google scholar] [PubMed]
- Chang JT, Wang HM, Chang KW, Chen WH, Wen MC, Hsu YM, et al. Identification of differentially expressed genes in oral squamous cell carcinoma (OSCC): Overexpression of NPM, CDK1 and NDRG1 and underexpression of CHES1. Int J Cancer 2005;114(6):942-9.
[Crossref] [Google scholar] [PubMed]
- Heawchaiyaphum C, Pientong C, Phusingha P, Vatanasapt P, Promthet S, Daduang J, et al. Peroxiredoxin-2 and zinc-alpha-2-glycoprotein as potentially combined novel salivary biomarkers for early detection of oral squamous cell carcinoma using proteomic approaches. J Proteomics 2018;173:52-61.
[Crossref] [Google scholar] [PubMed]
- Ritchie ME, Phipson B, Wu DI, Hu Y, Law CW, Shi W, et al. Limma powers differential expression analyses for RNA-sequencing and microarray studies. Nucleic Acids Res 2015;43(7):e47.
[Crossref] [Google scholar] [PubMed]
- Yu G, Wang LG, Han Y, He QY. clusterProfiler: An R package for comparing biological themes among gene clusters. OMICS 2012;16(5):284-7.
[Crossref] [Google scholar] [PubMed]
- Zeidan-Chulia F, Gürsoy M, Neves de Oliveira BH, Özdemir V, Könönen E, Gürsoy UK. A systems biology approach to reveal putative host-derived biomarkers of periodontitis by network topology characterization of MMP-REDOX/NO and apoptosis integrated pathways. Front Cell Infect Microbiol 2016;5:102.
- Sami A, Elimairi I, Stanton C, Ross RP, Ryan CA. The role of the microbiome in oral squamous cell carcinoma with insight into the microbiome-treatment axis. Int J Mol Sci 2020;21(21):8061.
[Crossref] [Google scholar] [PubMed]
- Muto M, Hitomi Y, Ohtsu A, Shimada H, Kashiwase Y, Sasaki H, et al. Acetaldehyde production by non‐pathogenic Neisseria in human oral microflora: Implications for carcinogenesis in upper aerodigestive tract. Int J Cancer 2000;88(3):342-50.
[Crossref] [Google scholar] [PubMed]
- Gallimidi AB, Fischman S, Revach B, Bulvik R, Maliutina A, Rubinstein AM, et al. Periodontal pathogens Porphyromonas gingivalis and Fusobacterium nucleatum promote tumor progression in an oral-specific chemical carcinogenesis model. Oncotarget 2015;6(26):22613-23.
[Crossref] [Google scholar] [PubMed]
- Guidry JT, Birdwell CE, Scott RS. Epstein-Barr virus in the pathogenesis of oral cancers. Oral Dis 2018;24(4):497-508.
[Crossref] [Google scholar] [PubMed]
- Krom BP, Kidwai S, Ten Cate JM. Candida and other fungal species: Forgotten players of healthy oral microbiota. J Dent Res 2014;93(5):445-51.
[Crossref] [Google scholar] [PubMed]
- Muthusamy M, Ramani P, Krishnan RP, Hemashree K, Sukumaran G, Ramasubramanian A, et al. Oral microflora and its potential carcinogenic effect on oral squamous cell carcinoma: A systematic review and meta-analysis. Cureus 2023;15(1):e33560.
[Crossref] [Google scholar] [PubMed]
- Hajishengallis G. Periodontitis: From microbial immune subversion to systemic inflammation. Nat Rev Immunol 2015;15(1):30-44.
[Crossref] [Google scholar] [PubMed]
- Lian D, Dai L, Xie Z, Zhou X, Liu X, Zhang Y, et al. Periodontal ligament fibroblasts migration injury via ROS/TXNIP/Nlrp3 inflammasome pathway with Porphyromonasgingivalis lipopolysaccharide. Mol Immunol 2018;103:209-19.
[Crossref] [Google scholar] [PubMed]
- Rath-Deschner B, Memmert S, Damanaki A, Nokhbehsaim M, Eick S, Cirelli JA, et al. CXCL1, CCL2 and CCL5 modulation by microbial and biomechanical signals in periodontal cells and tissues-in vitro and in vivo studies. Clin Oral Investig 2020;24:3661-70.
[Crossref] [Google scholar] [PubMed]
- Sun L, Girnary M, Wang L, Jiao Y, Zeng E, Mercer K, et al. Il-10 dampens an IL-17–mediated periodontitis-associated inflammatory network. J Immunol 2020;204(8):2177-91.
[Crossref] [Google scholar] [PubMed]
- Hou Y, Li X, Liu X, Zhang Y, Zhang W, Man C, et al. Transcriptomic responses of Caco-2 cells to Lactobacillus rhamnosus GG and Lactobacillus plantarum J26 against oxidative stress. J Dairy Sci 2019;102(9):7684-96.
[Crossref] [Google scholar] [PubMed]
