- *Corresponding Author:
- Genkai Guo
Department of Endocrinology, The Third Affiliated Hospital of Nantong University, Nantong, Jiangsu 226001, China
E-mail: guogenkai@126.com
| This article was originally published in a special issue, “Innovations in Biomedical Research and Drug Development” |
| Indian J Pharm Sci 2023:85(3) Spl Issue “15-27” |
This is an open access article distributed under the terms of the Creative Commons Attribution-NonCommercial-ShareAlike 3.0 License, which allows others to remix, tweak, and build upon the work non-commercially, as long as the author is credited and the new creations are licensed under the identical terms
Abstract
Systemic lupus erythematosus is a diffuse connective tissue disease mediated by autoimmunity and characterized by immune inflammation. The purpose of this study is to explore candidate key genes and immune cell infiltration involved in the pathogenesis of systemic lupus erythematosus. Intersection genes derived from differentially expressed genes between systemic lupus erythematosus patients and healthy individuals are identified by weighted gene co-expression network analysis of module genes were aimed for gene ontology functional enrichment analysis and Kyoto encyclopedia of genes and genomes pathway enrichment analysis. The key candidate genes interferon induced protein with tetratricopeptide repeats 1 and interferon induced protein with tetratricopeptide repeats 3 were searched through the protein-protein interaction network. The cell-type identification by estimating relative subsets of ribonucleic acid transcripts arithmetic tool assessed the abundance of immune cells in samples from systemic lupus erythematosus patients. Enzymelinked immunosorbent assay confirmed the differential expression of candidate genes in serum samples from systemic lupus erythematosus patients and healthy controls. This study found that interferon induced protein with tetratricopeptide repeats 1 and interferon induced protein with tetratricopeptide repeats 3 may devote to the pathogenesis and development of systemic lupus erythematosus and can be used as prediction target genes of systemic lupus erythematosus. In addition, neutrophils and plasma cells were infiltrated more in systemic lupus erythematosus patients with high expression of interferon induced protein with tetratricopeptide repeats 1 and interferon induced protein with tetratricopeptide repeats 3. Interferon induced protein with tetratricopeptide repeats 1 and interferon induced protein with tetratricopeptide repeats 3 are important predictors for the diagnosis and treatment of systemic lupus erythematosus.
Keywords
Systemic lupus erythematosus, gene ontology, Kyoto encyclopedia of genes and genomes, immune infiltration, costimulatory genes
Systemic Lupus Erythematosus (SLE) is generally considered to be a typical autoimmune disease, which is characterized by the production of auto-antibodies, causing inflammation and multiple organ damage, but the detailed etiology is still unclear. Serious complications of SLE leads to nephritis, anemia, neurological symptoms and thrombocytopenia resulting in severe morbidity and mortality[1]. Therefore, early identification of SLE is important to limit disease progression and prevent organ damage and death. The use of biomarkers to predict patients at high risk of SLE may help in early treatment[2].
SLE is a complex multi-system autoimmune disease[3], which is characterized by the imbalance of T and B lymphocyte activation, resulting in the production of a large number of auto-reactive antibodies[4]. The activation of B cells that produce auto-antibodies depends on the assistance of T cells through cytokines and costimulatory genes[5]. Costimulatory genes promote crosstalk between leukocytes through mutual stimulation and inhibition of signals, which is helpful to produce different immune results under normal physiological and pathological conditions. The imbalance in the expression of costimulatory genes may be related to the susceptibility to autoimmune or chronic inflammatory diseases[6]. Therefore, the use of biological targets to establish associations between SLE and costimulatory genes may also help to understand their immune properties.
It has been widely accepted that congenital and adaptive immune disorders are involved in the immune pathogenesis of SLE. The imbalance of immune related cells may result from the complex interaction of genetic, epigenetic, environmental and immune factors[7]. With the rapid development of microarray technology and bioinformatics analysis, more and more microarray data analysis of SLE has been carried out and hundreds of Differentially Expressed Genes (DEGs) have been identified. Integrating and reanalyzing the data obtained by these bioinformatics methods is helpful to identify the target genes, gene regulatory pathways and immune infiltration of SLE, and provide new and valuable ideas for exploring the molecular mechanism of SLE and determining reliable diagnostic and therapeutic targets.
Materials and Methods
Microarray data information:
The original sequencing information and data are downloaded to the Gene Expression Omnibus (GEO) (http://www.ncbi.nlm.nih.gov/geo/) databases (GSE110174 and GSE121239). The GSE110174 data set included 154 samples, including 144 SLE patients and 10 healthy controls. The GSE121239 data set included 312 whole blood samples, including 292 SLE patients and 20 healthy controls. The series matrix and probe annotation documentation were downloaded from the GEO website and then the specific probe was converted into the corresponding genetic symbol according to the provided annotation document. All these data’s were initially calculated and abnormal data’s were excluded from quality control. Hierarchical clustering was carried out to eliminate duplicate data. Since the data in the experiment are all from the public database, there is no need to obtain the approval of the ethics committee.
Screening and analysis of DEGs:
R software (version 3.4.1; https://www.rproject.org/) was used to further analyze the data. Student t-test in the limma package was used to analyze significant differences between SLE patients and healthy controls. DEGs with adjusted p<0.05 and log|Fold Change (FC)|≥1 were considered statistically significant.
Construction of Weighted Gene Co-expression Network Analysis (WGCNA):
WGCNA is a method to analyze gene expression patterns of multiple samples, which can cluster genes with similar expression patterns and analyze the association between modules and specific traits or phenotypes, so it is widely used in genome research. We used the WGCNA software package in R to build a co-expression network for DEGs, which aimed to use highly related gene modules to find core genes. We established a weighted correlation adjacency matrix and defined a correlation capability (soft threshold parameter), which strengthened the strong correlation between genes and weakened the weak correlation or negative correlation. We converted the adjacency into a Topological Overlap Matrix (TOM) to measure the network connectivity of genes and TOM summarized the neighboring genes of the network gene ratio and calculates the corresponding differences. We used average linkage hierarchical clustering based on TOM difference measurement to classify genes and gene modules with similar expression profiles. These genes were represented by branches and different colors of cluster trees, respectively, and the module relationships were constructed. The correlation between gene modules and phenotypes was calculated.
Functional annotation and pathway enrichment analysis:
Venn diagram intersected the DEGs from GSE110174 and GSE121239 datasets with their respective module genes and retained their common genes for further analysis. Genes Ontology (GO) enrichment analysis is composed of three aspects, namely, biological processes, molecular functions and cellular components. It is a widely used ontology database to show functions and biological processes involved. Kyoto Encyclopedia of Genes and Genomes (KEGG) database is mainly used for path analysis. These two analyses are always combined to enrich the biological significance of Common DEGs (CDEGs).
Construction of Protein-Protein Interaction (PPI) network and determination of hub genes:
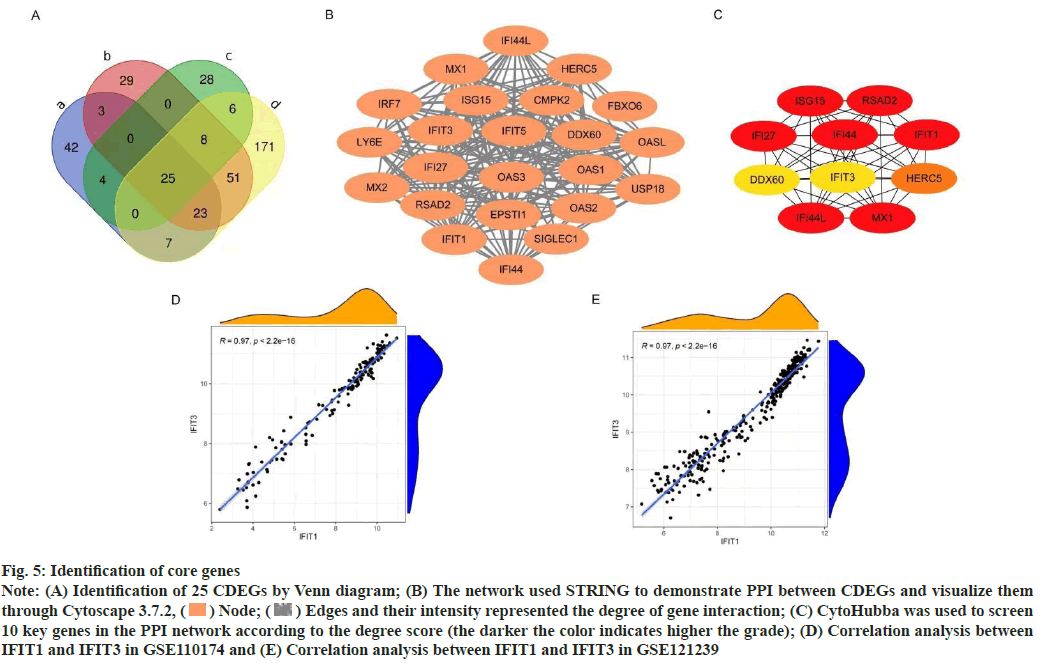
Venn diagram intersected the differential genes and module genes in the two data sets and screened 25 common differential genes for further analysis. To evaluate the relationship between these CDEGs, the Search Tool for the Retrieval of Interacting Genes (STRING) (http://string-db.org) was used to build a PPI network. It can use neighborhood, gene fusion, co-occurrence, co-expression experiments, database and text mining to predict PPIs. We used Cytoscape software (version 3.7.2; http://www.Cytoscape.org) to visualize network analysis. CytoHubba software was used to select the 10 most relevant key genes, which may be involved in mediating the main physiological regulation functions in SLE. We used a scatter plot to explore the correlation between 10 key genes and found that there was a high correlation between Interferon Induced protein with Tetratricopeptide repeats 1 (IFIT1) and Interferon Induced protein with Tetratricopeptide repeats 3 (IFIT3), so we mainly studied the two key genes IFIT1 and IFIT3.
Evaluation of immune infiltration:
Cell-type Identification by Estimating Relative Subsets of Ribonucleic acid Transcripts (CIBERSORT), an analytical tool, was used to evaluate the richness of immune cells in samples from SLE patients. We ranked SLE patients according to the expression of key genes and divided them into high and low groups. Then the violin picture was drawn using the "grammar of graphics plot 2" (ggplot2) package to visualize the difference of immune cell infiltration and costimulatory gene expression in the high and low expression groups of key genes, and then the relevant heat map was drawn using the "comPlot" package to explore the correlation between 22 types of immune cells in SLE patients.
Collection of serum samples:
36 SLE patients were collected from the Third affiliated Hospital of Nantong University. The diagnostic criteria were in line with the revised criteria of SLE by the American College of Rheumatology in 2009. Relevant clinical and laboratory characteristics of SLE patients included sex, age, disease duration, the SLE disease activity index score, anti-doublestranded Deoxyribonucleic Acid (anti-dsDNA) antibody, low complement, glucocorticoid dose and the use of disease-modifying anti-rheumatic drugs. 36 age-matched healthy controls were collected and healthy controls without a history of autoimmunity or immunosuppressant therapy were required.
Enzyme-Linked Immunosorbent Assay (ELISA) experiment:
The ELISA kit was purchased from Jiangsu Jingmei Biotechnology Co., Ltd. The ELISA kit was used to determine the levels of IFIT1 and IFIT3 in serum samples by double antibody sandwich method, with sensitivity above 95 % and specificity above 98 %. The steps were performed according to the manufacturer’s instructions.
Results and Discussion
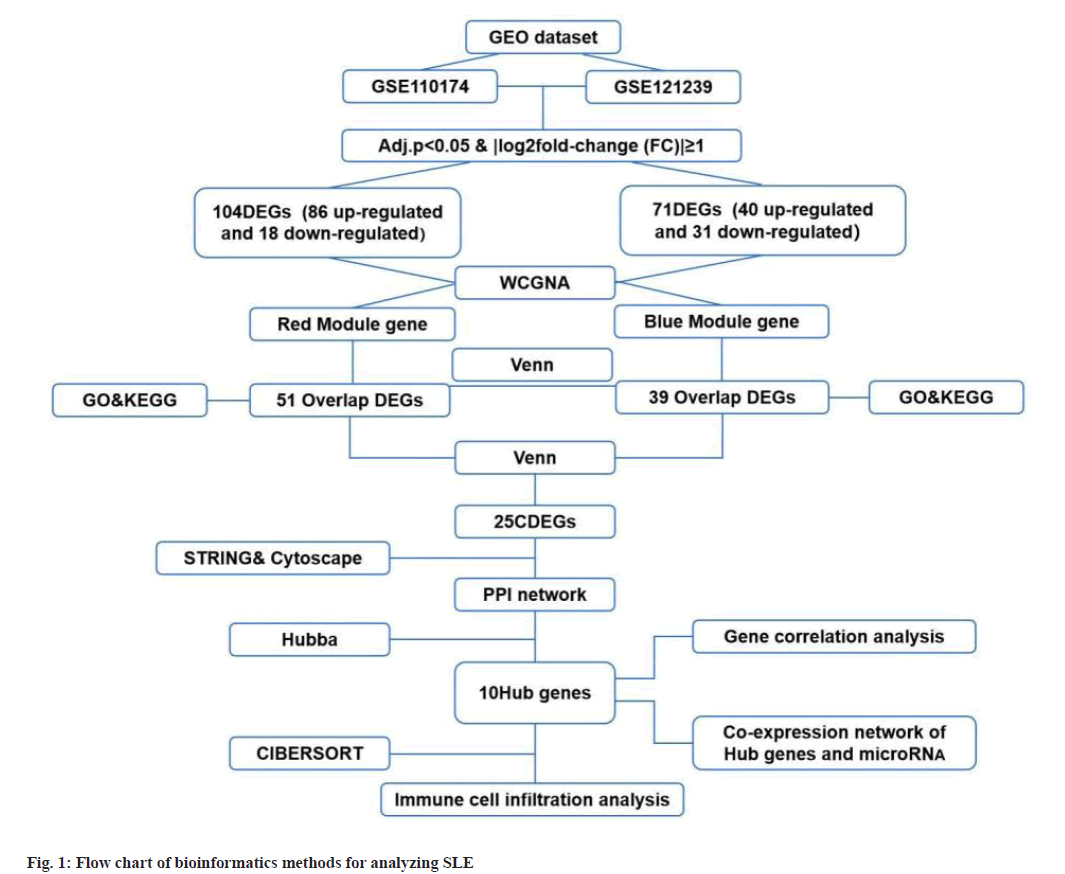
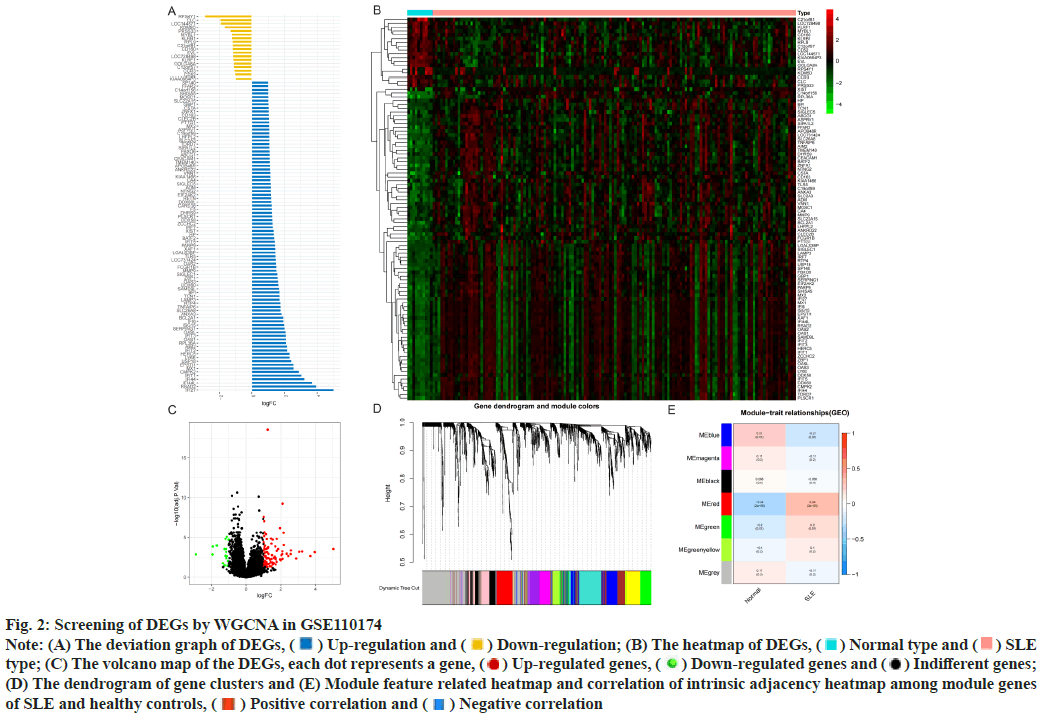
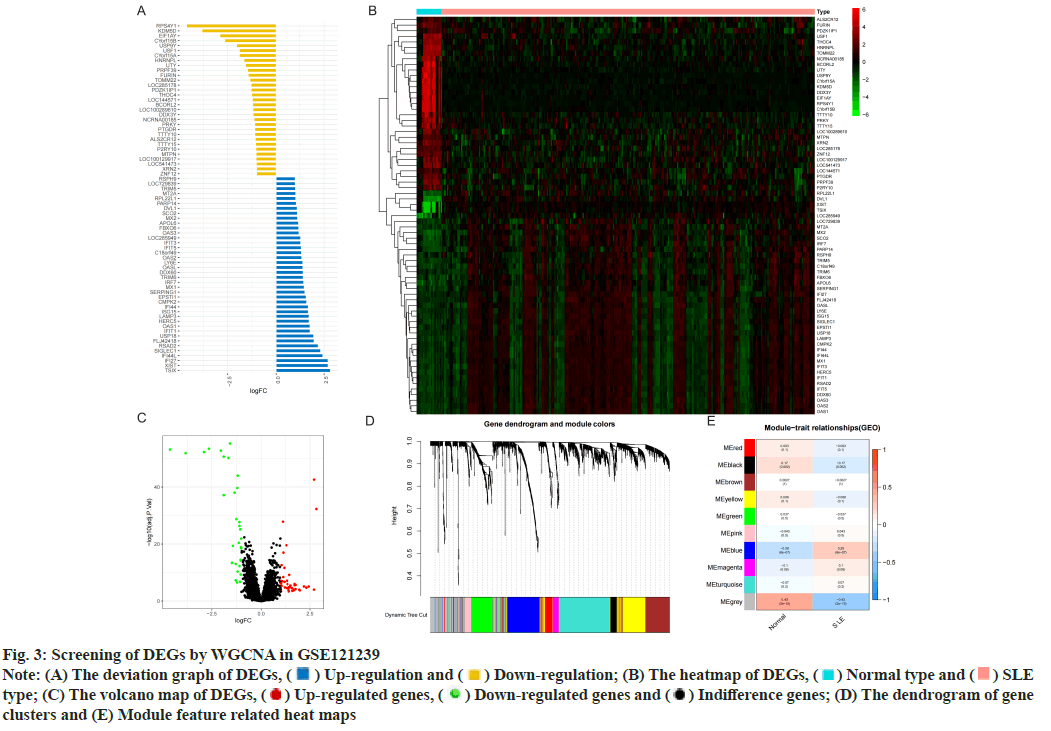
Identification of DEGs was described here. Fig. 1 illustrated the workflow of the specific application and all the data used in this research. Screening criteria of DEGs between SLE patients and healthy controls were identified as p<0.05 and log|FC|≥1. In GSE110174, 104 DEGs were differentially expressed between SLE patients and healthy controls, of which 86 were up-regulated and 18 were down-regulated (fig. 2A-fig. 2E). Similarly, in GSE121239 of 292 SLE patients and 20 healthy controls in which we identified 71 DEGs, of which 40 were up-regulated and 31 down-regulated (fig. 3A-fig. 3E). Interestingly, we found that some genes showed significant differences between the two data sets such as Interferon alpha- Inducible protein 27 (IFI27), Interferon Induced protein 44 Like (IFI44L), Interferon Induced protein 44 (IFI44), IFIT1, Interferon-Induced protein with Tetratricopeptide repeats 2 (IFIT2), IFIT3, Interferon-Stimulated Gene 15 (ISG15) and Myxovirus Resistance 1 (MX1). Compared with the normal group, many important genes in SLE showed significant changes in expression (fig. 2B and fig. 3B). By comparing the SLE with the healthy controls, the volcano maps were designed to show DEGs (fig. 2C and fig. 3C).
Fig. 2: Screening of DEGs by WGCNA in GSE110174
Note: (A) The deviation graph of DEGs,  Up-regulation and
  Down-regulation; (B) The heatmap of DEGs,
  Normal type and
  SLE
type; (C) The volcano map of the DEGs, each dot represents a gene,
  Up-regulated genes,
  Down-regulated genes and
  Indifferent genes;
(D) The dendrogram of gene clusters and (E) Module feature related heatmap and correlation of intrinsic adjacency heatmap among module genes
of SLE and healthy controls,
  Positive correlation and
  Negative correlation
Fig. 3: Screening of DEGs by WGCNA in GSE121239
Note: (A) The deviation graph of DEGs,  Up-regulation and
  Down-regulation; (B) The heatmap of DEGs,
  Normal type and
  SLE
type; (C) The volcano map of DEGs,
  Up-regulated genes,
  Down-regulated genes and
  Indifference genes; (D) The dendrogram of gene
clusters and (E) Module feature related heat maps
Construction of modules through WGCNA was explained here. To construct the co-expression module, we performed WGCNA on genes in the two data sets separately. The corresponding relationship between genes and modules was obtained in the form of a gene clustering tree diagram. The genes clustered in GSE110174 data set were mainly divided into red modules (fig. 2D), in which the upper part was the hierarchical clustering tree of genes and the lower part was the gene module. Corresponding up and down parts, we could see the genes that were close to each other (clustered into the same branch) were divided into the same module. While the genes clustered in GSE121239 data set were mainly divided into grey and blue modules (fig. 3D). To explore the correlation among module genes SLE and healthy controls, we drew the intrinsic adjacency heat map of module genes. 139 genes clustered in the red module had the highest positive correlation with SLE patients (correlation coefficient-0.34, p<0.05) and the highest negative correlation in healthy controls (correlation coefficient-0.34, p<0.05) (fig. 2E).
However, the genes clustered in the grey module in GSE121239 had the highest negative correlation with the occurrence of SLE and the highest positive correlation in normal people, which was contrary to fig. 2E and did not accord with the situation of this study, so the blue module with the second correlation was selected (fig. 3E). The 291 genes of the blue module had the highest positive correlation with SLE patients (correlation coefficient-0.28, p<0.05) and the highest negative correlation in healthy controls (correlation coefficient-0.28, p<0.05).
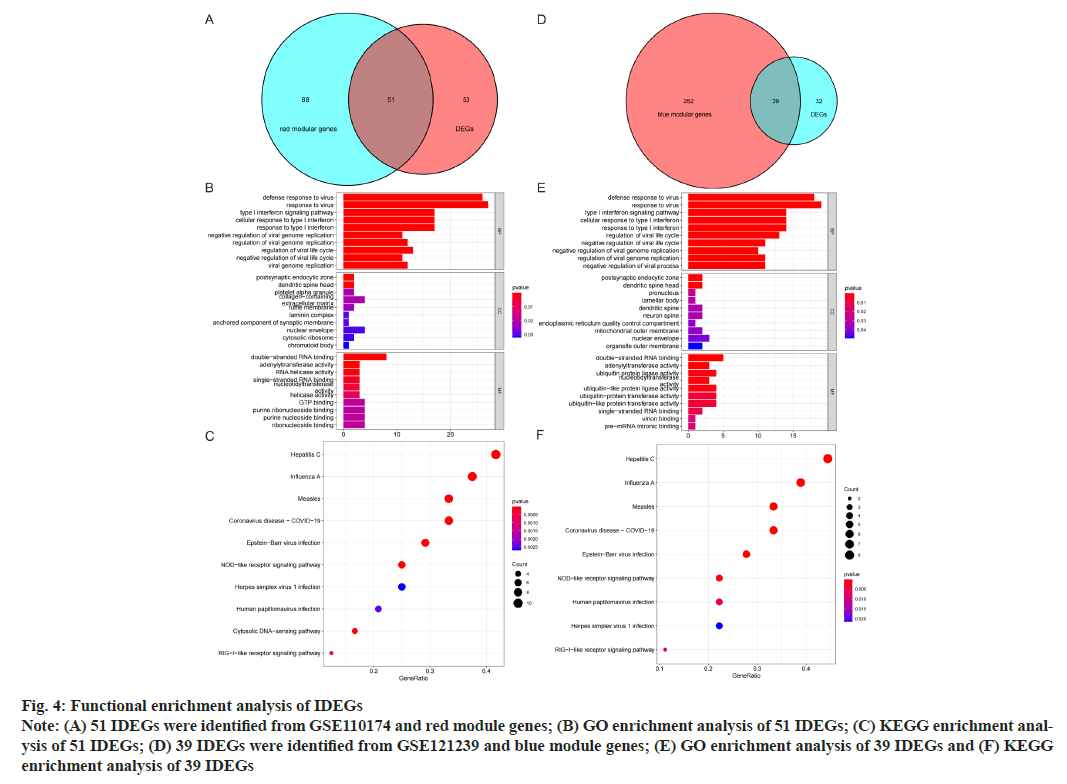
GO and KEGG analysis of Intersection DEGs (IDEGs) was shown here. The DEGs of GSE110174 were intersected with the red module genes and 51 IDEGs were obtained (fig. 4A-fig. 4E). The DEGs of GSE121239 were intersected with the blue module genes and 39 IDEGs were achieved (fig. 4D). For the GO enrichment analysis, the IDEGs of two data sets mainly regulated by defense and response to a virus, type I Interferon (IFN) signal pathway, response to IFN and Ribonucleic Acid (RNA) binding promotion (fig. 4B and fig. 4E). The KEGG pathway analysis of 51 IDEGs were enriched in a variety of infectious diseases, including viral hepatitis C, influenza A, measles, coronavirus 19, Epstein-Barr virus infection, as well as immune system-related signaling pathways, such as cytoplasmic DNA induction pathway and nod-like receptor signal pathway (fig. 4C). The KEGG pathways of 39 IDEGs showed not only the infectious diseases mentioned above, but also human papillomavirus infection (fig. 4F).
Fig. 4: Functional enrichment analysis of IDEGs
Note: (A) 51 IDEGs were identified from GSE110174 and red module genes; (B) GO enrichment analysis of 51 IDEGs; (C) KEGG enrichment analysis
of 51 IDEGs; (D) 39 IDEGs were identified from GSE121239 and blue module genes; (E) GO enrichment analysis of 39 IDEGs and (F) KEGG
enrichment analysis of 39 IDEGs
Construction of PPI network was shown here. The Venn diagram was used to intersect the IDEGs and module genes in the two data sets to get 25 CDEGs (fig. 5A). To further study the correlation between CDEGs, a PPI network was constructed based on STRING online and visualized by Cytoscape software (fig. 5B). CytoHubba was used to screen the 10 genes with a high degree of hub genes in the PPI network (fig. 5C).
To determine the hub genes screening of 10 key genes was done. Among the 10 key genes, MX1 and ISG15 have been widely studied, which also verified the reliability of the key genes screened at present. Among the remaining 8 genes, IFIT1, IFIT3, IFI27, IFI44 and IFI44L were family genes. According to the available data, IFI44, IFI27 have been confirmed to be related to the occurrence and progression of SLE in other researches. There was a high correlation between IFIT1 and IFIT3 in different data sets (correlation coefficient-0.97, p<0.05) (fig. 5D and fig. 5E), but this correlation was not found in other genes, so the next study focused on IFIT1 and IFIT3.
Fig. 5: Identification of core genes
Note: (A) Identification of 25 CDEGs by Venn diagram; (B) The network used STRING to demonstrate PPI between CDEGs and visualize them
through Cytoscape 3.7.2,  Node;
Node;  Edges and their intensity represented the degree of gene interaction; (C) CytoHubba was used to screen
10 key genes in the PPI network according to the degree score (the darker the color indicates higher the grade); (D) Correlation analysis between
IFIT1 and IFIT3 in GSE110174 and (E) Correlation analysis between IFIT1 and IFIT3 in GSE121239
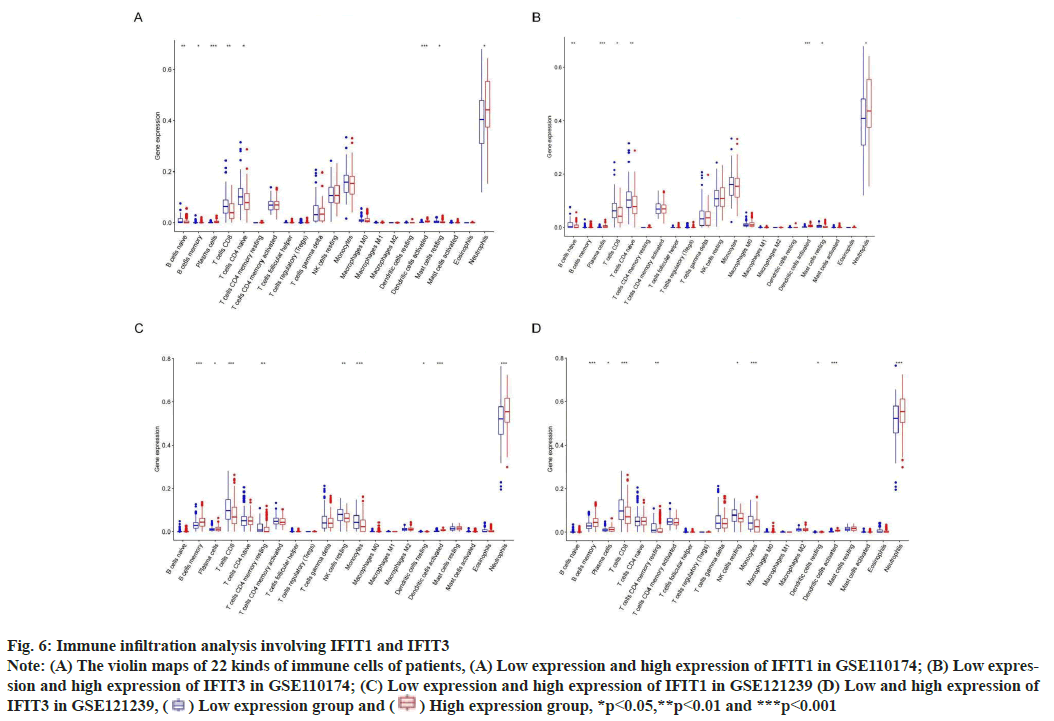
Immune infiltration analysis was explained
Fig. 6: Immune infiltration analysis involving IFIT1 and IFIT3
Note: (A) The violin maps of 22 kinds of immune cells of patients, (A) Low expression and high expression of IFIT1 in GSE110174; (B) Low expression
and high expression of IFIT3 in GSE110174; (C) Low expression and high expression of IFIT1 in GSE121239 (D) Low and high expression of
IFIT3 in GSE121239,  Low expression group and
  High expression group, *p<0.05,**p<0.01 and ***p<0.001
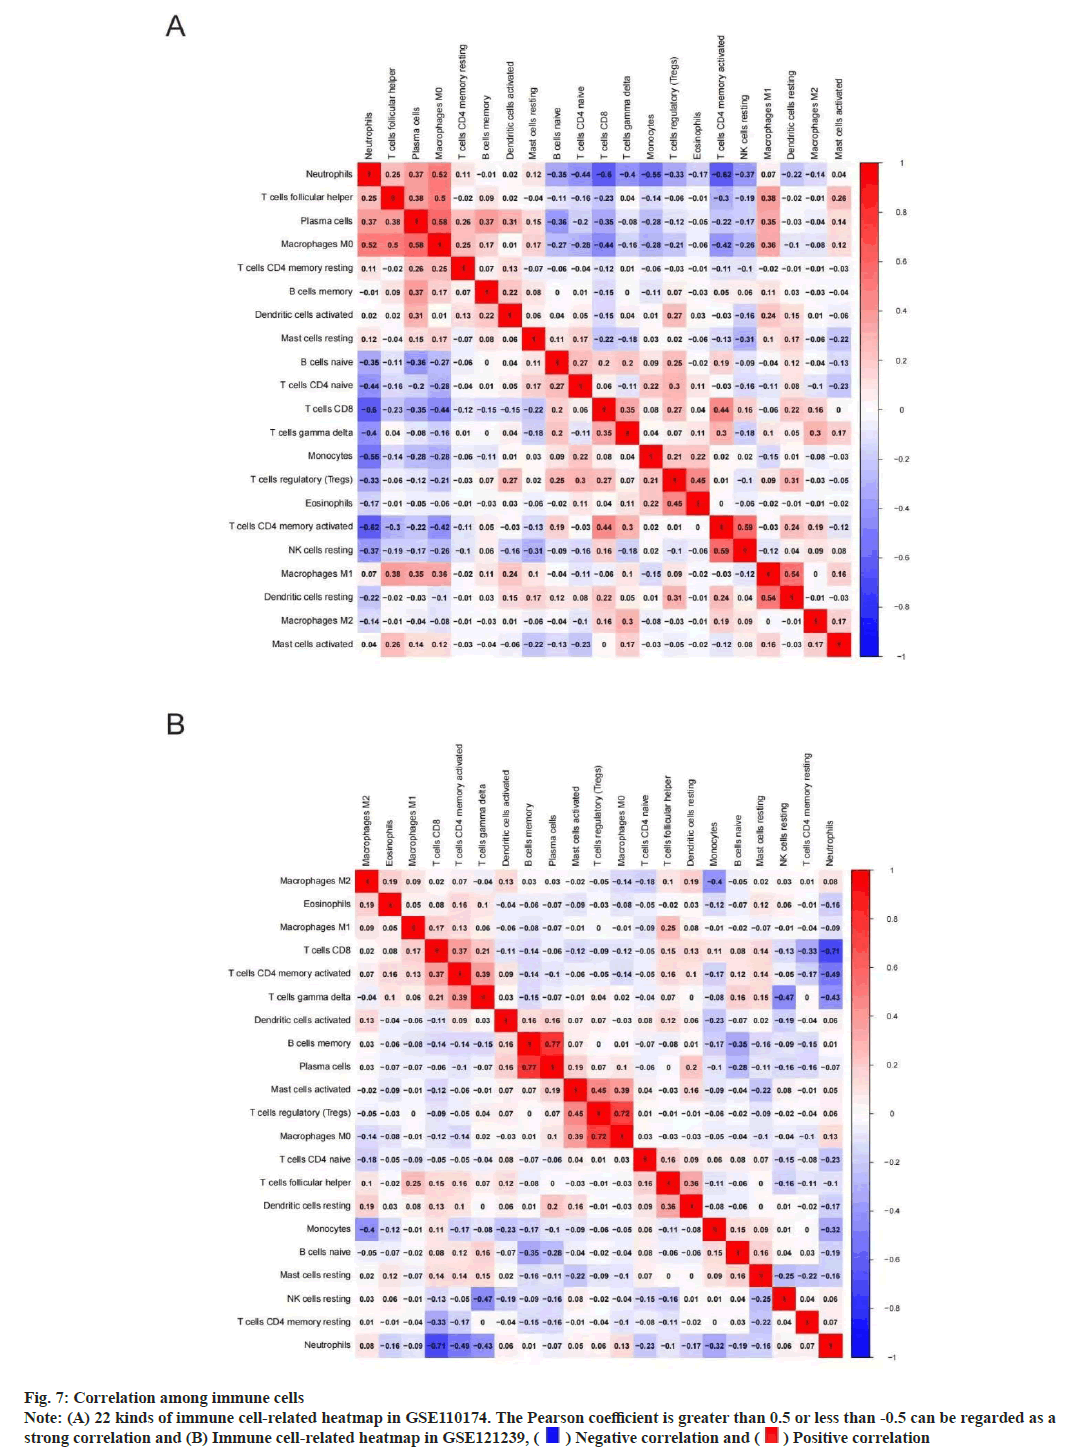
We performed immune correlation analysis to determine the correlation between different cells. In GSE110174, there was a strong positive correlation between activated Cluster of Differentiation 4 (CD4+) T memory cells and inactivated natural killer cells neutrophils (r=0.59). At the same time, there was a strong negative correlation between neutrophils and activated CD4+ T memory cells (r=0.62) (fig. 7A). In addition, there was a strong positive correlation between memory B cells and plasma cells (r=0.77) in GSE121239. However, there was a strong negative correlation between neutrophils and CD8+ T cells (r=0.71) (fig. 7B).
Fig. 7: Correlation among immune cells
Note: (A) 22 kinds of immune cell-related heatmap in GSE110174. The Pearson coefficient is greater than 0.5 or less than -0.5 can be regarded as a
strong correlation and (B) Immune cell-related heatmap in GSE121239,  Negative correlation and
  Positive correlation
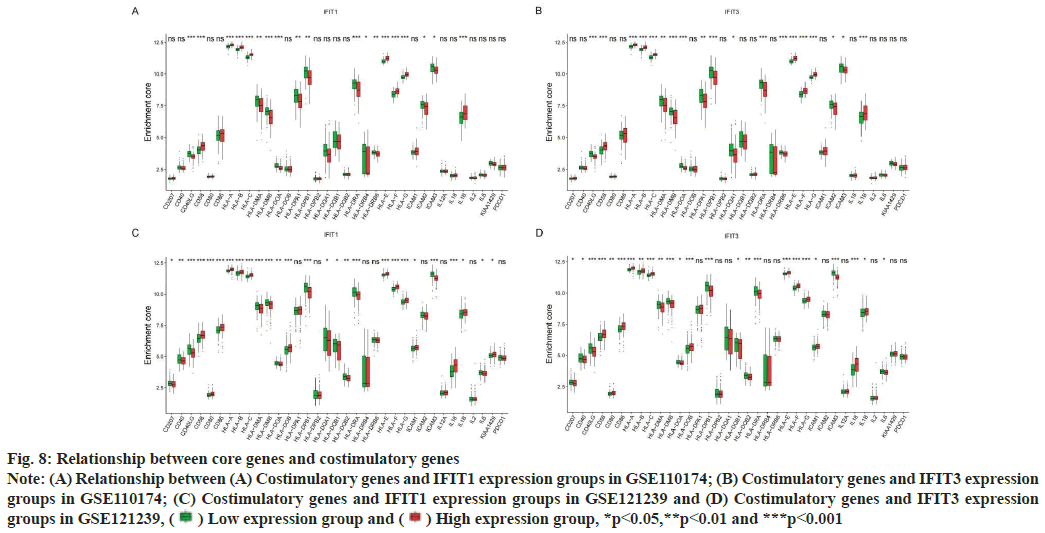
Association of costimulatory genes with core genes was shown here. SLE can participate in cell communication through costimulatory genes, to drive the presentation of autoantigens and to produce pathogenic autoantibodies. At present, many studies have shown that many costimulatory genes associated with core genes may be involved in the pathogenesis of SLE. In this study, we found that in two different data sets, the expression of costimulatory genes Human Leukocyte Antigen (HLA)-A, HLA-B, HLA-C, HLA-E, HLA-F, HLA-G, CD58 and Interleukin-1 beta (IL-1β) were higher in both the high expression groups of IFIT1 and IFIT3 (fig. 8A-fig. 8D). Perhaps the abnormal expression of these costimulatory genes was involved in the pathogenesis of the SLE mechanism.
Fig. 8: Relationship between core genes and costimulatory genes
Note: (A) Relationship between (A) Costimulatory genes and IFIT1 expression groups in GSE110174; (B) Costimulatory genes and IFIT3 expression
groups in GSE110174; (C) Costimulatory genes and IFIT1 expression groups in GSE121239 and (D) Costimulatory genes and IFIT3 expression
groups in GSE121239,  Low expression group and
  High expression group, *p<0.05,**p<0.01 and ***p<0.001
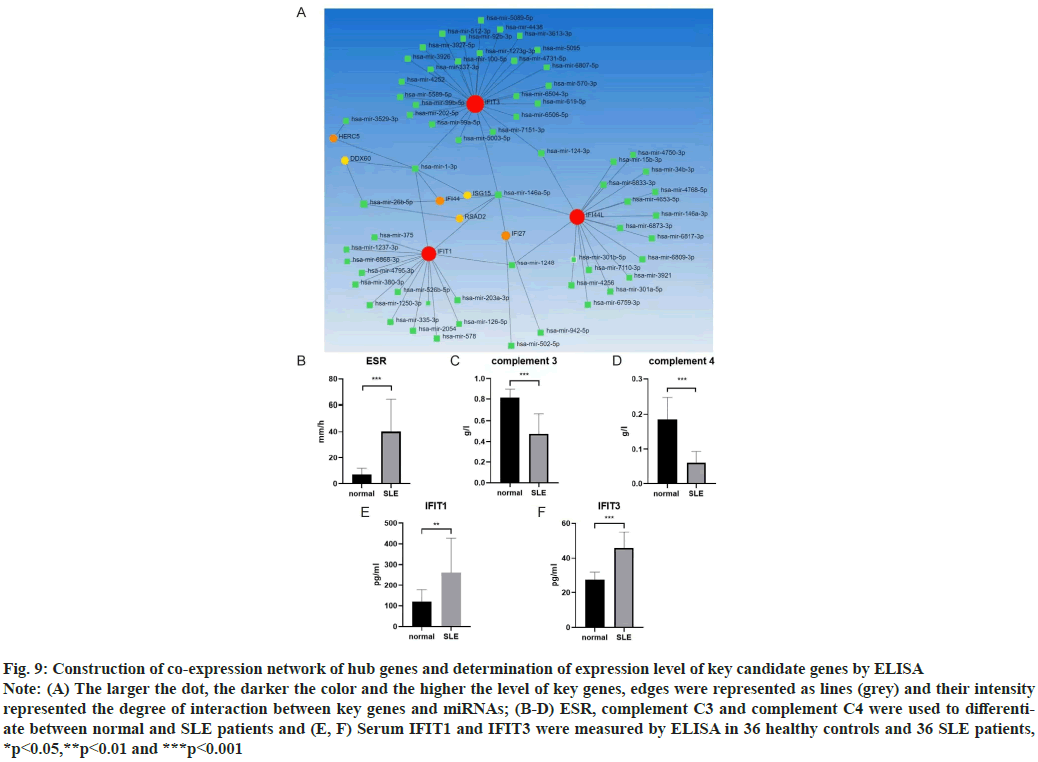
Construction of co-expression network of hub genes was shown here. New evidence suggested that micro RNAs (miRNAs) played a significant role in autoimmune diseases, especially in Lupus Nephritis (LN). The NetworkAnalyst database (http://www.networkanalyst.ca/) was used to predict the relationship between key genes and miRNAs. 61 target miRNAs of 9 specifically expressed hub genes were obtained and 76 pairs of messenger RNA (mRNA)-miRNA were identified. According to the predicted results, mRNAs and miRNAs coexpression network composed of 70 nodes and 76 edges was constructed (fig. 9A).
Determination of expression level of key candidate genes by ELISA was shown here. ELISA was used to detect the contents of serum IFIT1 and IFIT3 components in healthy controls (n=36) and SLE patients (n=36). Normal people and SLE patients can be distinguished by some blood parameters, such as Erythrocyte Sedimentation Rate (ESR), Complement component 3 (C3), Complement component 4 (C4) (fig. 9B-fig. 9D). We found the expression of IFIT1 in SLE patients was higher than that in healthy controls. The expression level of IFIT3 in SLE patients was also higher than that in healthy controls (fig. 9E and fig. 9F).
Fig. 9: Construction of co-expression network of hub genes and determination of expression level of key candidate genes by ELISA
Note: (A) The larger the dot, the darker the color and the higher the level of key genes, edges were represented as lines (grey) and their intensity
represented the degree of interaction between key genes and miRNAs; (B-D) ESR, complement C3 and complement C4 were used to differentiate
between normal and SLE patients and (E, F) Serum IFIT1 and IFIT3 were measured by ELISA in 36 healthy controls and 36 SLE patients,
*p<0.05,**p<0.01 and ***p<0.001
At present, the cause of SLE has not been fully clarified. It is thought to involve immune, environmental and genetic factors. It is found that multiple genes may commit to the occurrence and pathogenesis of SLE. The objective of this study was to screen candidate biomarkers for the treatment of SLE using bioinformatics.
IFN is known to play a role in the pathogenesis of SLE. IFN regulates the body’s immune system by activating the ISGs. The expression level of IFNinduced genes is closely related to the pathogenesis of SLE. IFI27, IFI44, IFI44L, IFIT1 and IFIT3 are all related to IFN. IFI44L and IFIT3 are involved in the type I IFN signal pathway, indicating that type I IFN signal pathway is closely related to the pathogenesis of SLE[8]. In this study, the expression of CDEGs in the two groups was mainly regulated by defense and response to the virus, IFN signal pathway, response to IFN, RNA binding and so on. This is in line with the characteristics of immune abnormalities belonging to autoimmune diseases. Furthermore, CDEGs were mainly enriched in pathways and related to susceptibility to infectious diseases and were also involved in immune signaling pathways, such as nod-like receptor signaling pathways. These findings are consistent with the knowledge that SLE is a multisystem autoimmune disease. In summary, the IFN and IFN signal pathways work on the pathogenesis of SLE.
IFI27 is an IFN-α inducible protein with antiviral activity. It has been confirmed to be up-regulated in Peripheral Blood Mononuclear Cell (PBMC) of SLE patients[9]. Some researchers identify IFI27 as a potential molecular marker for the diagnosis of SLE patients[10].
DNA methylation commits to the pathogenesis of SLE[11]. IFI44L promoter demethylation is a methylation marker to distinguish SLE patients from healthy people, other autoimmune diseases and patients with infectious diseases. IFI44L is a type I IFN inducible gene. The level of IFN in SLE patients is increased[11], but IFN cannot directly induce DNA demethylation of IFI44L promoter in PBMC of SLE patients[12].
ISG15 is an ubiquitin-like protein induced by IFN, which can interfere with the activity of virus protein. SLE activity may be effected by ISG15- mediated resistance to IFN signaling and Signal Transducer and Activator of Transcription 1 (STAT1) phosphorylation, and protects Regulatory T cells (Tregs) from the effects of IFN[13]. Another study shows that Neutrophil Extracellular Traps (NETs) containing ISG15, promotes the production of IFNgamma (γ) in patients with SLE, which explained the persistent pro-inflammatory response of SLE[14].
IFI44 is an IFN response gene. Some researchers detect the quantitative expression level of the IFI44 gene by collecting peripheral blood from patients with SLE and healthy controls, which reveals that IFI44 committed to the occurrence and development of SLE. They also confirm that there are a positive correlation between the expression level of IFI44 and the clinical manifestation and disease activity of SLE by gene sequencing and other methods. Through bioinformatics analysis, researchers have found that IFI44 can be used as a key candidate gene for LN to diagnose diseases or evaluate prognosis[15,16]. In addition, the expression level of IFI44 in peripheral blood reflects the renal damage of LN to some extent. All the core genes screened above had good predictive effect on SLE, which further verified the reliability of our screening.
IFIT1 is one of the antiviral RNA binding proteins induced by IFN[14]. Some researchers determine the gene expression profiles of 10 SLE patients by oligonucleotide microarray analysis[17]. Finally, it is confirmed that the expression of IFIT1 in SLE patients is significantly up-regulated[18], which is a candidate gene for SLE. IFIT1 may cross-react with Rho/Rac guanine nucleotides to regulate the activation of Rho/Rac protein, thus participating in the pathogenesis of SLE[14].
IFIT3 is an IFN-induced gene. Its coding protein is involved in the innate immune response of virus infection[14,16]. The abnormal increase of IFIT3 in patients with SLE is closely related to the over activation of the cyclic Guanosine Monophosphate (GMP)-Adenosine Monophosphate (AMP) Synthase (cGAS)/Stimulator of IFN Genes (STING) signal pathway in monocytes[19]. IFIT3 activates the cGAS/ STING signal pathway by mediating the production of IFN. Combined with this study, IFIT3 could be used as a new therapeutic target for SLE. Reducing its expression level may inhibit the activation of the cGAS/STING signal pathway, thus reducing the production of type I IFN and other pro-inflammatory cytokines, and ultimately improving the clinical manifestations of SLE[19]. Both IFIT1 and IFIT3 have been confirmed to be new therapeutic targets for SLE and key candidate genes for the occurrence and development of SLE[8], which is consistent with the results of our literature analysis.
IFN is a key component of the innate immune system. It is reported that, IFN affects a large number of immune cells in the pathology of SLE[20]. This research showed that neutrophils and plasma cells infiltrated more in SLE patients with high expression of IFIT1 and IFIT3. We know that plasma cells are the terminal cells of B cell differentiation and their cytoplasm is rich in the rough endoplasmic reticulum, which is conducive to the secretion of a large number of specific antibodies. Among many factors in the pathogenesis of SLE, abnormal activation of B cells and increase of plasma cells focus on the destruction of systemic immune tolerance and local autoimmune inflammation[21]. In addition, neutrophils can secrete highly expressed IFN that contributes to inflammation and tissue damage, which is a key cytokine in the pathogenesis of SLE[22]. Therefore, targeting abnormal neutrophil activation and plasma cells in SLE may be a promising approach.
SLE is characterized by a variety of immune abnormalities, including T and B lymphocyte activation disorders and subsequent polyclonal activation of circulating B lymphocytes, resulting in the production of a large number of auto reactive antibodies. It has been shown that the activation of B cells that produce autoantibodies depends on the help of T cells through cytokines and costimulatory related molecules[5]. The imbalance in the expression of costimulatory genes may be related to the susceptibility to autoimmune or chronic inflammatory diseases[6]. The abnormal production of T cell costimulatory genes is very important in the immune pathogenesis of SLE. This abnormal expression of costimulatory genes may lead to the loss of self-tolerance and disease development in patients with SLE.
HLA class 1 is related to SLE and increases the risk of SLE. Classical HLA-1A genes including HLA-A, HLA-B and HLA-C, devote to presenting antigenic peptides to CD8+ cytotoxic T cells. Nonclassical HLA-1B genes include HLA-E, HLA-F and HLA-G[23]. Hyperactivity of T lymphocytes and progressive inflammation in patients with SLE lead to overexpression of HLA-1B on the surface of lymphocytes. At present, the dynamic changes of anti-HLA-F Immunoglobulin G (IgG) autoantibodies was caused by the immunogenicity of HLA-F in SLE may be related to the clinical activity of SLE[24]. HLA-G is a non-classical HLA-1B gene, which lead to immunosuppression by inhibiting the function of natural killer cells, CD4+ and CD8+ lymphocytes and dendritic cells[25-27].
LN is one of the most serious complications of SLE[28]. Therefore, it is particularly important to explore potential biomarkers of LN. In this study, we found that there is a close relationship among IFIT3, IFI44 and miR-146a-5p by constructing the co-expression network of Hub genes and miRNAs. IFI44 and IFIT3 focus on the pathogenesis of LN through bioinformatics analysis[15]. miRNAs can induce translation inhibition of target mRNA and affect cell metabolism, proliferation and apoptosis[29]. miRNAs focus on the pathogenesis of autoimmune diseases. miR-146a-5p is the mature sequence of the 5’ end of miR-146a transcriptional processing. Some researchers have observed a significant increase of miR-146a in lupus mouse PBMC, which may participate in T cell-mediated inflammation by negatively regulating the activity of Nuclear Factorkappa B (NF-κB)[30], while the expression of miR- 146a in serum exocrine bodies of SLE patients is significantly decreased[31]. The expression of miR- 146a is associated with renal inflammation, fibrosis, extracellular matrix remodeling and proteolysis of collagen protein. It has been confirmed that the expression of miR-146a in patients with LN is decreased, which may result in the pathogenesis of LN[32,33]. miR-146a may participate in the occurrence and development of LN by inhibiting the transcriptional activity of NF-κB and the synthesis of inflammatory factors[34].
Various results confirm the reliability of our prediction, but the specific mechanism of our study still needs to be further explored. This study found that IFIT1 and IFIT3 are the two key genes which could be used as prediction target genes of SLE.
Author’s contributions:
Yiying Wang and Yan Lu contributed equally to this work.
Conflict of interests:
The authors declare that they have no competing interests.
References
- Kumar SU, Kumar DT, Siva R, Doss CGP, Younes S, Younes N, et al. Dysregulation of signaling pathways due to differentially expressed genes from the B-cell transcriptomes of systemic lupus erythematosus patients-a bioinformatics approach. Front Bioeng Biotechnol 2020;8:1-17.
[Crossref] [Google scholar] [PubMed]
- Lambers WM, Westra J, Bootsma H, de Leeuw K. From incomplete to complete systemic lupus erythematosus: A review of the predictive serological immune markers. Semin Arthritis Rheum 2021;51(1):43-8.
[Crossref] [Google scholar] [PubMed]
- Mak A, Schwarz H. The progress of investigating the CD137-CD137L axis as a potential target for systemic lupus erythematosus. Cells 2019;8(9):1-11.
[Crossref] [Google scholar] [PubMed]
- Barton CL, Hutson PH. Inhibition of hippocampal 5‐HT synthesis by fluoxetine and paroxetine: Evidence for the involvement of both 5‐HT1A and 5‐HT1B/D autoreceptors. Synapse 1999;31(1):13-9.
[Crossref] [Google scholar] [PubMed]
- Wong CK, Lit LC, Tam LS, Li EK, Lam CW. Aberrant production of soluble costimulatory molecules CTLA-4, CD28, CD80 and CD86 in patients with systemic lupus erythematosus. Rheumatology 2005;44(8):989-94.
[Crossref] [Google scholar] [PubMed]
- Matsushita M, Tsuchiya N, Oka T, Yamane A, Tokunaga K. New polymorphisms of human CD80 and CD86: Lack of association with rheumatoid arthritis and systemic lupus erythematosus. Genes Immun 2000;1(7):428-34.
[Crossref] [Google scholar] [PubMed]
- Tsai CY, Shen CY, Liu CW, Hsieh SC, Liao HT, Li KJ, et al. Aberrant non-coding RNA expression in patients with systemic lupus erythematosus: Consequences for immune dysfunctions and tissue damage. Biomolecules 2020;10(12):1-24.
[Crossref] [Google scholar] [PubMed]
- Wang Y, Ma Q, Huo Z. Identification of hub genes, pathways and related transcription factors in systemic lupus erythematosus: A preliminary bioinformatics analysis. Medicine 2021;100(25):e26499.
[Crossref] [Google scholar] [PubMed]
- Min Z, Ye Z, Gang L, Boyu D, Xueyan X. IFI27 as a potential indicator for severe Enterovirus 71-infected hand foot and mouth disease. Virus Res 2020;289:198149.
[Crossref] [Google scholar] [PubMed]
- Zhao X, Zhang L, Wang J, Zhang M, Song Z, Ni B, et al. Identification of key biomarkers and immune infiltration in systemic lupus erythematosus by integrated bioinformatics analysis. J Transl Med 2021;19(1):1-7.
[Crossref] [Google scholar] [PubMed]
- Joseph S, George NI, Green-Knox B, Treadwell EL, Word B, Yim S, et al. Epigenome-wide association study of peripheral blood mononuclear cells in systemic lupus erythematosus: Identifying DNA methylation signatures associated with interferon-related genes based on ethnicity and SLEDAI. J Autoimmun 2019;96:147-57.
[Crossref] [Google scholar] [PubMed]
- Zhao M, Zhou Y, Zhu B, Wan M, Jiang T, Tan Q, et al. IFI44L promoter methylation as a blood biomarker for systemic lupus erythematosus. Ann Rheum Dis 2016;75(11):1998-2006.
[Crossref] [Google scholar] [PubMed]
- Pacella I, Spinelli FR, Severa M, Timperi E, Tucci G, Zagaglioni M, et al. ISG15 protects human tregs from interferon alpha‐induced contraction in a cell‐intrinsic fashion. Clin Transl Immunol 2020;9(12):e1221.
[Crossref] [Google scholar] [PubMed]
- Wu C, Zhao Y, Lin Y, Yang X, Yan M, Min Y, et al. Bioinformatics analysis of differentially expressed gene profiles associated with systemic lupus erythematosus. Mol Med Rep 2018;17(3):3591-8.
[Crossref] [Google scholar] [PubMed]
- Shen L, Lan L, Zhu T, Chen H, Gu H, Wang C, et al. Identification and validation of Ifi44 as key biomarker in lupus nephritis. Front Med 2021:1937.
[Crossref] [Google scholar] [PubMed]
- Kong J, Li L, Zhimin L, Yan J, Ji D, Chen Y, et al. Potential protein biomarkers for systemic lupus erythematosus determined by bioinformatics analysis. Comput Biol Chem 2019;83:107135.
[Crossref] [Google scholar] [PubMed]
- Ye S, Pang H, Gu YY, Hua J, Chen XG, Bao CD, et al. Protein interaction for an interferon-inducible systemic lupus associated gene, IFIT1. Rheumatology 2003;42(10):1155-63.
[Crossref] [Google scholar] [PubMed]
- Hu W, Niu G, Li H, Gao H, Kang R, Chen X, et al. The association between expression of IFIT1 in podocytes of MRL/lpr mice and the renal pathological changes it causes: An animal study. Oncotarget 2016;7(47):76464-70.
[Crossref] [Google scholar] [PubMed]
- Hawkins TD. Extracranial/intracranial anastomosis in therapeutic balloon occlusion of the internal carotid artery. Acta Radiol Suppl 1986;369:73-6.
[Google scholar] [PubMed]
- Xiang M, Chen Q, Feng Y, Wang Y, Wang J, Liang J, et al. Bioinformatic analysis of key biomarkers and immune filtration of skin biopsy in discoid lupus erythematosus. Lupus 2021;30(5):807-17.
[Crossref] [Google scholar] [PubMed]
- Ma K, Li J, Wang X, Lin X, Du W, Yang X, et al. TLR4+ CXCR4+ plasma cells drive nephritis development in systemic lupus erythematosus. Ann Rheum Dis 2018;77(10):1498-506.
[Crossref] [Google scholar] [PubMed]
- O’Neil LJ, Kaplan MJ, Carmona-Rivera C. The role of neutrophils and neutrophil extracellular traps in vascular damage in systemic lupus erythematosus. J Clin Med 2019;8(9):1-13.
[Crossref] [Google scholar] [PubMed]
- Martens HA, Nolte IM, Van Der Steege G, Schipper M, Kallenberg CG, Te Meerman GJ, et al. An extensive screen of the HLA region reveals an independent association of HLA class I and class II with susceptibility for systemic lupus erythematosus. Scand J Rheumatol 2009;38(4):256-62.
[Crossref] [Google scholar] [PubMed]
- Jucaud V, Ravindranath MH, Terasaki PI, Morales-Buenrostro LE, Hiepe F, Rose T, et al. Serum antibodies to human leucocyte antigen (HLA)-E, HLA-F and HLA-G in patients with systemic lupus erythematosus (SLE) during disease flares: Clinical relevance of HLA-F autoantibodies. Clin Exp Immunol 2016;183(3):326-40.
[Crossref] [Google scholar] [PubMed]
- Lee YH, Bae SC, Song GG. Meta-analysis of associations between functional HLA-G polymorphisms and susceptibility to systemic lupus erythematosus and rheumatoid arthritis. Rheumatol Int 2015;35:953-61.
[Crossref] [Google scholar] [PubMed]
- Contini P, Murdaca G, Puppo F, Negrini S. HLA-G expressing immune cells in immune mediated diseases. Front Immunol 2020;11:1613.
[Crossref] [Google scholar] [PubMed]
- Bae SC, Lee YH. Association of HLA-G polymorphisms with systemic lupus erythematosus and correlation between soluble HLA‑G levels and the disease: A meta-analysis. Z Rheumatol 2021;80(1):96-102.
[Crossref] [Google scholar] [PubMed]
- Chen Z, Lan R, Ye K, Chen H, Chen C, Xu Y. Prioritization of diagnostic and prognostic biomarkers for lupus nephritis based on integrated bioinformatics analyses. Front Bioeng Biotechnol 2021;9:1-12.
[Crossref] [Google scholar] [PubMed]
- Dong C, Zhou Q, Fu T, Zhao R, Yang J, Kong X, et al. Circulating exosomes derived-miR-146a from systemic lupus erythematosus patients regulates senescence of mesenchymal stem cells. Biomed Res Int 2019;2019:1-10.
[Crossref] [Google scholar] [PubMed]
- Wang Z, Heid B, Dai R, Ahmed SA. Similar dysregulation of lupus-associated miRNAs in peripheral blood mononuclear cells and splenic lymphocytes in MRL/lpr mice. Lupus Sci Med 2018;5(1):e000290.
[Crossref] [Google scholar] [PubMed]
- Abulaban KM, Fall N, Nunna R, Ying J, Devarajan P, Grom A, et al. Relationship of cell-free urine MicroRNA with lupus nephritis in children. Pediatr Rheumatol 2016;14:1-7.
[Crossref] [Google scholar] [PubMed]
- Zheng CZ, Shu YB, Luo YL, Luo J. The role of miR-146a in modulating TRAF6-induced inflammation during lupus nephritis. Eur Rev Med Pharmacol Sci 2017;21(5):1041-8.
[Google scholar] [PubMed]
- Zhu Y, Xue Z, Di L. Regulation of miR-146a and TRAF6 in the diagnose of lupus nephritis. Med Sci Monit 2017;23:2550-7.
[Crossref] [Google scholar] [PubMed]
- Fu HX, Fan XP, Li M, Liu MJ, Sun QL. MiR-146a relieves kidney injury in mice with systemic lupus erythematosus through regulating NF-κB pathway. Eur Rev Med Pharmacol Sci 2019;23(16):7024-32.
[Crossref] [Google scholar] [PubMed]
