- *Corresponding Author:
- J. D. Li
Department of Hepatobiliary Surgery, Affiliated Hospital of North Sichuan Medical College, Hepatobiliary, Pancreatic and Intestinal Diseases Research Institute of North Sichuan Medical College, Nanchong, Sichuan 637000, China
E-mail: lijingdong358@126.com
| This article was originally published in a special issue, “Innovations in Biomedical Research and Drug Development” |
| Indian J Pharm Sci 2023:85(3) Spl Issue “5-14” |
This is an open access article distributed under the terms of the Creative Commons Attribution-NonCommercial-ShareAlike 3.0 License, which allows others to remix, tweak, and build upon the work non-commercially, as long as the author is credited and the new creations are licensed under the identical terms
Abstract
The main objective of the study is to investigate the expression level of chaperonin containing t-complex polypeptide 1 subunit 2 in hepatocellular carcinoma tissues and cell lines, and its effect on the proliferation, invasion and migration of hepatocellular carcinoma cells. Immunohistochemistry was used to detect the protein expression levels of chaperonin containing t-complex polypeptide 1 subunit 2 in 89 hepatocellular carcinoma tissues and tumor-adjacent tissues. Cell migration and invasion were detected by transwell assay. A subcutaneous xenograft model was constructed in nude mice to investigate the effect of chaperonin containing t-complex polypeptide 1 subunit 2 gene knockdown on tumor growth. Immunohistochemistry results indicated that 79.78 % of hepatocellular carcinoma patients had highly expressed chaperonin containing t-complex polypeptide 1 subunit 2 proteins and the expression in hepatocellular carcinoma tissues was significantly higher than that in tumor-adjacent tissues. The proliferation, invasion and migration of hepatoblastoma cell line HepG2 cells with chaperonin containing t-complex polypeptide 1 subunit 2 gene knockdown were inhibited, while those of human hepatoma-derived Huh-7 cells with chaperonin containing t-complex polypeptide 1 subunit 2 gene overexpression were enhanced. In vivo experiments also confirmed that the tumor growth rate in the chaperonin containing t-complex polypeptide 1 subunit 2 knockdown group was significantly slower than that in the vector group. Chaperonin containing t-complex polypeptide 1 subunit 2 is an independent poor prognostic factor of hepatocellular carcinoma and its expression is significantly upregulated in hepatocellular carcinoma tissues and cell lines. Chaperonin containing t-complex polypeptide 1 subunit 2 can significantly promote the proliferation, invasion and migration of hepatocellular carcinoma cells, suggesting that it can be an important therapeutic target for hepatocellular carcinoma.
Keywords
Chaperonin containing t-complex polypeptide 1 subunit 2, hepatocellular carcinoma, small interfering ribonucleic acid, immunohistochemistry
Hepatocellular Carcinoma (HCC) is the fourth most common malignant tumor and the second cause of cancer-related death in China, the main therapeutic methods of which include surgery, chemoradiotherapy, targeted therapy and immunotherapy, and recurrence and migration are the main causes of treatment failure[1]. It is significant to find more therapeutic targets for improving the clinical prognosis of HCC patients. Chaperonin Containing T-complex polypeptide 1 (CCT) is widely expressed in eukaryotes and it is involved in protein folding in an Adenosine Triphosphate (ATP)- dependent manner. Studies have proved that the dysfunction of CCT proteins is closely related to the occurrence and development of tumors[2]. The CCT protein family mainly consists of eight homologous subunits: T-Complex Polypeptide 1 (TCP1), Chaperonin Containing TCP1 Subunit 2 (CCT2), CCT3, CCT4, CCT5, CCT6A, CCT6B, CCT7 and CCT8. The function of these eight subunits varies due to highly different protein structure sequences[3]. TCP1 and CCT2 are highly expressed in breast cancer cells and are associated with the prognosis of breast cancer patients[4]. CCT5 accelerates the invasion and migration of lung adenocarcinoma cells by regulating the cyclin D1 expression[5]. CCT8 is found as an oncogene in promoting colorectal cancer progression and colorectal cancer patients with high CCT8 expression have a worse prognosis[6]. CCT2 is one of the subunits contained in the CCT complex and bioinformatics analysis showed that CCT2 is highly expressed in breast cancer cells and correlated with prognosis[7], but its role in HCC cells has not been reported. Therefore, in this study, the CCT2 expression in HCC tissues and cell lines was determined using bioinformatics and tissue cell samples. Moreover, its effect on the proliferation, invasion and migration of Hepatoblastoma cell line (HepG2) and Human Hepatoma-derived cell line (Huh-7) HCC cells was investigated in vivo and in vitro.
Materials and Methods
Materials:
HCC tissues, cells and animal origin: Human HCC tissues and tumor-adjacent tissues were collected from the Department of Pathology, Affiliated Hospital of North Sichuan Medical College. Normal hepatocytes like cancerous human liver cell line (HL-7702) and HCC cells (Metastatic Hepatocellular Carcinoma cell line (MHCC-97L), Huh-7 and HepG2) were purchased from the American Type Culture Collection (ATCC, United States of America (USA)). Bagg and Albino (BALB)/c-nu female nude mice aged 6-8 w were purchased from Beijing Huafukang Biotechnology Co., Ltd., China. All procedures used in this study were approved by the Ethics Committee of the Affiliated Hospital of North Sichuan Medical College.
Main reagents:
The cell culture medium, Fetal Bovine Serum (FBS) and trypsin were purchased from HyClone, USA. Penicillin and streptomycin were bought from Thermo Fisher Scientific, USA. The Ribonucleic Acid (RNA) extraction kit was provided by Omega, USA. The reverse transcription kit and real-time fluorescence quantitative kit was purchased from Takara, Japan. LipofectamineTM 2000 was bought from Invitrogen Company, USA. Small interfering RNA (siRNA)-CCT2, siRNA-Negative Control (NC) and plasmid cloning Deoxyribonucleic Acid (pcDNA) 3.1-CCT2 Overexpression plasmids (CCT2-OE) were constructed by Shanghai Genechem Co., Ltd., China. The Cell Counting Kit-8 (CCK-8), Radioimmunoprecipitation Assay (RIPA) buffer and Bicinchoninic Acid (BCA) protein assay kit were all purchased from Beyotime, China. The transwell chamber and Matrigel were provided by Becton, Dickinson and Company, USA. CCT2, Ki67, Proliferating Cell Nuclear Antigen (PCNA), E-cadherin, N-cadherin, Vimentin, beta (β)-actin primary antibody, goat anti-rabbit Immunoglobulin G (IgG) and goat anti-mouse IgG secondary antibodies were all bought from Proteintech, China. The general type of streptavidin-biotin detection system for Immunohistochemistry (IHC) was purchased from Beijing Zhongshan Jinqiao Biotechnology Co., Ltd., China. Primers were synthesized by Tsingke Biotechnology Co., Ltd., China.
Methods:
Clinical correlation analysis: The CCT2 expression in tumor and normal tissues and its correlation with the Overall Survival (OS) of HCC patients in the databases of The Cancer Genome Atlas (TCGA) and Genotype-Tissue Expression (GTEx) were analyzed using An Update to the Integrated Cancer Data Analysis Platform (UALCAN) (http://ualcan. path.uab.edu/analysis.html). Meanwhile, univariate and multivariate Cox regression analyses were performed based on the clinical sample data of HCC patients obtained from TCGA (https://portal.gdc. cancer.gov/).
Cell culture and transfection: Normal hepatocytes HL-7702 and HCC cells (MHCC-97L, Huh-7 and HepG2) were cultured in Minimum Essential Medium (MEM) and Dulbecco’s Modified Eagle Medium (DMEM) containing 10 % FBS, 100 U/ml penicillin and 100 μg/ml streptomycin. The incubator was kept at 37° with 5 % Carbon dioxide (CO2) and cell identification and mycoplasma testing were performed regularly. During transfection, HepG2 cells at the logarithmic growth stage were digested and inoculated into 6-well plates. When the cell fusion reached approximately 50 %, 50 nmol siRNACCT2 and siRNA-vector were transfected into HepG2 cells with LipofectamineTM 2000, recorded as siCCT2 and vector. In the same way, vector and CCT2-OE plasmids were transfected into Huh-7 cells, recorded as vector and CCT2-OE plasmids. The cells were cultured in the serum-free medium for 6 h and then cultured in the complete medium for 48 h. The transfection efficiency was observed under a fluorescence microscope.
Detection of CCT2 expression using immunohistochemical staining: Fresh HCC and tumor-adjacent tissues were fixed in 40 % paraformaldehyde for 24 h. Then, they were dehydrated, hyalinized and embedded. The embedded tissues were sliced with a thickness of 4 μm. Afterwards, they were dried in a drying oven at 60° for 60 min. Dewaxing and hydration were followed by xylene I for 20 min, xylene II for 20 min, 100 % ethanol for 10 min, 95 % ethanol for 5 min, 90 % ethanol for 5 min, 85 % ethanol for 5 min and 70 % ethanol for 5 min. The sections were then immersed in sodium citrate antigen repair solution for high pressure antigen repair for 30 min. After that, they were rinsed with Phosphate Buffered Saline (PBS) for three times, 5 min each time. A hydrophobic barrier pen was used to draw circles around the tissues. After adding endogenous peroxidase blockers, they were incubated at room temperature for 10 min and rinsed with PBS for three times, 5 min each time. Later, they were incubated at room temperature for 15 min after adding 100 μl of goat serum blocking solution. Afterwards, 100 μl of CCT2 primary antibody (1:200) was added and the incubation progressed at 4° overnight. After the incubation, they were rinsed with PBS for three times, 5 min each time. After adding 100 μl of biotin-labeled goat anti-rabbit IgG polymer, the sections were incubated at room temperature for 15 min and rinsed with PBS. After adding 100 μl of Horseradish Peroxidase (HRP)-labeled streptomycin working solution, the sections were incubated at room temperature for 15 min and rinsed with PBS. Then, 100 μl of Diaminobenzidine (DAB) solution (1:50) was added to control the chromogenic time and the sections were observed under an upright fluorescence microscope. The sections were rinsed with tap water and stained with hematoxylin staining solution for 20 s and were then immersed in tap water for 5 min. Following conventional dehydration transparent treatment, moderate amount of neutral gum was added for sealing. After the sections were dried, they were observed under a microscope and photographed. The staining results were analyzed using the Immunoreactive Score (IRS).
Detection of CCT2 expression using real-time Reverse Transcription-quantitative Polymerase Chain Reaction (RT-qPCR): Total RNA was extracted by the RNA extraction kit. RNA concentration and purity were measured by NanoDrop, according to the instructions. The RNA obtained was reversely transcribed into the complementary DNA (cDNA) using the reverse transcription kit. The reverse transcription conditions were: Reverse transcription at 37° for 15 min and inactivation at 85° for 5 s. The CCT2 gene messenger RNA (mRNA) expression after transfection was detected by RTqPCR using SYBR Premix Ex Taq II reagent. The reaction conditions were as follows: Predenaturation at 95° for 15 s, annealing at 60° for 1 min and a total of 40 cycles were performed. Primers were synthesized by Tsingke Biotechnology Co., Ltd., China. Glyceraldehyde-3-Phosphate Dehydrogenase (GAPDH) was taken as a housekeeping gene and the PCR amplification fragment length was 711 base pair (bp). Each sample was in sextuplicate, which was independently repeated for three times. CCT2 gene knockdown and overexpression were analyzed by the 2-ΔΔCt method. The primer sequence is tabulated in Table 1.
| Primer description | Sequence (5’ to 3’) |
|---|---|
| CCT2 F | TGCGGGCACAACATTATCCT |
| CCT2 R | TGCGCAAGAACACAAAGAGC |
| GAPDH F | TGGAAGGACTCATGACCACA |
| GAPDH R | TTCAGCTCAGGGATGACCTT |
Table 1: Primers for RT-qPCR
Detection of expression of CCT2, proliferationassociated and Epithelial-Mesenchymal Transition (EMT)-related proteins using Western blot: 48 h after HepG2 cells were transfected with siRNAs and Huh-7 cells were transfected with CCT2-OE plasmids, the cells were lysed using RIPA buffer with protease inhibitors to extract total protein. The protein concentration was determined using the BCA method. 1× protein loading buffer was added and the mixture was denaturated at 100° water bath for 5 min. Sodium Dodecyl-Sulfate Polyacrylamide Gel Electrophoresis (SDS-PAGE) gel was prepared and 30 μg of total protein was added to per well, which was then electrophoresed at 150 V for 60 min. Protein was transferred from gel to the 0.45 μm Polyvinylidene Fluoride (PVDF) membrane by the wet transfer method. The transfer processes at 100 V lasted for 60 min. 5 % skim milk powder was added before sealing at room temperature for 1 h. The primary antibodies of CCT2 (1:1000), Ki67 (1:2000), PCNA (1:5000), E-cadherin (1:5000), N-cadherin (1:2000), Vimentin (1:2000) and β-actin (1:1000) were incubated at 4° overnight. The membrane was rinsed with Tris Buffered Saline Tween (TBST) for three times, 10 min each time. HRP-labeled goat anti-rabbit IgG and goat anti-mouse IgG secondary antibodies (1:2000) were incubated at room temperature for 1 h. The membrane was rinsed with TBST for three times, 10 min each time. Development was performed using Electrochemiluminescence (ECL) developer and Image Lab software was used to obtain images and analyze the changes of CCT2 protein expression in each sample.
Detection of cell proliferation using CCK8: 48 h after HepG2 cells were transfected with siRNAs and Huh-7 cells were transfected with CCT2-OE plasmids, they were digested by 0.25 % trypsin and resuspended as a single cell suspension. 3000 cells per well were inoculated into 96-well plates. Each group was in sextuplicate and cultured in an incubator for 24 h. 10 μl of CCK8 solution was added to each well and the culture plates were incubated in the incubator for another 2 h. The absorbance at 450 nm was measured with an enzyme marker. Cell growth curves were plotted by measuring at the same time point for six consecutive days.
Detection of cell migration and invasion using transwell invasion assay: The upper transwell chamber was placed in a sterile 24-well plate and Matrigel was placed at 4° overnight beforehand. Matrigel was diluted in the serum-free medium at 1:4, which was then added into the upper transwell chamber, 100 μl each chamber. After incubation in a 37° incubator for 2 h, the residual liquid was removed from the culture plates. 50 μl of the medium containing 1 % FBS was added to each well and the incubation continued for 30 min at 37°. Transfected HepG2 cells and Huh-7 cells were digested with trypsin and counted. 1×10⁵/100 μl cells were inoculated in the upper chamber. Meanwhile, 400 μl of the medium containing 10 % serum was added into the lower chamber, which was then cultured in a 37°, 5 % CO2 incubator for 24 h. The chamber was taken out, fixed and stained with 0.2 % crystal violet/95 % ethanol for 30 min. Afterwards, it was rinsed with purified water for three times. Five fields were taken under a 10× light microscope to count the number of transmembrane cells. The experiment was repeated three times and the mean value was calculated. In the transwell migration assay, Matrigel coating of the upper chamber basement membrane was not required and the remaining process was the same as the invasion assay.
In vivo experiment: HepG2 cells transfected with siRNA-vector and siRNA-CCT2 for 48 h were digested with pancreatic enzyme and resuspended. The cell concentration was adjusted to 5×10⁶ cells/ml. 200 μl of cell suspension was inoculated subcutaneously into the right lower limb of nude mice. The tumor size was measured with Vernier calipers every 4 d. When the maximum tumor volume reached 1500 mm3, the mice were sacrificed by dislocating cervical vertebrae and photographed.
Data statistics and analysis:
Statistical Package for the Social Sciences (SPSS) 21.0 software was used for data analysis. All biological experiments were repeated three times. Measurement data were expressed as mean±standard deviation (x̄ ±s). Student’s t-test was used for comparison between two groups and one-way Analysis of Variance (ANOVA) was used for comparison between multiple groups, p<0.05 was considered statistically significant.
Results and Discussion
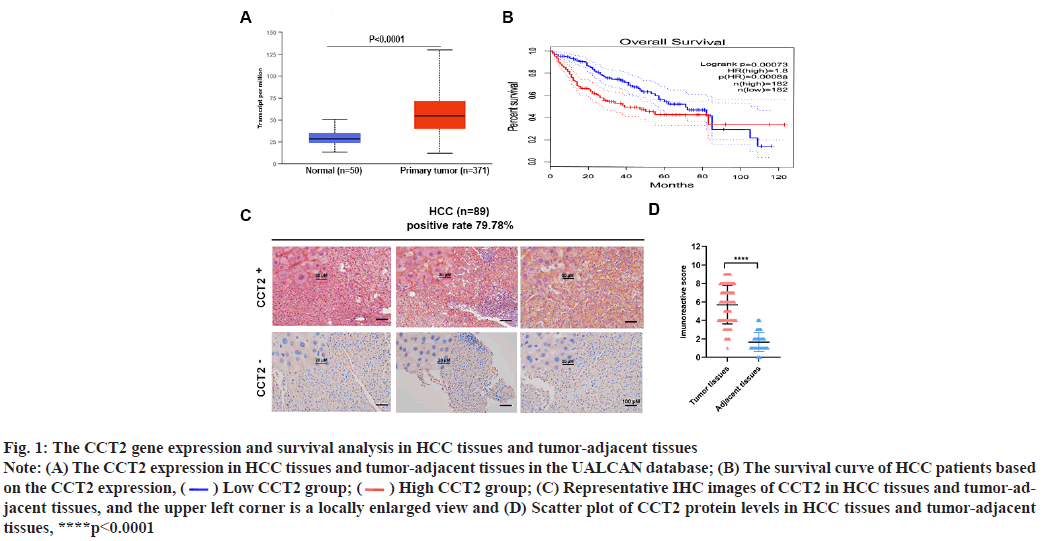
CCT2 is a gene associated with HCC progression and prognosis was explained below. The CCT2 gene expression in 421 cases (371 cases of HCC tissues and 50 cases of tumor-adjacent tissues) was obtained by inputting CCT2 into the UALCAN database and selecting HCC. CCT2 was highly expressed in HCC tissues (p<0.0001, fig. 1A) and HCC patients with high CCT2 expression had a worse prognosis than those with low CCT2 expression (p=0.00073, fig. 1B). Subsequently, IHC was used to detect the CCT2 expression in 89 HCC tissue samples from our center. It was found that the CCT2 expression was upregulated in 79.78 % (71/89) of HCC tissues (fig. 1C) and the expression level in HCC tissues was significantly higher than that in tumor-adjacent tissues (p<0.0001, fig. 1D). To further explore CCT2’s prognostic value in HCC, univariate and multivariate Cox regression analyses were performed based on the clinical sample data of HCC patients obtained from TCGA using the log-Rank method. As shown in Table 2, the univariate Cox analysis results suggested that T staging, M staging, Tumor, Nodes and Metastases (TNM) staging, and CCT2 expression were correlated with the prognosis of HCC patients. The multivariate Cox analysis results showed that T staging, M staging and CCT2 expression were independent risk factors for HCC prognosis.
| Parameters | Univariate regression analysis | Multivariate regression analysis | ||
|---|---|---|---|---|
| Hazard ratio (95 % confidence interval) | p | Hazard ratio (95 % confidence interval) | p | |
| Age (≤60/>60 y) | 1.34 (0.87-2.05) | 0.184 | ||
| Gender | 1.39 (0.91-2.15) | 0.134 | ||
| Pathological grading | 1.12 (0.89-1.42) | 0.33 | ||
| TNM staging | 1.74 (1.37-2.19) | <0.001 | ||
| T staging | 1.71 (1.38-2.13) | <0.001 | 1.64 (1.32-2.06) | <0.001 |
| N staging | 2.041 (0.49-8.18) | 0.334 | ||
| M staging | 4.03 (1.27-12.83) | 0.018 | 4.04 (1.26-12.9) | 0.019 |
| CCT2 expression | 1.91 (1.23-2.95) | 0.004 | 1.76 (1.09-2.82) | 0.018 |
Table 2: Univariate and Multivariate Cox Regression Analyses of CCT2 in TCGA
Fig. 1: The CCT2 gene expression and survival analysis in HCC tissues and tumor-adjacent tissues
Note: (A) The CCT2 expression in HCC tissues and tumor-adjacent tissues in the UALCAN database; (B) The survival curve of HCC patients based
on the CCT2 expression,  Low CCT2 group;
  High CCT2 group; (C) Representative IHC images of CCT2 in HCC tissues and tumor-adjacent
tissues, and the upper left corner is a locally enlarged view and (D) Scatter plot of CCT2 protein levels in HCC tissues and tumor-adjacent
tissues, ****p<0.0001
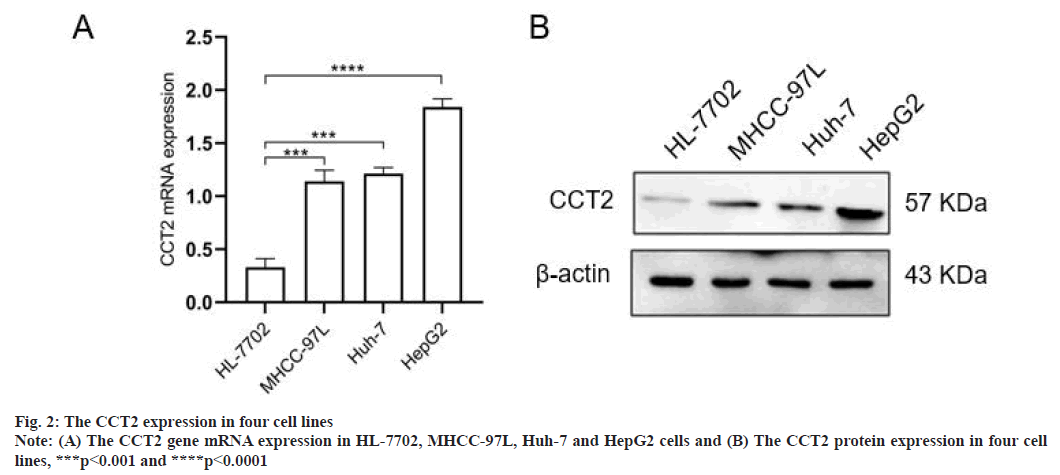
Increased CCT2 gene expression in HCC cell lines were shown in fig. 2. Compared with normal hepatocytes HL-7702, the CCT2 gene mRNA expression was increased in HCC cell lines (MHCC 97L, Huh-7 and HepG2) (p<0.001, fig. 2A). The CCT2 protein expression in cell lines was further detected and the results were consistent with the variation in the mRNA level. Among the results, CCT2 were higher expressed in HepG2 cells and lower expressed in Huh-7 cells, which was used for subsequent functional analysis (fig. 2B).
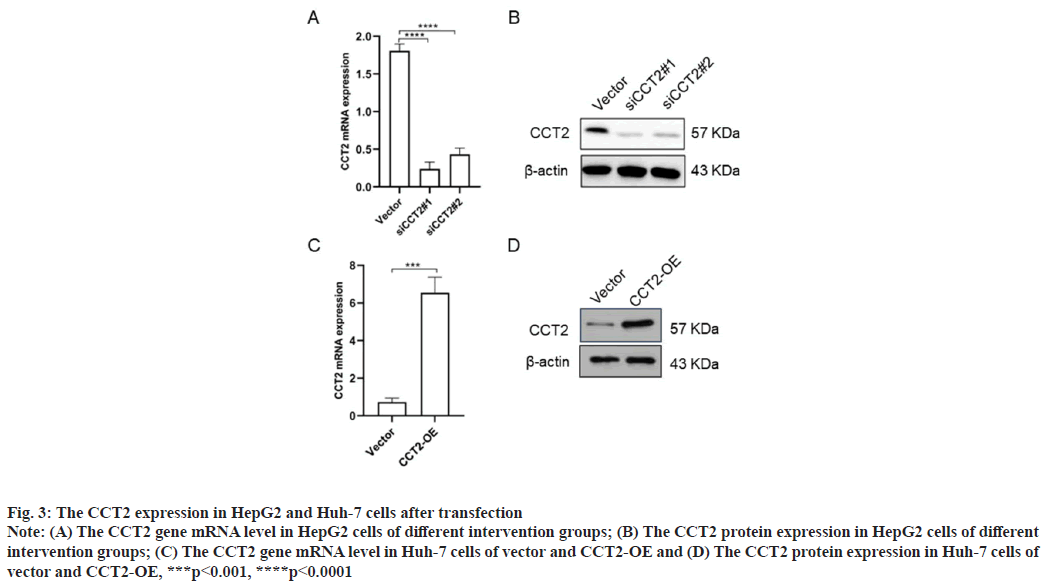
CCT2 gene knockdown and overexpression in HepG2 and Huh-7 cells were shown in fig. 3. To further explore CCT2’s biological function, we constructed cell models of CCT2 gene knockdown and overexpression. The specific process was as follows. 48 h after siRNA-vector and siRNA-CCT2 were transfected into HepG2 cells and vector, then CCT2-OE plasmids were transfected into Huh-7 cells, RNA and total protein were extracted to detect the CCT2 expression. RT-qPCR results suggested that siCCT2#1 and siCCT2#2 could significantly reduce the CCT2 gene expression in HepG2 cells compared with the vector group (p<0.0001, fig. 3A) and siCCT2#1 showed a larger decreasing amplitude. Western blot results further confirmed that siCCT2 could significantly reduce the CCT2 protein expression in HepG2 cells (fig. 3B). The CCT2 expression in the Huh-7 CCT2-OE group was significantly increased (p<0.001, fig. 3C) and the establishment of the Huh-7 CCT2-OE group was successful (fig. 3D).
Fig. 3: The CCT2 expression in HepG2 and Huh-7 cells after transfection
Note: (A) The CCT2 gene mRNA level in HepG2 cells of different intervention groups; (B) The CCT2 protein expression in HepG2 cells of different
intervention groups; (C) The CCT2 gene mRNA level in Huh-7 cells of vector and CCT2-OE and (D) The CCT2 protein expression in Huh-7 cells of
vector and CCT2-OE, ***p<0.001, ****p<0.0001
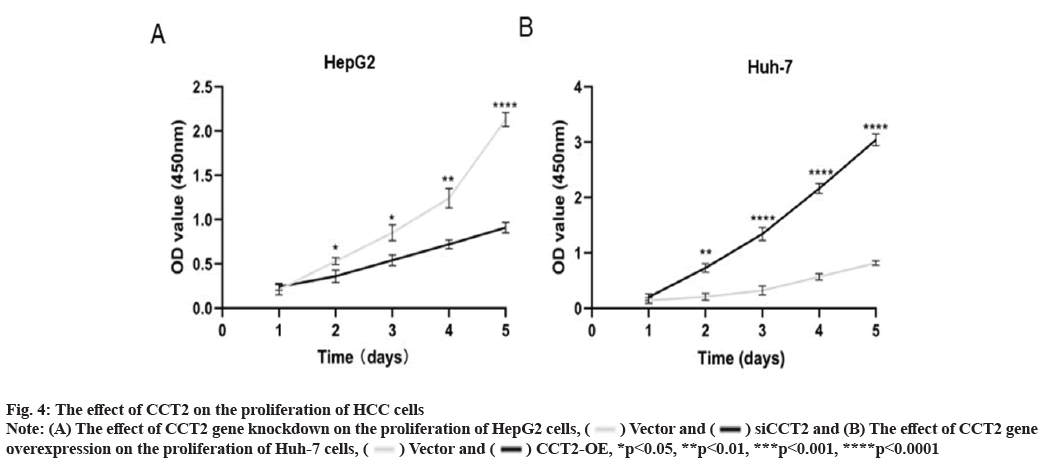
CCT2 promotes the proliferation of HCC cells as shown in fig. 4. We intended to clarify the effect of CCT2 on the proliferation of HCC cells using the constructed cell models of CCT2 gene knockdown and overexpression. The CCK8 proliferation experiment results showed that compared with the vector group, the cell proliferation in the siCCT2 group was significantly inhibited from the 2nd d (p<0.05, fig. 4A). This inhibitory effect was more obvious with culture time (p<0.0001). The proliferation of Huh-7 cells with CCT2 gene overexpression was significantly enhanced (p<0.0001, fig. 4B).
Fig. 4: The effect of CCT2 on the proliferation of HCC cells
Note: (A) The effect of CCT2 gene knockdown on the proliferation of HepG2 cells,  Vector and
  siCCT2 and (B) The effect of CCT2 gene
overexpression on the proliferation of Huh-7 cells,
  Vector and
  CCT2-OE, *p<0.05, **p<0.01, ***p<0.001, ****p<0.0001
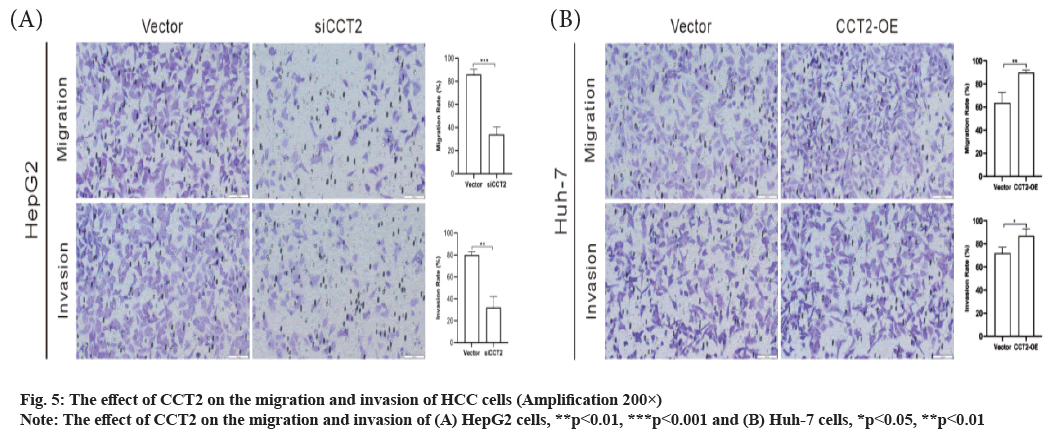
CCT2 promotes the migration and invasion of HCC cells as shown in fig. 5. Next, we further explored the effect of CCT2 on the invasion and migration of HCC cells. The migration assay results showed that the number of migrating cells in the siCCT2 group was significantly reduced compared with the vector group (t=11.26, p<0.001, fig. 5A) and CCT2 gene knockdown inhibited cell migration. The invasion assay results also indicated that compared with the vector group, the number of invading cells in the siCC T2 group was significantly reduced and the invasion of cells was inhibited (t=7.856, p<0.01, fig. 5A). Huh-7 cells with CCT2 gene overexpression had enhanced abilities to migrate (t=4.909, p<0.01, fig. 5B) and invade (t=3.3, p<0.05, fig. 5B) than those in the vector group.
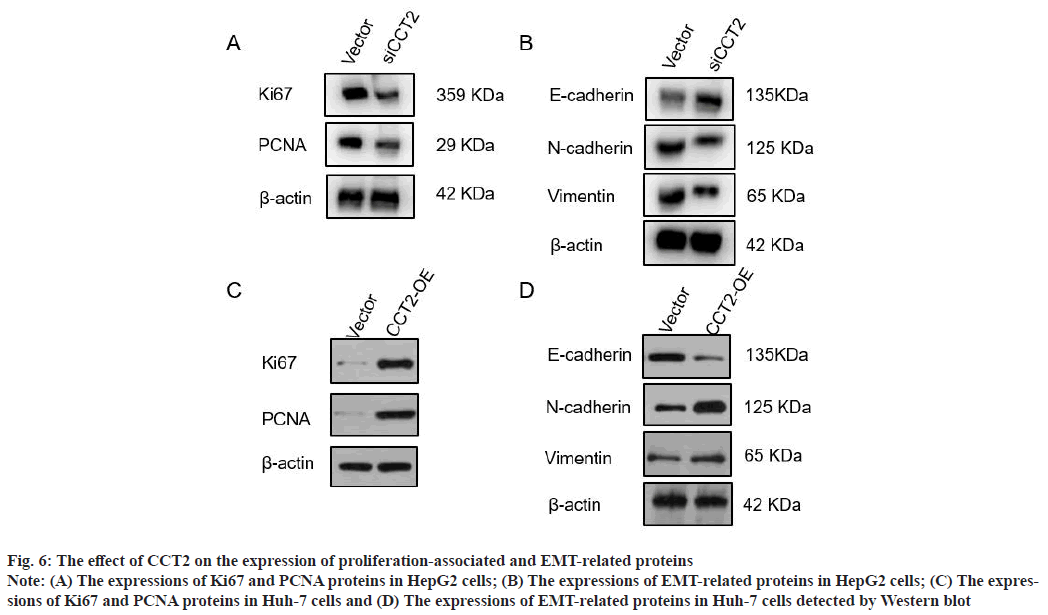
CCT2 promotes the expression of HCC cell proliferation-associated and EMT-related proteins as shown in fig. 6. To further verify the effect of CCT2 on the proliferation and migration of HCC cells, the expression of proliferation-associated proteins (Ki67 and PCNA), and EMT-related proteins (E-cadherin, N-cadherin and Vimentin) in HCC cells with CCT2 gene knockdown and overexpression were detected. Western blot results showed that compared with the vector group, the expressions of proliferationassociated proteins (Ki67 and PCNA) in the siCCT2 group were significantly decreased (fig. 6A). The expression of EMT-related protein E-cadherin increased in the siCCT2 group, while the expressions of Vimentin and N-cadherin decreased (fig. 6B). The expressions of proliferation-associated proteins (Ki67 and PCNA) increased in Huh-7 cells with CCT2 gene overexpression (fig. 6C). The expression of epithelial phenotypic protein E-cadherin decreased, while the expressions of interstitial phenotypic proteins (N-cadherin and Vimentin) increased (fig. 6D).
Fig. 6: The effect of CCT2 on the expression of proliferation-associated and EMT-related proteins
Note: (A) The expressions of Ki67 and PCNA proteins in HepG2 cells; (B) The expressions of EMT-related proteins in HepG2 cells; (C) The expressions
of Ki67 and PCNA proteins in Huh-7 cells and (D) The expressions of EMT-related proteins in Huh-7 cells detected by Western blot
CCT2 gene knockdown inhibits the growth of HepG2 cells in vivo as shown in fig. 7. The effect of CCT2 on the growth of HepG2 cells in vivo was detected by xenograft models in nude mice. Compared with the vector group, CCT2 gene knockdown significantly reduced the growth rate of tumor tissues (p<0.01).
HCC is one of the most common primary liver cancer and is still the fourth leading cause of cancer-related death worldwide[8]. Although targeted therapy and immunotherapy have improved the OS in advanced patients, the prognosis for HCC patients remains poor, with an overall 5 y survival rate of less than 12 %-15 %. Finding more specific targets is of great significance for improving the survival prognosis of HCC patients[9].
CCT is an ATP-dependent chaperonin with two backto- back symmetric ring structures. Each ring contains eight homologous subunits (TCP-1, CCT2-CCT8). Each subunit consists of an equatorial domain and an apical domain coded by different genes, which can bind ATP to substrates[10]. CCT complexes are responsible for the proper folding of approximately 10 % of proteins in cells, including cytoskeletal proteins and cell cycle regulators. In tumors, CCT can affect the occurrence and development of tumors by folding multiple oncogenes, proteins encoded by oncosuppressor genes and various cellular regulatory factors[11]. Currently, increasingly more studies have shown that multiple components of CCT are abnormally expressed in multiple tumors and regulate proteins encoded by many cancer-related genes. Klimczak et al. used the breast cancer cohort analysis in the TCGA database and found that CCT1 and CCT2 were highly expressed in breast cancer tumor tissues, which were associated with poor prognosis of breast cancer patients[7]. Liu et al. found that CCT3 could act as the upstream trigger factor of Yes-Associated Protein (YAP) and Transcription Factor CP2 (TFCP2) to regulate their expression, thus affecting the malignant phenotype of HCC[12]. Additionally, Li et al. established that the CCT4 expression was related to the clinical prognosis of HCC patients and the higher the CCT4 expression, the shorter the OS of HCC patients[13]. Recent studies have proved that CCT2 can be used as a novel polymeric autophagy receptor to selectively degrade solid aggregates without ubiquitin dependence and it is expected to be an important target for neurodegenerative diseases[14,15]. However, until now, there have been few studies on the role of CCT2 in tumors and most of them stay in bioinformatics analysis based on big data and lack experimental confirmation. Its mechanism in the occurrence and development of HCC has also not been reported in the literature.
Therefore, we analyzed the CCT2 gene expression in 371 HCC samples and 50 tumor-adjacent tissue samples using the UALCAN database. The CCT2 expression in HCC tissues was significantly higher than that in tumor-adjacent normal tissues and the prognosis of HCC patients with high CCT2 expression was worse and their survival time was significantly shortened compared with those with low CCT2 expression. To further verify this result, 89 HCC and tumor-adjacent tissues were collected and the CCT2 protein expression was detected by IHC assay. The results showed that CCT2 was highly expressed in more than 75 % of HCC patients and the CCT2 expression in HCC tissues was significantly higher than that in tumor-adjacent tissues. Univariate and multivariate Cox regression analyses suggested that CCT2 was an independent poor prognostic factor for HCC patients. Subsequently, we detected the CCT2 expressions in normal hepatocytes HL-7702 and three common HCC cell lines (MHCC-97L, Huh-7 and HepG2). The CCT2 expression in HCC cells was higher than that in normal hepatocytes. These results suggest that the CCT2 expression is upregulated in both HCC tissues and cells.
To further explore CCT2’s biological function, we successfully constructed HepG2 cell models with CCT2 gene knockdown and Huh-7 cell models with CCT2 gene overexpression using siRNA technology. RT-qPCR and Western blot were used to verify that the knockdown efficiency was 81.2 % and the overexpression efficiency was 80.9 %, which met the requirements of subsequent experiments. Afterwards, we used CCK-8 cell proliferation assay, transwell migration and invasion assay to explore the effect of CCT2 on the proliferation, migration and invasion of HCC cells. The experimental results showed that the proliferation of HepG2 cells with CCT2 gene knockdown was significantly slowed down and the migration and invasion were significantly reduced, while the proliferation, migration and invasion of Huh-7 cells with CCT2 gene overexpression were significantly enhanced. To further verify our experimental results, we then detected the expressions of proliferation-associated proteins (Ki67 and PCNA) and EMT-related proteins (E-cadherin, N-cadherin and Vimentin) in HepG2 cells and Huh-7 cells, verifying the effect of CCT2 gene on the proliferation and migration of HCC cells at the molecular level. Next, we further confirmed that CCT2 gene knockdown could significantly inhibit the growth rate of tumor tissues by constructing a subcutaneous xenograft model in nude mice. These results suggest that CCT2, as an oncogenic gene, can promote the growth, migration and invasion of HCC cells. At present, we have preliminarily observed that CCT2 can significantly affect the progression of HCC cells. In the follow-up study, we will combine transcriptome sequencing, protein spectroscopy and other omics techniques to clarify the molecular regulatory mechanism of CCT2 affecting the proliferation and migration of HCC.
In summary, this study preliminarily confirmed that the CCT2 expression is significantly elevated in HCC tissues and is a prognostic-related gene, and targeting CCT2 can significantly reduce the proliferation, migration and invasion of HCC cells. In the followup study, we will clarify the molecular mechanism of CCT2 expression regulation and the role of CCT2 in the tumor microenvironment.
Funding:
This study was funded by the Scientific Research Project of Sichuan Provincial Health Commission (20PJ149), the Science and Technology Planning Project of Nanchong (20YFJ0091) and the Research project of Affiliated Hospital of North Sichuan Medical College (2022JB003).
Conflict of interests:
The authors declared no conflict of interest.
References
- Cao MM, Li H, Sun DQ, He SZ, Yang F, Yan ZZ, et al. Global epidemiological status of liver cancer, 2020. Chin J Cancer Prev Treat 2022;29(5):322-8.
- Wang DY, Kamuda K, Montoya G, Mesa P. The TRiC/CCT chaperonin and its role in uncontrolled proliferation. Adv Exp Med Biol 2020;1243:21-40.
[Crossref] [Google scholar] [PubMed]
- Jin M, Liu C, Han W, Cong Y. TRiC/CCT chaperonin: Structure and function. Subcell Biochem 2019;93:625-54.
[Crossref] [Google scholar] [PubMed]
- Guest ST, Kratche ZR, Bollig-Fischer A, Haddad R, Ethier SP. Two members of the TRiC chaperonin complex, CCT2 and TCP1 are essential for survival of breast cancer cells and are linked to driving oncogenes. Exp Cell Res 2015;332(2):223-35.
[Crossref] [Google scholar] [PubMed]
- Meng Y, Yang L, Wei X, Luo H, Hu Y, Tao X, et al. CCT5 interacts with cyclin D1 promoting lung adenocarcinoma cell migration and invasion. Biochem Biophys Res Commun 2021;567:222-9.
[Crossref] [Google scholar] [PubMed]
- Liao Q, Ren Y, Yang Y, Zhu X, Zhi Y, Zhang Y, et al. CCT8 recovers WTp53-suppressed cell cycle evolution and EMT to promote colorectal cancer progression. Oncogenesis 2021;10(12):84.
[Crossref] [Google scholar] [PubMed]
- Klimczak M, Biecek P, Zylicz A, Zylicz M. Heat shock proteins create a signature to predict the clinical outcome in breast cancer. Sci Rep 2019;9(1):1-15.
[Crossref] [Google scholar] [PubMed]
- Villanueva A. Hepatocellular carcinoma. N Engl J Med 2019;380(15):1450-62.
- Kulik L, El-Serag HB. Epidemiology and management of hepatocellular carcinoma. Gastroenterology 2019;156(2):477-91.
[Crossref] [Google scholar] [PubMed]
- Gestaut D, Limatola A, Joachimiak L, Frydman J. The ATP-powered gymnastics of TRiC/CCT: An asymmetric protein folding machine with a symmetric origin story. Curr Opin Struct Biol 2019;55:50-8.
[Crossref] [Google scholar] [PubMed]
- Balchin D, Miličić G, Strauss M, Hayer-Hartl M, Hartl FU. Pathway of actin folding directed by the eukaryotic chaperonin TRiC. Cell 2018;174(6):1507-21.
[Crossref] [Google scholar] [PubMed]
- Liu Y, Zhang X, Lin J, Chen Y, Qiao Y, Guo S, et al. CCT3 acts upstream of YAP and TFCP2 as a potential target and tumour biomarker in liver cancer. Cell Death Dis 2019;10(9):644.
[Crossref] [Google scholar] [PubMed]
- Li F, Liu CS, Wu P, Ling AS, Pan Q, Li XN. CCT4 suppression inhibits tumor growth in hepatocellular carcinoma by interacting with Cdc20. Chin Med J 2021;134(22):2721-9.
[Crossref] [Google scholar] [PubMed]
- Ma X, Lu C, Chen Y, Li S, Ma N, Tao X, et al. CCT2 is an aggrephagy receptor for clearance of solid protein aggregates. Cell 2022;185(8):1325-45.
[Crossref] [Google scholar] [PubMed]
- Zhang Z, Klionsky DJ. CCT2, a newly identified aggrephagy receptor in mammals, specifically mediates the autophagic clearance of solid protein aggregates. Autophagy 2022;18(7):1483-5.
[Crossref] [Google scholar] [PubMed]
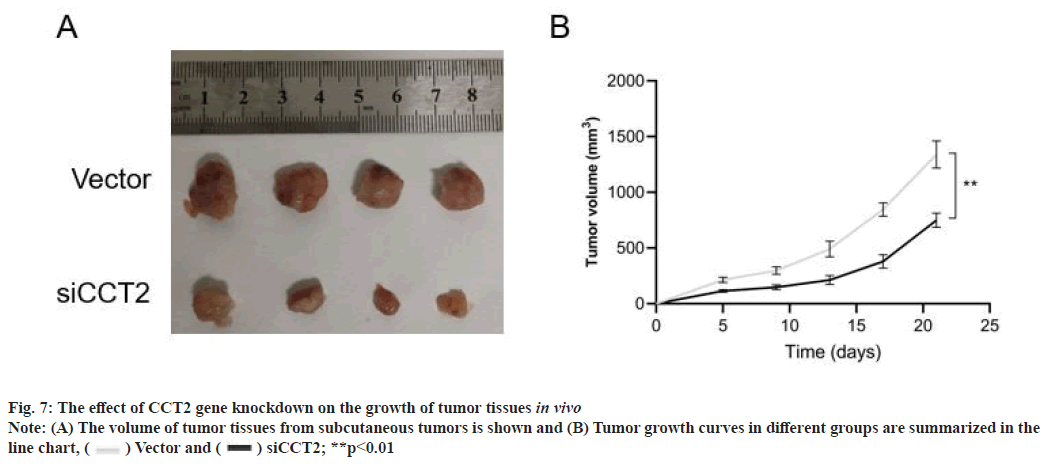
 Vector and
  siCCT2; **p<0.01


